【Canvas】摆线模拟
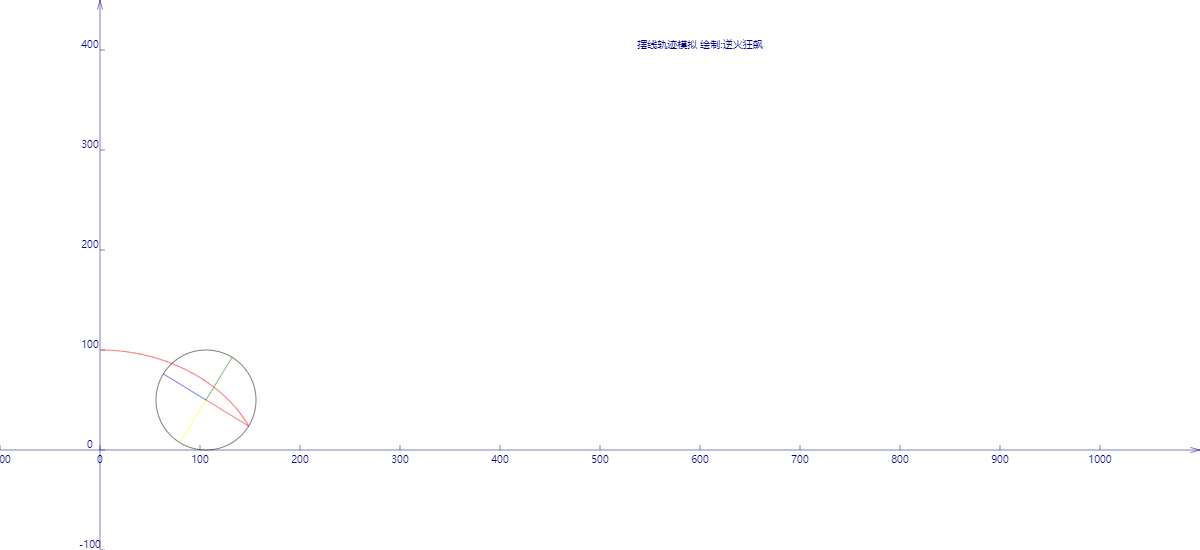
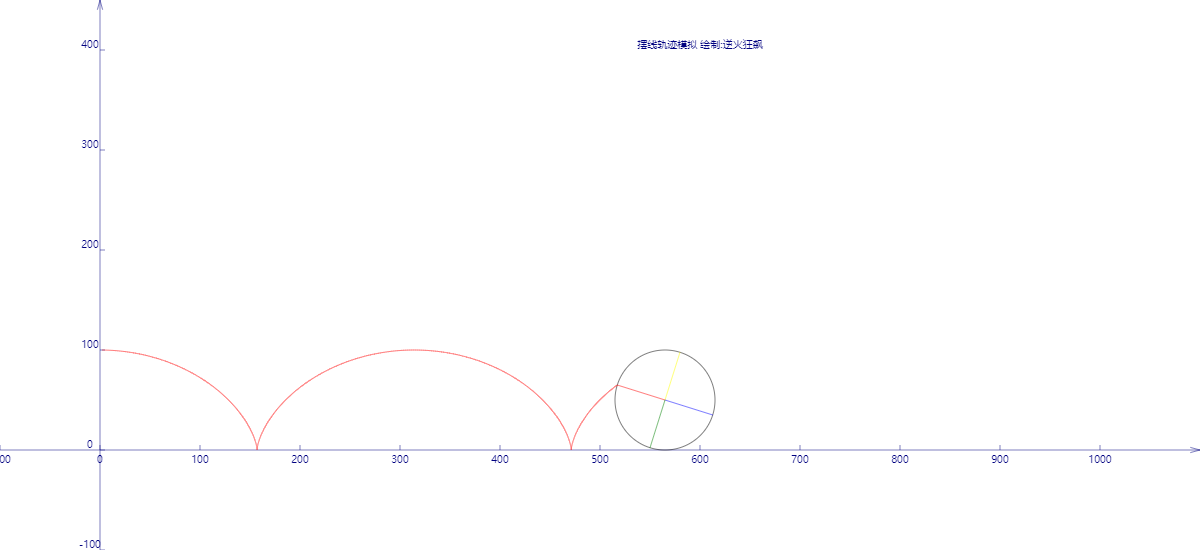
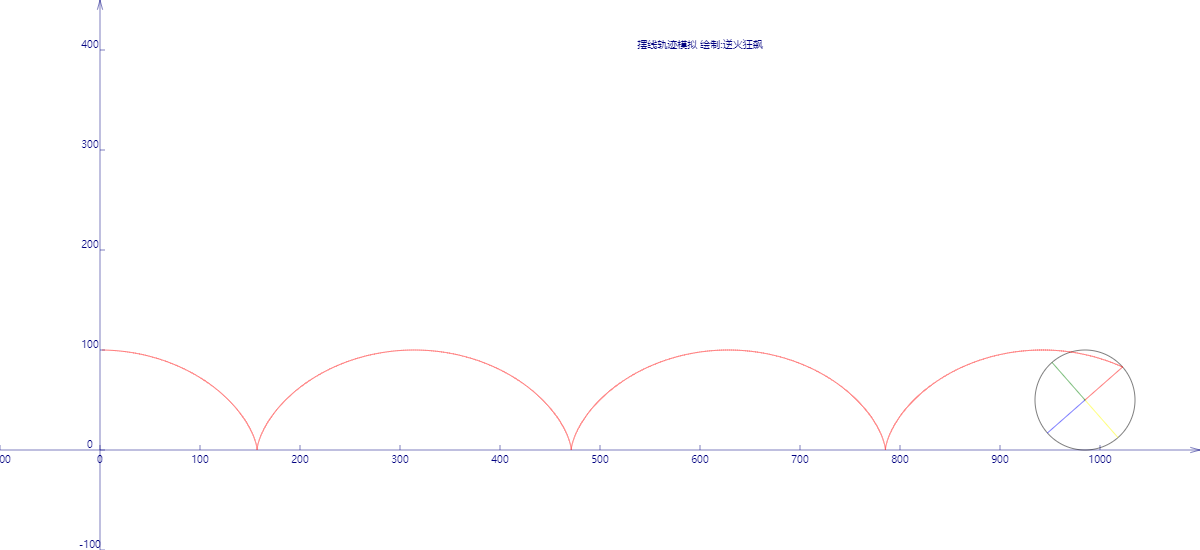
摆线是轮上一点的轨迹,又称最快降速线。
先上图:


代码:
<!DOCTYPE html>
<html lang="utf-8">
<meta http-equiv="Content-Type" content="text/html; charset=utf-8"/>
<head>
     <title>摆线模拟</title>
     <style type="text/css">
     .centerlize{
        margin:0 auto;
        border:0px solid red;
        width:1200px;height:550px;
     }

     </style>
    </head>

     <body onload="draw();">
        <div class="centerlize">
            <canvas id="myCanvas" width="1200px" height="550px" style="border:1px dashed black;">
                出现文字表示您的浏览器尚不支持HTML5 Canvas
            </canvas>
        </div>
     </body>
</html>
<script type="text/javascript">
<!--
// 画布宽度
const WIDTH=1200;

// 画布高度
const HEIGHT=550;

// 画布环境
var context=0;

// 总时间
var t=0;

// 画图前初始化
function draw(){
    var canvas=document.getElementById('myCanvas');
    canvas.width=WIDTH;
    canvas.height=HEIGHT;

    context=canvas.getContext('2d');

    // 进行屏幕坐标系到笛卡尔坐标系的变换,原点移动到画布中央,右方为X正向,上方为Y的正向
    context.translate(100,450);
    context.rotate(getRad(180));
    context.scale(-1,1);

    slot=new Slot();

    animate();
};

//-------------------------------
// 画图
//-------------------------------
function animate(){
    t+=0.1;// 时间每轮增加0.1

    slot.update(t);
    slot.paintBg(context);
    slot.paint(context);

    if(slot.isWheelVisible()){
        window.requestAnimationFrame(animate);
    }
}

//-------------------------------
// Slot对象定义处
//-------------------------------
function Slot(){
    var obj=new Object;

    // x:轮子圆心横坐标,r:轮子半径,v:轮子圆心水平平移速度,cds:轮最上一点的轨迹,points:轮上四条幅的终点
    obj.wheel={"x":0,"r":50,"v":10,"cds":[],"points":[]};

    // 随时间更新轮上点的位置
    obj.update=function(t){
        this.wheel.x=this.wheel.v*t;// 圆心位置
        let omega=this.wheel.v/this.wheel.r;// 角速度
        let theata=omega*t;// 转动的角度

        let x=this.wheel.x+this.wheel.r*Math.sin(theata);// 最上一点轨迹横坐标
        let y=this.wheel.r+this.wheel.r*Math.cos(theata);// 最上一点轨迹纵坐标

        let arr={"x":x,"y":y};
        this.wheel.cds.push(arr);

        // 辐条四终点
        this.wheel.points=[];
        for(var i=0;i<4;i++){
            let x1=this.wheel.x+this.wheel.r*Math.sin(theata+i*Math.PI/2);
            let y1=this.wheel.r+this.wheel.r*Math.cos(theata+i*Math.PI/2);
            let arr1={"x":x1,"y":y1};
            this.wheel.points.push(arr1);
        }
    };

    // 轮子可见否
    obj.isWheelVisible=function(){
        return this.wheel.x<1100+this.wheel.r;
    }

    // 画背景
    obj.paintBg=function(ctx){
        // 清屏
        ctx.clearRect(-100,-100,WIDTH,HEIGHT);

        drawAxisX(ctx,-100,WIDTH-100,100);
        drawAxisY(ctx,-100,HEIGHT-100,100);

        drawText(ctx,"摆线轨迹模拟 绘制:逆火狂飙",600,400);
    };

    // 画前景
    obj.paint=function(ctx){
        // 画轮子
        ctx.strokeStyle="black";
        ctx.beginPath();
        ctx.arc(this.wheel.x,this.wheel.r,this.wheel.r,0,Math.PI*2,true);
        ctx.stroke();

        // 画四根不同颜色的辐条
        for(var i=0;i<this.wheel.points.length;i++){
            var point=this.wheel.points[i];

            ctx.strokeStyle=getColor(i);

            ctx.beginPath();
            ctx.moveTo(this.wheel.x, this.wheel.r);
            ctx.lineTo(point.x, point.y);
            ctx.stroke();
            ctx.closePath();
        }

        // 画起始时轮子上最上一点的轨迹
        paintCurve(ctx,"red",this.wheel.cds);
    };

    return obj;
}
// 连点成线画曲线
function paintCurve(ctx,color,cds){
    var SU=1;// Scale Unit

    ctx.strokeStyle = color;
    ctx.beginPath();
    for(var i=0; i<cds.length; i++){
        ctx.lineTo(cds[i].x*SU,cds[i].y*SU);
    }
    ctx.stroke();
    ctx.closePath();
}
// 画横轴
function drawAxisX(ctx,start,end,step){
    ctx.save();

    ctx.lineWidth=0.5;
    ctx.strokeStyle='navy';
    ctx.fillStyle='navy';

    // 画轴
    ctx.beginPath();
    ctx.moveTo(start, 0);
    ctx.lineTo(end, 0);
    ctx.stroke();
    ctx.closePath();

    // 画箭头
    ctx.beginPath();
    ctx.moveTo(end-Math.cos(getRad(15))*10, Math.sin(getRad(15))*10);
    ctx.lineTo(end, 0);
    ctx.lineTo(end-Math.cos(getRad(15))*10, -Math.sin(getRad(15))*10);
    ctx.stroke();
    ctx.closePath();

    // 画刻度
    var x,y;
    y=5;
    for(x=start;x<end;x+=step){
        ctx.beginPath();
        ctx.moveTo(x, 0);
        ctx.lineTo(x, y);

        ctx.stroke();
        ctx.closePath();

        drawText(ctx,x+"",x,y-20);
    }

    ctx.restore();
}
// 画纵轴
function drawAxisY(ctx,start,end,step){
    ctx.save();

    ctx.lineWidth=0.5;
    ctx.strokeStyle='navy';
    ctx.fillStyle='navy';

    // 画轴
    ctx.beginPath();
    ctx.moveTo(0, start);
    ctx.lineTo(0, end);
    ctx.stroke();
    ctx.closePath();

    // 画箭头
    ctx.beginPath();
    ctx.moveTo(Math.sin(getRad(15))*10, end-Math.cos(getRad(15))*10);
    ctx.lineTo(0, end);
    ctx.lineTo(-Math.sin(getRad(15))*10, end-Math.cos(getRad(15))*10);
    ctx.stroke();
    ctx.closePath();

    // 画刻度
    var x,y;
    x=5;
    for(y=start;y<end;y+=step){
        ctx.beginPath();
        ctx.moveTo(x, y);
        ctx.lineTo(0, y);

        drawText(ctx,y+"",x-15,y);

        ctx.stroke();
        ctx.closePath();
    }
}

//-------------------------------
// 角度得到弧度
//-------------------------------
function getRad(degree){
    return degree/180*Math.PI;
}

//-------------------------------
// 得到颜色
//-------------------------------
function getColor(index){
    var arr=["red","yellow","blue","green","skyblue","purple","#aa0000",
             "orange","maroon","navy",
             "lime","teal","fuchsia",
             "aqua","black"];

    if(index>arr.length){
        index=index % arr.length;
    }

    return arr[index];
}

//-------------------------------
// 在笛卡尔坐标系中绘制文字
//-------------------------------
function drawText(ctx,text,x,y){
    ctx.save();
    ctx.translate(x,y)
    ctx.rotate(getRad(180))
    ctx.scale(-1,1)

    ctx.textBaseline="bottom";
    ctx.textAlign="center";
    ctx.fillText(text,0,0);
    ctx.restore();
}
//-->
</script>
后记:
搞清楚时间是总量还是增量,程序就好写了,难度不大,懂得都懂,就不赘述了。
END


