
python-matplotlib-lec0
直奔主题吧。。以下是对matplotlib画图的简单讲解,代码已测试。
win7 + pycharm + python 2.7
参考文档:
http://old.sebug.net/paper/books/scipydoc/matplotlib_intro.html
捷径:查看gallery,寻找要画的图,copy代码,修改,done
http://matplotlib.org/gallery.html
# -*- coding: utf-8 -*-
import numpy as np
import matplotlib.pyplot as plt
x = np.linspace(0, 10, 1000)
y = np.sin(x)
z = np.cos(x**2)
# figsize:单位为英寸 dpi:指定绘图对象的分辨率,default is 80.
# 宽度现在为8*80=640
# 但是用工具栏中的保存按钮保存下来的png图像的大小是800*400像素。
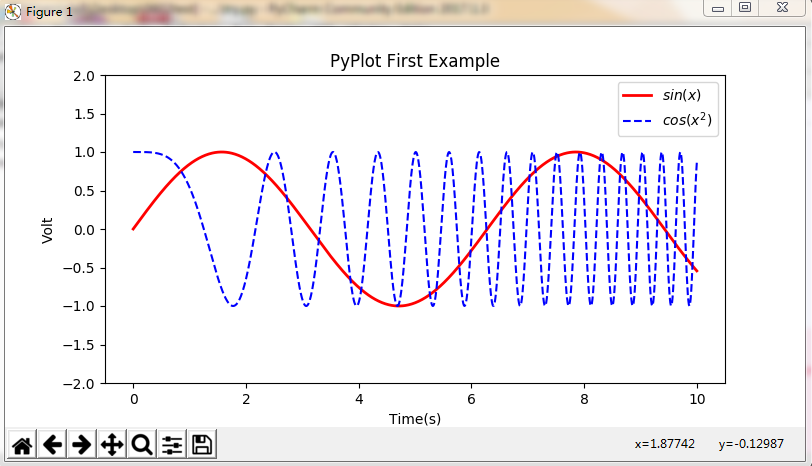
plt.figure(figsize=(8,4))
# latex inserted, use it directly.
plt.plot(x,y,label="$sin(x)$",color="red",linewidth=2)
# "b--":formated string, blue and dashed line
plt.plot(x,z,"b--",label="$cos(x^2)$")
plt.xlabel("Time(s)")
plt.ylabel("Volt")
plt.title("PyPlot First Example")
plt.ylim(-2, 2)
plt.legend()
plt.show()
# figure(i) means draw ith figure. If i exists, it will not create new figure object,
# but make it as current figure object
plt.figure(1)
plt.plot(x,y,label="$sin(x)$",color="red",linewidth=2)
plt.show()
plt.figure(2)
plt.plot(x,z,"b--",label="$cos(x^2)$")
plt.show()
