prometheus 监控案例-Tomcat、Redis、Mysql、Haproxy、Nginx
服务监控
可以根据prometheus官网找到对应服务的exporter
https://prometheus.io/docs/instrumenting/exporters/

监控tomcat容器
基于第三方 exporter 实现对目的服务的监控
github项目地址:https://github.com/nlighten/tomcat_exporter
所需要的Jar包获取

选择对应版本采集服务程序包,点击下载按钮,下载则是最新版本

如果想下载以往版本解决兼容某些tomcat问题,则点击版本后进入详细版本页面进行下载
根据测试,simpleclient程序包使用0.12.0开始以后版本不对8.5.x 的tomcat兼容,无法显示metrics页面,但tomcat-exporter程序包可以使用最新版本

Jar监控程序包列表:
simpleclient-0.8.0.jar
simpleclient_common-0.8.0.jar
simpleclient_hotspot-0.8.0.jar
simpleclient_servlet-0.8.0.jar
tomcat_exporter_client-0.0.17.jar
tomcat_exporter_servlet-0.0.17.war
并将tomcat_exporter_servlet-0.0.17.war修改为metrics进行tomcat页面发布
# TYPE tomcat_connections_active_total gauge
tomcat_connections_active_total{name="http-nio-8080",} 2.0
# TYPE jvm_memory_bytes_used gauge
jvm_memory_bytes_used{area="heap",} 2.4451216E7
制作tomcat镜像,将包含metrics监控指标的jar包导入tomcat镜像内
root@deploy:~/dockerfile# cat Dockerfile
FROM harbor.cncf.net/web/tomcat:8.5.43

MAINTAINER LXH

LABEL Description="tomcat-8.5.43-app1"


ADD metrics.war /usr/local/tomcat/webapps/

ADD simpleclient-0.8.0.jar /usr/local/tomcat/lib

ADD simpleclient_common-0.8.0.jar /usr/local/tomcat/lib

ADD simpleclient_hotspot-0.8.0.jar /usr/local/tomcat/lib

ADD simpleclient_servlet-0.8.0.jar /usr/local/tomcat/lib

ADD tomcat_exporter_client-0.0.17.jar /usr/local/tomcat/lib


EXPOSE 8080 8443
容器镜像构建脚本
root@deploy:~/dockerfile# cat build.sh
#!/bin/bash
version=$1
docker build -t tomcatapp:${version} ./
docker tag tomcatapp:${version} harbor.cncf.net/web/tomcatapp:${version}
docker push harbor.cncf.net/web/tomcatapp:${version}
编写tomcat k8s yaml文件
k8s部署监控相关的组件的时候需要初始化很多linux的内核参数。 但是文件系统挂载到pod容器中就会变成read-only,难以进行操作实现需求。所以需要给POD privileged权限,然后在容器的初始化脚本或代码中去修改sysctl参数。给容器的spec指定`securityContext.privileged=true`参数
prometheus-server如果使用k8s内部部署并配置服务发现,则需要添加prometheus的scrape注解`annotations.prometheus.io/scrape='true'`
root@master1:~/yaml/tomcat-exporter# cat tomcat-deploy.yaml
apiVersion: apps/v1
kind: Deployment
metadata:
  name: tomcat-deployment
  namespace: default
spec:
  selector:
    matchLabels:
     app: tomcat
  replicas: 1
  template:
    metadata:
      labels:
        app: tomcat
      annotations:
        prometheus.io/scrape: 'true'     #添加prometheus服务发现的抓取注解
    spec:
      containers:
      - name: tomcat
        image: harbor.cncf.net/web/tomcatapp:1.0
        imagePullPolicy: Always
        ports:
        - containerPort: 8080
        securityContext:
          privileged: true             #给POD privileged权限
部署tomcat server,如果svc也想被prometheus-server服务发现采集,也许要添加prometheus-server服务注解
root@master1:~/yaml/tomcat-exporter# cat tomcat-svc.yaml
kind: Service
apiVersion: v1
metadata:
  annotations:
    prometheus.io/scrape: 'true'   #添加prometheus服务发现的抓取注解
  name: tomcat-service
spec:
  selector:
    app: tomcat
  ports:
  - nodePort: 31080
    port: 80
    protocol: TCP
    targetPort: 8080
  type: NodePort
root@master1:~/yaml/tomcat-exporter# kubectl get pods -n default
NAME                                READY   STATUS    RESTARTS   AGE
tomcat-deployment-b8c8457cf-fgztx   1/1     Running   0          14s
root@master1:~/yaml/tomcat-exporter# kubectl get svc -n default
NAME         TYPE        CLUSTER-IP   EXTERNAL-IP   PORT(S)   AGE
kubernetes   ClusterIP   10.100.0.1   <none>        443/TCP   17d
访问tomcat页面和指标


配置prometheus-server配置文件,添加tomcat-exporter
root@prometheus:/usr/local/prometheus# vim prometheus.yml
- job_name: "tomcat"
    static_configs:
      - targets: ["192.168.100.3:31080"]

root@prometheus:/usr/local/prometheus# systemctl restart prometheus

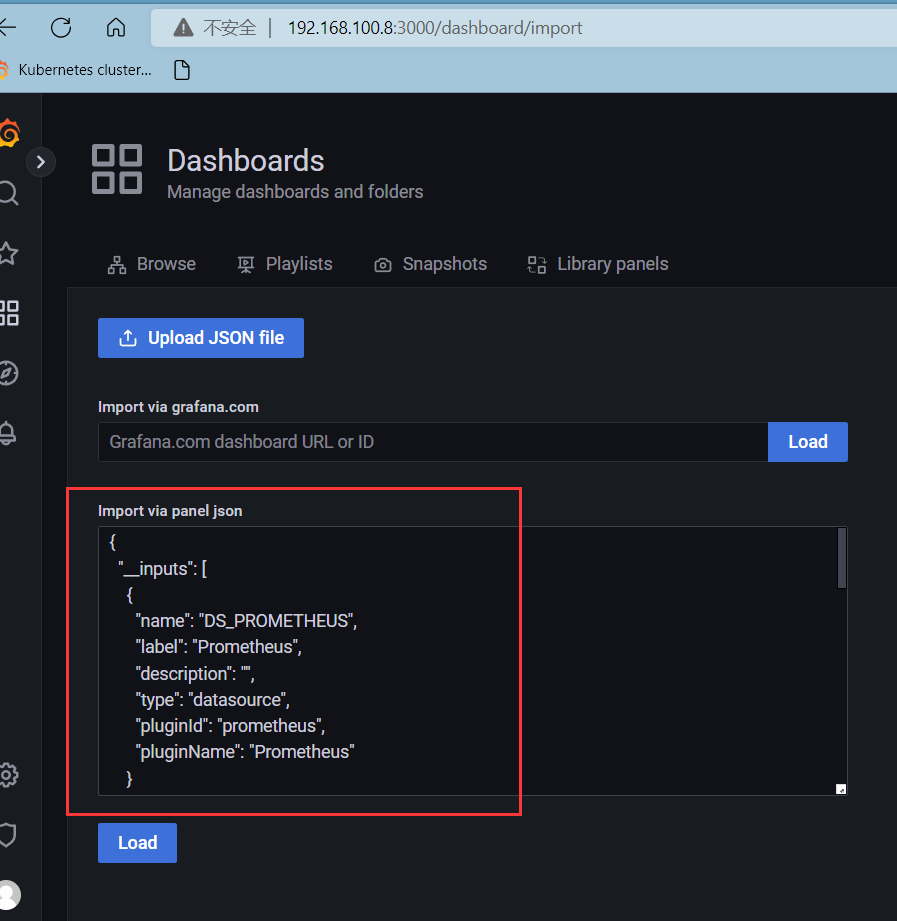
部署导入grafana官方模板
https://github.com/nlighten/tomcat_exporter/tree/master/dashboard


复制example.json导入grafana

监控redis
通过 redis_exporter 监控 redis 服务状态。
prometheus官网 https://prometheus.io/docs/instrumenting/exporters/ ,找到redis_exporter
redis_exporter的GIthub项目地址 https://github.com/oliver006/redis_exporter
下载redis-exporter
https://github.com/oliver006/redis_exporter/releases
[root@redis1 local]# tar xf redis_exporter-v1.43.1.linux-amd64.tar.gz
redis-exporter会默认监听本机localhost:6379端口,来返回指标数据/metrics。启动默认监听9121端口
命令帮助信息
root@redis1 redis_exporter]# ./redis_exporter --help
Usage of ./redis_exporter:
  -check-key-groups string
    	Comma separated list of lua regex for grouping keys
  -check-keys string
    	Comma separated list of key-patterns to export value and length/size, searched for with SCAN
  -check-keys-batch-size int
    	Approximate number of keys to process in each execution, larger value speeds up scanning.
    	WARNING: Still Redis is a single-threaded app, huge COUNT can affect production environment. (default 1000)
  -check-single-keys string
    	Comma separated list of single keys to export value and length/size
  -check-single-streams string
    	Comma separated list of single streams to export info about streams, groups and consumers
  -check-streams string
    	Comma separated list of stream-patterns to export info about streams, groups and consumers, searched for with SCAN
  -config-command string
    	What to use for the CONFIG command (default "CONFIG")
  -connection-timeout string
    	Timeout for connection to Redis instance (default "15s")
  -count-keys string
    	Comma separated list of patterns to count (eg: 'db0=production_*,db3=sessions:*'), searched for with SCAN
  -debug
    	Output verbose debug information
  -export-client-list
    	Whether to scrape Client List specific metrics
  -export-client-port
    	Whether to include the client's port when exporting the client list. Warning: including the port increases the number of metrics generated and will make your Prometheus server take up more memory
  -include-config-metrics
    	Whether to include all config settings as metrics
  -include-system-metrics
    	Whether to include system metrics like e.g. redis_total_system_memory_bytes
  -is-cluster
    	Whether this is a redis cluster (Enable this if you need to fetch key level data on a Redis Cluster).
  -is-tile38
    	Whether to scrape Tile38 specific metrics
  -log-format string
    	Log format, valid options are txt and json (default "txt")
  -max-distinct-key-groups int
    	The maximum number of distinct key groups with the most memory utilization to present as distinct metrics per database, the leftover key groups will be aggregated in the 'overflow' bucket (default 100)
  -namespace string
    	Namespace for metrics (default "redis")
  -ping-on-connect
    	Whether to ping the redis instance after connecting
  -redact-config-metrics
    	Whether to redact config settings that include potentially sensitive information like passwords (default true)
  -redis-only-metrics
    	Whether to also export go runtime metrics
  -redis.addr string
    	Address of the Redis instance to scrape (default "redis://localhost:6379")
  -redis.password string
    	Password of the Redis instance to scrape
  -redis.password-file string
    	Password file of the Redis instance to scrape
  -redis.user string
    	User name to use for authentication (Redis ACL for Redis 6.0 and newer)
  -script string
    	Path to Lua Redis script for collecting extra metrics
  -set-client-name
    	Whether to set client name to redis_exporter (default true)
  -skip-tls-verification
    	Whether to to skip TLS verification
  -tls-ca-cert-file string
    	Name of the CA certificate file (including full path) if the server requires TLS client authentication
  -tls-client-cert-file string
    	Name of the client certificate file (including full path) if the server requires TLS client authentication
  -tls-client-key-file string
    	Name of the client key file (including full path) if the server requires TLS client authentication
  -tls-server-ca-cert-file string
    	Name of the CA certificate file (including full path) if the web interface and telemetry should require TLS client authentication
  -tls-server-cert-file string
    	Name of the server certificate file (including full path) if the web interface and telemetry should use TLS
  -tls-server-key-file string
    	Name of the server key file (including full path) if the web interface and telemetry should use TLS
  -tls-server-min-version string
    	Minimum TLS version that is acceptable by the web interface and telemetry when using TLS (default "TLS1.2")
  -version
    	Show version information and exit
  -web.listen-address string
    	Address to listen on for web interface and telemetry. (default ":9121")
  -web.telemetry-path string
    	Path under which to expose metrics. (default "/metrics")
常用选项:
-redis.addr: 连接redis地址:端口
-redis.password: 连接redis的密码
-web.listen-address: 指定redis_exporter的服务端口,格式为-web.listen-address ":9121
启动脚本
使redis_exporter监听在自定义端口9333,默认端口监听为9121
[root@redis1 redis_exporter]# cat start.sh
#!/bin/bash
cmd=/usr/local/redis_exporter
ip=192.168.100.104   #reidis地址
password=123456      #redis密码
nohup $cmd/redis_exporter -redis.addr $ip:6379 -redis.password $password -web.listen-address ":9333"  > /dev/null 2>&1 &
[ $? -eq 0 ] &&  echo "start success!" || echo "start failed"
root@redis1 redis_exporter]# cat stop.sh
#!/bin/bash
PID=$(ps -ef|grep redis_exporter|grep -v grep|awk '{print $2}')

if [ -z ${PID} ];then
  echo "redis_expoter isn't running"
else
  kill $PID
  sleep 2s
  [ ! -z ${PID} ]
  echo "redis_expoter is stopped"
fi
监控redis单实例
编辑启动脚本后,运行启动脚本
[root@redis1 redis_exporter]# cat start.sh
#!/bin/bash
cmd=/usr/local/redis_exporter
ip=192.168.100.104   #reidis地址
password=123456      #redis密码
nohup $cmd/redis_exporter -redis.addr $ip:6379 -redis.password $password -web.listen-address ":9333"  > /dev/null 2>&1 &
[ $? -eq 0 ] &&  echo "start success!" || echo "start failed"

[root@redis1 redis_exporter]# ./start.sh
start success!

prometheus-server配置
scrape_configs:
  - job_name: redis_exporter
    static_configs:
    - targets: ['192.168.100.104:9333']
监控redis多实例集群
查看集群信息
分别为192.168.100.104上的6379-6384端口的6个redis为集群

官网示例:
https://github.com/oliver006/redis_exporter
Using below config instead of the /metric endpoint the /scrape endpoint will be used by prometheus. As an example the first target will be queried with this web request:
http://exporterhost:9121/scrape?target=first-redis-host:6379
解释
1、创建一个名称为redis_exporter_targets job,来获取每个redis节点的实例。
将采集redis_expoter Http URI修改为/scrape,原因是默认prometheus会收集目标target的/metrics URI,所以需要在prometheus-server配置文件中指定metrics_path 的路径,并进行redis_exporter的标签重写,将\__address\__ 标签内容为`redis实例ip:6379、6380、6381`节点实例,替换为替换为instance标签,并将value修改为`redis_exporter http`的访问地址。最终prometheus-server就能获得每个redis的target:`http://exporterhost:9121/scrape?target=first-redis-host:6379`
2、还需要单独添加一个名称为redis_exporter job来抓取redis_exporter的地址
scrape_configs:
  ## config for the multiple Redis targets that the exporter will scrape
  - job_name: 'redis_exporter_targets'
    static_configs:
      - targets:
        - redis://first-redis-host:6379
        - redis://second-redis-host:6379
        - redis://second-redis-host:6380
        - redis://second-redis-host:6381
    metrics_path: /scrape
    relabel_configs:
      - source_labels: [__address__]
        target_label: __param_target
      - source_labels: [__param_target]
        target_label: instance
      - target_label: __address__
        replacement: <<REDIS-EXPORTER-HOSTNAME>>:9121

  ## config for scraping the exporter itself
  - job_name: 'redis_exporter'
    static_configs:
      - targets:
        - <<REDIS-EXPORTER-HOSTNAME>>:9121
redis_expoter配置
redis_expoter只要能连接到一个集群的一个节点,因此只需要配置连接集群中一个redis节点就能查询其他节点的指标
[root@redis1 redis_exporter]\# cat start.sh
#!/bin/bash
cmd=/usr/local/redis_exporter
ip=192.168.100.104
password=123456
nohup $cmd/redis_exporter -redis.addr $ip:6379 -redis.password $password -web.listen-address ":9333"  > /dev/null 2>&1 &
[ $? -eq 0 ] &&  echo "start success!" || echo "start failed"
prometheus-server配置
root@prometheus:~\# cat /usr/local/prometheus/prometheus.yml
# my global config
global:
  scrape_interval: 15s # Set the scrape interval to every 15 seconds. Default is every 1 minute.
  evaluation_interval: 15s # Evaluate rules every 15 seconds. The default is every 1 minute.
  # scrape_timeout is set to the global default (10s).

alerting:
  alertmanagers:
    - static_configs:
        - targets:
          # - alertmanager:9093

rule_files:
  # - "first_rules.yml"
  # - "second_rules.yml"

scrape_configs:

  - job_name: 'redis_exporter_targets'
    static_configs:
      - targets:
        - redis://192.168.100.104:6379
        - redis://192.168.100.104:6380
        - redis://192.168.100.104:6381
        - redis://192.168.100.104:6382
        - redis://192.168.100.104:6383
        - redis://192.168.100.104:6384
    metrics_path: /scrape
    relabel_configs:
      - source_labels: [__address__]
        target_label: __param_target
      - source_labels: [__param_target]
        target_label: instance
      - target_label: __address__
        replacement: 192.168.100.104:9333
  ## config for scraping the exporter itself
  - job_name: 'redis_exporter'
    static_configs:
      - targets:
        - 192.168.100.104:9333

将标签重写后,URI修改为/scripe?target=redis节点:6379

配置grafana导入redis-exporter模板
ID:11835

监控 k8s redis集群
这里每个redis节点使用statefulset部署,并暴露集群端口供redis_exporter使用。redis_expoter单独使用deployment部署
部署redis集群参考kubernetes 案例redis集群配置
验证redis集群
查看redis集群pod

查看集群状态

redis_exporter镜像构建
root@deploy:~/dockerfile/redis-exporter\# cat Dockerfile
FROM harbor.cncf.net/os/ubuntu:20.04

ADD redis_exporter.tar.gz /usr/local/

ENTRYPOINT ["/usr/local/redis_exporter/start.sh"]
root@deploy:~/dockerfile/redis-exporter\# ll redis_exporter/
total 8892
drwxr-xr-x 2 root root      91 Sep 24 03:29 ./
drwxr-xr-x 3 root root      91 Sep 24 03:30 ../
-rw-r--r-- 1 root root    1063 Sep 24 03:10 LICENSE
-rw-r--r-- 1 root root   43382 Sep 24 03:10 README.md
-rwxr-xr-x 1 root root 9048064 Sep 24 03:10 redis_exporter*
-rwx------ 1 root root     202 Sep 24 03:29 start.sh*
-rwx------ 1 root root     224 Sep 24 03:10 stop.sh*
准备redis_exporter启动脚本
redis的ip地址修改为k8s中redis集群中的master节点的pod服务名称,redis-0.redis.redis-test.svc.cluster.local
root@deploy:~/dockerfile/redis-exporter\# cat redis_exporter/start.sh
#!/bin/bash
cmd=/usr/local/redis_exporter
ip="redis-0.redis.redis-test.svc.cluster.local"
password=123456
$cmd/redis_exporter -redis.addr $ip:6379 -redis.password $password -web.listen-address ":9121"
准备镜像构建脚本
root@deploy:~/dockerfile/redis-exporter\# cat build.sh
#!/bin/bash
version=$1
docker build -t harbor.cncf.net/project/redis_exporter:$version ./
docker push harbor.cncf.net/project/redis_exporter:$version
部署redis_exporter
创建deployment,与redis集群在同一个ns下
root@master1:~/yaml/redis-exporter# cat redis-exporter.yaml
apiVersion: apps/v1
kind: Deployment
metadata:
  name: redis-exporter
  namespace: redis-test
spec:
  replicas: 1
  selector:
    matchLabels:
      app: redis-exporter
  template:
    metadata:
      labels:
        app: redis-exporter
    spec:
      containers:
      - name: redis-exporter
        image: harbor.cncf.net/project/redis_exporter:1.7
        imagePullPolicy: Always
        resources:
          requests:
            cpu: 100m
            memory: 100Mi
        ports:
        - containerPort: 9121
创建svc
root@master1:~/yaml/redis-exporter# cat redis-exporter-svc.yaml
kind: Service  #service 类型
apiVersion: v1
metadata:
  name: redis-redis-service
  namespace: redis-test
spec:
  selector:
    app: redis-exporter
  ports:
  - nodePort: 39121
    name: redis-exporter
    port: 9121
    protocol: TCP
    targetPort: 9121
  type: NodePort
验证部署
root@master1:~/yaml\# kubectl get svc -n redis-test redis-redis-service
NAME                  TYPE       CLUSTER-IP       EXTERNAL-IP   PORT(S)          AGE
redis-redis-service   NodePort   10.100.135.230   <none>        9121:39121/TCP   99m

root@master1:~/yaml\# kubectl get pods -n redis-test
NAME                             READY   STATUS    RESTARTS   AGE
redis-0                          1/1     Running   0          134m
redis-1                          1/1     Running   0          142m
redis-2                          1/1     Running   0          142m
redis-3                          1/1     Running   0          142m
redis-4                          1/1     Running   0          142m
redis-5                          1/1     Running   0          126m
redis-exporter-bf6bf8576-k9p4x   1/1     Running   0          101m
验证查看redis_exporter web界面

配置k8s中的prometheus-server,添加redis-exporter服务发现
target为redis-exporter的svc名称
    - job_name: 'redis_exporter'
      static_configs:
        - targets:
          - redis-redis-service.redis-test:9121
配置后重新应用promentheus configmap并删除prometheus-server pod重启
root@master1:~/yaml\# kubectl apply -f prometheus-cfg.yaml
configmap/prometheus-config configured
root@master1:~/yaml\# kubectl delete -f prometheus-deployment.yaml
deployment.apps "prometheus-server" deleted
root@master1:~/yaml\# kubectl apply -f prometheus-deployment.yaml
查看prometheus target界面验证target

查看grafana导入dashboard

监控mysql
通过 mysqld_exporter 监控 MySQL 服务的运行状态
官方exporter:
prometheus官网: https://prometheus.io/docs/instrumenting/exporters/,找到mysql_exporer
Github项目地址:https://github.com/prometheus/mysqld_exporter

监控mysql单示例
1、确保监控的mysql实例正常运行,添加授权监控账号权限。
已经安装mysql服务,端口监听在3307
CREATE USER 'exporter'@'localhost' IDENTIFIED BY '123456' WITH MAX_USER_CONNECTIONS 3;
GRANT PROCESS, REPLICATION CLIENT, SELECT ON *.* TO 'exporter'@'localhost';
测试账号权限
root@mysql1:~\# mysql -u exporter -p
#输入密码
mysql> select user();
+--------------------+
| user()             |
+--------------------+
| exporter@localhost |
+--------------------+
1 row in set (0.00 sec)
下载地址:https://github.com/prometheus/mysqld_exporter/releases

解压安装
root@mysql1:/usr/local\# tar xf mysqld_exporter-0.14.0.linux-amd64.tar.gz
root@mysql1:/usr/local\# ln -s mysqld_exporter-0.14.0.linux-amd64 mysql_exporter
root@mysql1:~\# vim /root/.my.cnf
[client]
host=localhost
port=3307
user = exporter
password = 123456
测试权限,直接本地执行mysql命令登录mysql
root@mysql1:~\# mysql
Welcome to the MySQL monitor.  Commands end with ; or \g.
Your MySQL connection id is 5
Server version: 5.7.36 MySQL Community Server (GPL)

Copyright (c) 2000, 2021, Oracle and/or its affiliates.

Oracle is a registered trademark of Oracle Corporation and/or its
affiliates. Other names may be trademarks of their respective
owners.

Type 'help;' or '\h' for help. Type '\c' to clear the current input statement.

mysql>
3、创建mysql_exporter服务启动文件
设置端口监听在本机出口网卡的ip:9105,并指定mysql的客户端配置文件。默认端口为9104
root@mysql1:~\# vim /etc/systemd/system/mysqld_exporter.service
[Unit]
Description=Prometheus Node Exporter
After=network.target

[Service]
ExecStart=/usr/local/bin/mysqld_exporter --config.my-cnf=/root/.my.cnf --web.listen-address=192.168.0.29:9105

[Install]
WantedBy=multi-user.target
mysqld_exporter的主要参数介绍
| Name | Description |
|---|---|
| mysqld.address | Hostname and port used for connecting to MySQL server, format: host:port. (default: locahost:3306) |
| mysqld.username | Username to be used for connecting to MySQL Server |
| config.my-cnf | Path to .my.cnf file to read MySQL credentials from. (default: ~/.my.cnf) |
| log.level | Logging verbosity (default: info) |
| exporter.lock_wait_timeout | Set a lock_wait_timeout (in seconds) on the connection to avoid long metadata locking. (default: 2) |
| exporter.log_slow_filter | Add a log_slow_filter to avoid slow query logging of scrapes. NOTE: Not supported by Oracle MySQL. |
| tls.insecure-skip-verify | Ignore tls verification errors. |
| web.config.file | Path to a |
| web.listen-address | Address to listen on for web interface and telemetry. |
| web.telemetry-path | Path under which to expose metrics. |
| version | Print the version information. |
命令帮助信息
root@mysql1:/usr/local\# mysqld_exporter --help
usage: mysqld_exporter [<flags>]

Flags:
  -h, --help                   Show context-sensitive help (also try --help-long and --help-man).
      --exporter.lock_wait_timeout=2
                               Set a lock_wait_timeout (in seconds) on the connection to avoid long metadata locking.
      --exporter.log_slow_filter
                               Add a log_slow_filter to avoid slow query logging of scrapes. NOTE: Not supported by
                               Oracle MySQL.
      --collect.heartbeat.database="heartbeat"
                               Database from where to collect heartbeat data
      --collect.heartbeat.table="heartbeat"
                               Table from where to collect heartbeat data
      --collect.heartbeat.utc  Use UTC for timestamps of the current server (`pt-heartbeat` is called with `--utc`)
      --collect.info_schema.processlist.min_time=0
                               Minimum time a thread must be in each state to be counted
      --collect.info_schema.processlist.processes_by_user
                               Enable collecting the number of processes by user
      --collect.info_schema.processlist.processes_by_host
                               Enable collecting the number of processes by host
      --collect.info_schema.tables.databases="*"
                               The list of databases to collect table stats for, or '*' for all
      --collect.mysql.user.privileges
                               Enable collecting user privileges from mysql.user
      --collect.perf_schema.eventsstatements.limit=250
                               Limit the number of events statements digests by response time
      --collect.perf_schema.eventsstatements.timelimit=86400
                               Limit how old the 'last_seen' events statements can be, in seconds
      --collect.perf_schema.eventsstatements.digest_text_limit=120
                               Maximum length of the normalized statement text
      --collect.perf_schema.file_instances.filter=".*"
                               RegEx file_name filter for performance_schema.file_summary_by_instance
      --collect.perf_schema.file_instances.remove_prefix="/var/lib/mysql/"
                               Remove path prefix in performance_schema.file_summary_by_instance
      --collect.perf_schema.memory_events.remove_prefix="memory/"
                               Remove instrument prefix in performance_schema.memory_summary_global_by_event_name
      --web.config.file=""     [EXPERIMENTAL] Path to configuration file that can enable TLS or authentication.
      --web.listen-address=":9104"
                               Address to listen on for web interface and telemetry.
      --web.telemetry-path="/metrics"
                               Path under which to expose metrics.
      --timeout-offset=0.25    Offset to subtract from timeout in seconds.
      --config.my-cnf="/root/.my.cnf"
                               Path to .my.cnf file to read MySQL credentials from.
      --tls.insecure-skip-verify
                               Ignore certificate and server verification when using a tls connection.
      --collect.mysql.user     Collect data from mysql.user
      --collect.info_schema.tables
                               Collect metrics from information_schema.tables
      --collect.info_schema.innodb_tablespaces
                               Collect metrics from information_schema.innodb_sys_tablespaces
      --collect.info_schema.innodb_metrics
                               Collect metrics from information_schema.innodb_metrics
      --collect.global_status  Collect from SHOW GLOBAL STATUS
      --collect.global_variables
                               Collect from SHOW GLOBAL VARIABLES
      --collect.slave_status   Collect from SHOW SLAVE STATUS
      --collect.info_schema.processlist
                               Collect current thread state counts from the information_schema.processlist
      --collect.perf_schema.tablelocks
                               Collect metrics from performance_schema.table_lock_waits_summary_by_table
      --collect.perf_schema.eventsstatements
                               Collect metrics from performance_schema.events_statements_summary_by_digest
      --collect.perf_schema.eventsstatementssum
                               Collect metrics of grand sums from
                               performance_schema.events_statements_summary_by_digest
      --collect.perf_schema.eventswaits
                               Collect metrics from performance_schema.events_waits_summary_global_by_event_name
      --collect.auto_increment.columns
                               Collect auto_increment columns and max values from information_schema
      --collect.binlog_size    Collect the current size of all registered binlog files
      --collect.perf_schema.tableiowaits
                               Collect metrics from performance_schema.table_io_waits_summary_by_table
      --collect.perf_schema.indexiowaits
                               Collect metrics from performance_schema.table_io_waits_summary_by_index_usage
      --collect.perf_schema.replication_group_member_stats
                               Collect metrics from performance_schema.replication_group_member_stats
      --collect.perf_schema.replication_applier_status_by_worker
                               Collect metrics from performance_schema.replication_applier_status_by_worker
      --collect.info_schema.userstats
                               If running with userstat=1, set to true to collect user statistics
      --collect.info_schema.clientstats
                               If running with userstat=1, set to true to collect client statistics
      --collect.perf_schema.file_events
                               Collect metrics from performance_schema.file_summary_by_event_name
      --collect.perf_schema.file_instances
                               Collect metrics from performance_schema.file_summary_by_instance
      --collect.perf_schema.memory_events
                               Collect metrics from performance_schema.memory_summary_global_by_event_name
      --collect.perf_schema.replication_group_members
                               Collect metrics from performance_schema.replication_group_members
      --collect.info_schema.query_response_time
                               Collect query response time distribution if query_response_time_stats is ON.
      --collect.engine_tokudb_status
                               Collect from SHOW ENGINE TOKUDB STATUS
      --collect.engine_innodb_status
                               Collect from SHOW ENGINE INNODB STATUS
      --collect.heartbeat      Collect from heartbeat
      --collect.info_schema.tablestats
                               If running with userstat=1, set to true to collect table statistics
      --collect.info_schema.schemastats
                               If running with userstat=1, set to true to collect schema statistics
      --collect.info_schema.innodb_cmp
                               Collect metrics from information_schema.innodb_cmp
      --collect.info_schema.innodb_cmpmem
                               Collect metrics from information_schema.innodb_cmpmem
      --collect.slave_hosts    Scrape information from 'SHOW SLAVE HOSTS'
      --collect.info_schema.replica_host
                               Collect metrics from information_schema.replica_host_status
      --log.level=info         Only log messages with the given severity or above. One of: [debug, info, warn, error]
      --log.format=logfmt      Output format of log messages. One of: [logfmt, json]
      --version                Show application version.
systemctl daemon-reload && systemctl enable mysqld_exporter && systemctl start mysqld_exporter

访问URI /metrics

4、配置prometheus-server配置文件,添加mysqld_exporter服务采集
scrape_configs:
- job_name: "mysqld_exporter"
    static_configs:
      - targets: ["192.168.0.29:9105"]
浏览器访问prometheus-server/targets验证

5、配置grafana添加myqld_exporter的dashboard
ID-13106、ID-11323

监控Haproxy
通过 haproxy_exporter 监控 haproxy
prometheus官网:https://prometheus.io/docs/instrumenting/exporters/,找到haproxy_exporer
Github项目地址:https://github.com/prometheus/haproxy_exporter
haproxy_exporter的监控方式
1、通过haproxy 的状态页URL进行监控
Github示例:

2、通过haproxy socket文件进行监控
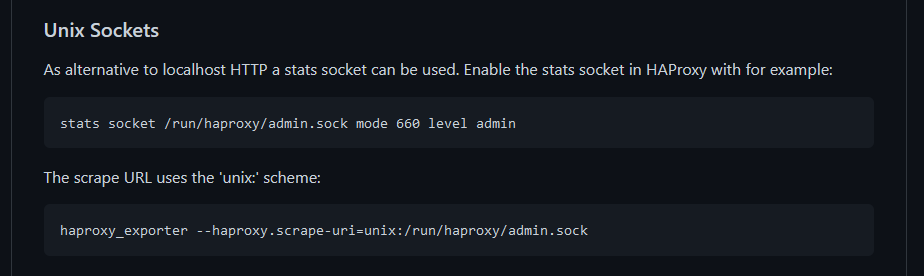
配置haproxy 添加状态页与添加socket文件
global
	stats socket /run/haproxy/admin.sock mode 660 level admin expose-fd listeners

listen statistics
	#自定义监听端口
	bind *:8009
	#启用基于程序编译时默认设置的统计报告
	stats enable
	#统计页面用户名和密码设置
	stats auth admin:admin
	#自定义统计页面的URL,默认为/haproxy?stats
	stats uri /admin?stats
	#隐藏统计页面上HAProxy的版本信息
	stats hide-version
	#统计页面自动刷新时间
	stats refresh 30s
	#如果认证通过就做管理功能,可以管理后端的服务器
	stats admin if TRUE
	#统计页面密码框上提示文本,默认为Haproxy\ Statistics
	stats realm Hapadmin
浏览器访问验证:
haproxy 状态页URI:/admin?stats

验证haproxy服务器本地socket文件
root@haproxyA:~\# ll /run/haproxy/admin.sock
srw-rw---- 1 root haproxy 0 Sep 26 08:44 /run/haproxy/admin.sock=
部署 haproxy_exporter
Github下载页面:
https://github.com/prometheus/haproxy_exporter/releases

解压部署
root@haproxyA:/usr/local\# tar xf haproxy_exporter-0.13.0.linux-amd64.tar.gz
root@haproxyA:/usr/local\# cd haproxy_exporter-0.13.0.linux-amd64/
root@haproxyA:/usr/local/haproxy_exporter-0.13.0.linux-amd64\# cp haproxy_exporter /usr/local/bin/
root@haproxyA:~\# haproxy_exporter --help
usage: haproxy_exporter [<flags>]

Flags:
  -h, --help                 Show context-sensitive help (also try --help-long and --help-man).
      --web.config.file=""   [EXPERIMENTAL] Path to configuration file that can enable TLS or authentication.
      --web.listen-address=":9101"
                             Address to listen on for web interface and telemetry.
      --web.telemetry-path="/metrics"
                             Path under which to expose metrics.
      --haproxy.scrape-uri="http://localhost/;csv"
                             URI on which to scrape HAProxy.
      --haproxy.ssl-verify   Flag that enables SSL certificate verification for the scrape URI
      --haproxy.server-metric-fields="2,3,4,5,6,7,8,9,13,14,15,16,17,18,21,24,30,33,35,38,39,40,41,42,43,44,49,50,58,59,60,61"
                             Comma-separated list of exported server metrics. See http://cbonte.github.io/haproxy-dconv/configuration-1.5.html#9.1
      --haproxy.server-exclude-states=""
                             Comma-separated list of exported server states to exclude. See https://cbonte.github.io/haproxy-dconv/1.8/management.html#9.1,
                             field 17 statuus
      --haproxy.timeout=5s   Timeout for trying to get stats from HAProxy.
      --haproxy.pid-file=""  Path to HAProxy pid file.

                               If provided, the standard process metrics get exported for the HAProxy
                               process, prefixed with 'haproxy_process_...'. The haproxy_process exporter
                               needs to have read access to files owned by the HAProxy process. Depends on
                               the availability of /proc.

                               https://prometheus.io/docs/instrumenting/writing_clientlibs/#process-metrics.
      --log.level=info       Only log messages with the given severity or above. One of: [debug, info, warn, error]
      --log.format=logfmt    Output format of log messages. One of: [logfmt, json]
      --version              Show application version.
haproxy_exporter两种监听的启动方式:
默认监听9101端口
1、--haproxy.scrape-uri=unix:/socket_dir,指定haproxy的socket文件监控
haproxy_exporter --haproxy.scrape-uri=unix:/run/haproxy/admin.sock
2、--haproxy.scrape-uri="http://”,指定haproxy的状态页地址
haproxy_exporter --haproxy.scrape-uri="http://admin:admin@127.0.0.1:8009/admin?stats;csv" &
创建haproxy_exporter service启动文件
root@mysql1:~\# vim /etc/systemd/system/haproxy_exporter.service
[Unit]
Description=Prometheus HAproxy Exporter
After=network.target

[Service]
ExecStart=/usr/local/bin/haproxy_exporter --haproxy.scrape-uri=unix:/run/haproxy/admin.sock

[Install]
WantedBy=multi-user.target
浏览器访问验证

prometheus-server配置haproxy_监控
  - job_name: "haproxy_exporter"
    static_configs:
      - targets: ["192.168.100.20:9101"]
prometheus-server web验证

grafana导入模板并验证
ID-2428、ID-367


本文来自博客园,作者:PunchLinux,转载请注明原文链接:https://www.cnblogs.com/punchlinux/p/16856793.html

 浙公网安备 33010602011771号