node-exporter和cadvisor收集指标数据
收集node-exporter指标数据
修改prometheus-server配置文件,在scrape_configs配置项下,添加新job
root@prometheus:~\ vim /usr/local/prometheus/prometheus.yml
...
  - job_name: "k8s-nodes"
    static_configs:
      - targets: ["192.168.100.4:9100","192.168.100.5:9100"]  #添加node-exporter节点,逗号间隔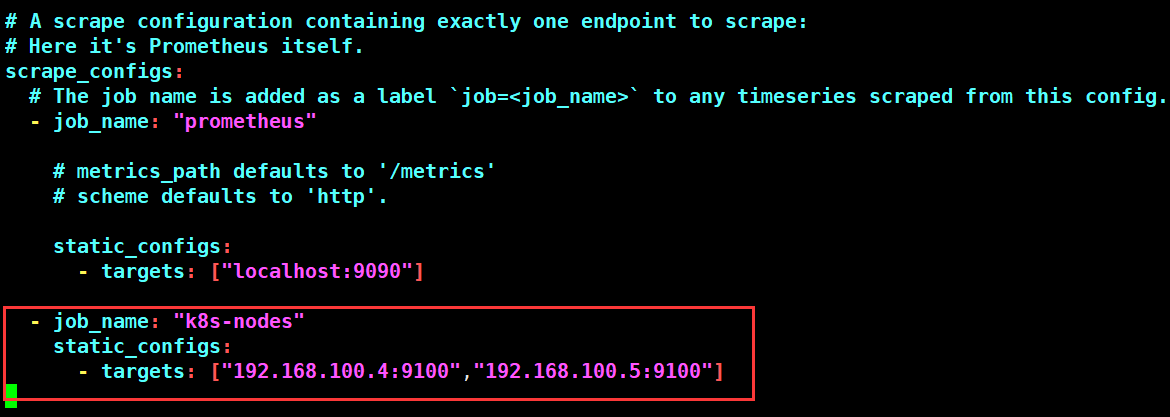
重新加载prometheus-server配置
root@prometheus:~\ curl -X POST http://192.168.100.7:9090/-/reload
访问验证

参考:https://knowledge.zhaoweiguo.com/build/html/cloudnative/prometheus/metrics/kubernetes-cadvisor.html
root@prometheus:~\ curl 192.168.100.4:9100/metrics
常见的指标:
node_boot_time:系统自启动以后的总计时间
node_cpu:系统CPU使用量
node_disk*:磁盘IO
node_filesystem*:系统文件系统用量
node_load1:系统CPU负载
node_memeory*:内存使用量
node_network*:网络带宽指标
node_time:当前系统时间
go_*:node exporter中go相关指标
process_*:node exporter自身进程相关运行指标
收集cadvisor指标数据
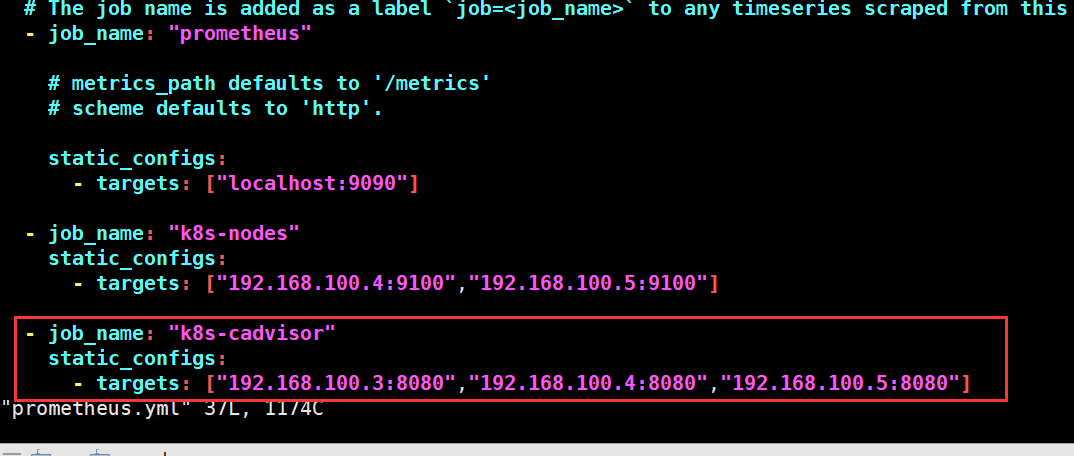
修改prometheus-server配置文件,在scrape_configs配置项下,添加新job
root@prometheus:~\# vim /usr/local/prometheus/prometheus.yml
...
  - job_name: "k8s-cadvisor"
    static_configs:
      - targets: ["192.168.100.3:8080","192.168.100.4:8080","192.168.100.5:8080"]   #添加容器节点的cadvisor服务地址
重新加载prometheus-server配置
root@prometheus:~\ curl -X POST http://192.168.100.7:9090/-/reload
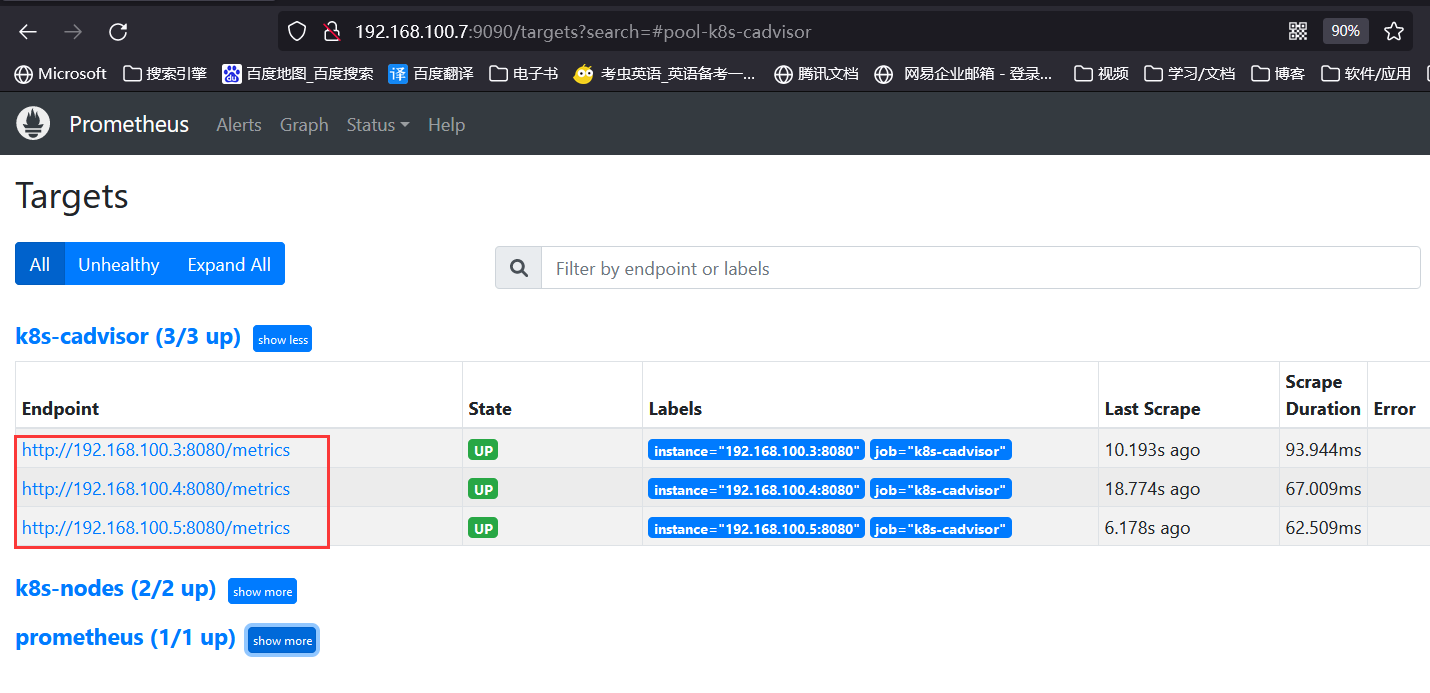
cadvisor指标数据
https://knowledge.zhaoweiguo.com/build/html/cloudnative/prometheus/metrics/kubernetes-cadvisor.html
| 指标名称 | 类型 | 含义 |
|---|---|---|
| container_cpu_load_average_10s | gauge | 过去10秒容器CPU的平均负载 |
| container_cpu_usage_seconds_total | counter | 容器在每个CPU内核上的累积占用时间(单位:秒) |
| container_cpu_system_seconds_total | counter | System CPU累积占用时间(单位:秒) |
| container_cpu_user_seconds_total | counter | User CPU累积占用时间(单位:秒) |
| container_fs_usage_bytes | gauge | 容器中文件系统的使用量(单位:字节) |
| container_fs_limit_bytes | gauge | 容器可以使用的文件系统总量(单位:字节) |
| container_fs_reads_bytes_total | counter | 容器累积读取数据的总量(单位:字节) |
| container_fs_writes_bytes_total | counter | 容器累积写入数据的总量(单位:字节) |
| container_memory_max_usage_bytes | gauge | 容器的最大内存使用量(单位:字节) |
| container_memory_usage_bytes | gauge | 容器当前的内存使用量(单位:字节) |
| container_spec_memory_limit_bytes | gauge | 容器的内存使用量限制 |
| machine_memory_bytes | gauge | 当前主机的内存总量 |
| container_network_receive_bytes_total | counter | 容器网络累积接收数据总量(单位:字节) |
| container_network_transmit_bytes_total | counter | 容器网络累积传输数据总量(单位:字节) |
当能够正常采集到cAdvisor的样本数据后,可以通过以下表达式计算容器的指标数据:
(1)容器CPU使用率
sum(irate(container_cpu_usage_seconds_total{image!=""}[1m])) without (cpu)
(2)查询容器内存使⽤量(单位:字节):
container_memory_usage_bytes{image!=""}
(3)查询容器网络接收量(速率)(单位:字节/秒):
sum(rate(container_network_receive_bytes_total{image!=""}[1m])) without (interface)
(4)容器网络传输量字节/秒
sum(rate(container_network_transmit_bytes_total{image!=""}[1m])) without (interface)
(5)容器⽂件系统读取速率字节/秒
sum(rate(container_fs_reads_bytes_total{image!=""}[1m])) without (device)
(6)容器文件系统写入速率字节/秒
sum(rate(container_fs_writes_bytes_total{image!=""}[1m])) without (device)
cadvisor 常用容器监控指标
(1)网络流量
容器网络接收的字节数(1分钟内),根据名称查询name=~".+"
sum(rate(container_network_receive_bytes_total{name=~".+"}[1m])) by (name)
容器网络传输的字节数(1分钟内),根据名称查询 name=~".+"
sum(rate(container_network_transmit_bytes_total{name=~".+"}[1m])) by (name)
(2)容器CPU相关
所用容器system cpu的累计使用时间(1min钟内)
sum(rate(container_cpu_system_seconds_total[1m]))每个容器system cpu的使用时间(1min钟内)
sum(irate(container_cpu_system_seconds_total{image!=""}[1m])) without (cpu)每个容器的cpu使用率
sum(rate(container_cpu_usage_seconds_total{name=~".+"}[1m])) by (name) * 100总容器的cpu使用率
sum(sum(rate(container_cpu_usage_seconds_total{name=~".+"}[1m])) by (name) * 100)
本文来自博客园,作者:PunchLinux,转载请注明原文链接:https://www.cnblogs.com/punchlinux/p/16759316.html

 浙公网安备 33010602011771号