监控软件篇——prometheus+exporter组件+grafana
环境
linux: centos7.6
- 公司里最常用的服务器系统
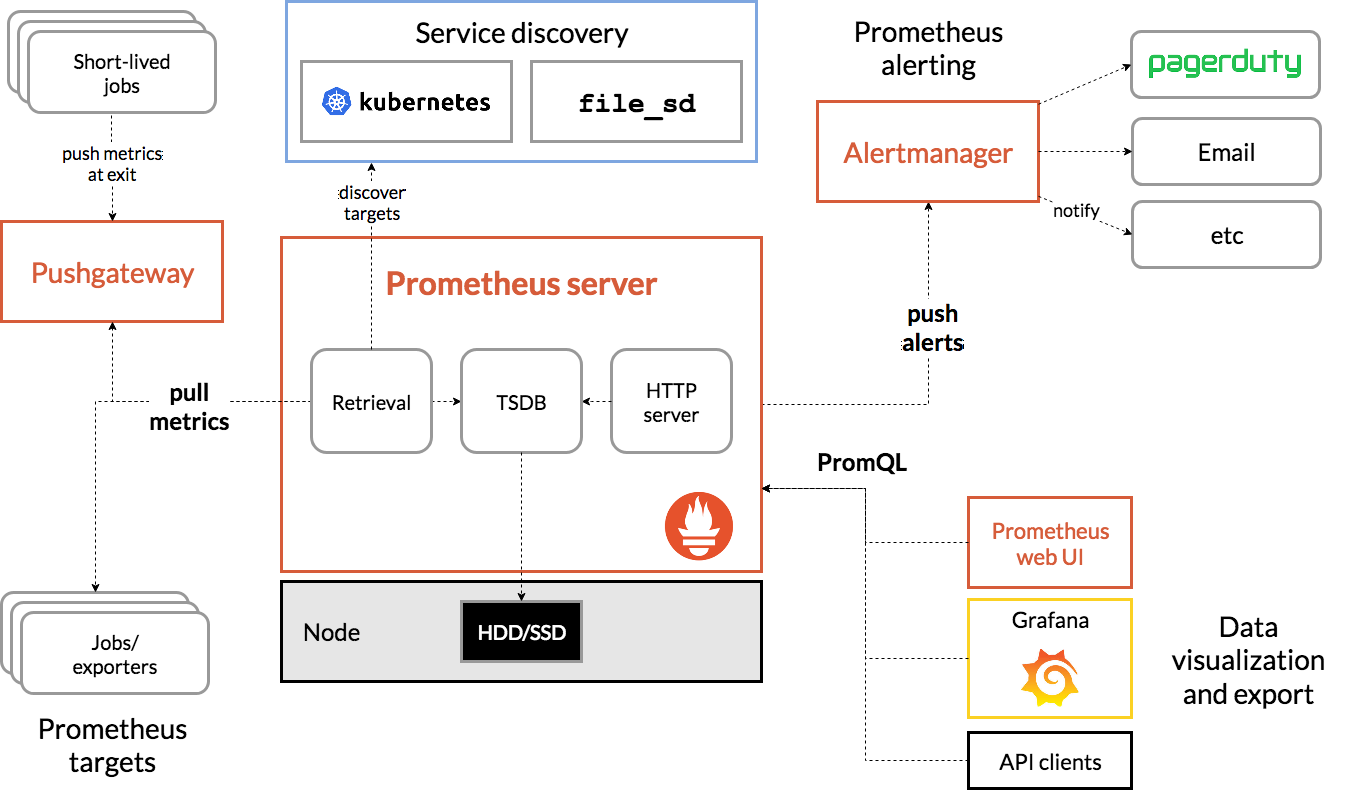
prometheus: 2.13.1.linux-amd64
- 基于时间序列的数值数据的容器监控解决方案: 自带了数据存储和监控,是k8s官方指定监控方案。
node_exporter: 0.18.1.linux-amd64
- 用于采集服务器层面的运行指标,然后转为prometheus能够识别的格式,然后建立监听等中央服务主动来抓取数据
process-exporter: 0.5.0.linux-amd64
- 主要用于监控服务进程的,也是将数据转为固定格式,等中央服务器主动来抓取
grafana: 6.4.3.linux-amd64 >>>官方文档https://grafana.com/docs/grafana/latest/
- 一个成熟完整的展示数据的工具,可以整个市场大部分的数据源
准备安装包
prometheus-2.13.1.linux-amd64.tar.gz
process-exporter-0.5.0.linux-amd64.tar.gz
node_exporter-0.18.1.linux-amd64.tar.gz
grafana-6.4.3.linux-amd64.tar.gz
- 本文安装均通过二进制包,解压后直接使用
安装prometheus
下载最新版本,并解压
下载地址:https://prometheus.io/download/
tar xvfz prometheus-*.tar.gz
cd prometheus-*
以下是基本的配置,完整文档介绍可以看 > 官方文档:https://prometheus.io/docs/prometheus/2.13/configuration/configuration/
# my global config
global:
scrape_interval:     15s # Set the scrape interval to every 15 seconds. Default is every 1 minute.
evaluation_interval: 15s # Evaluate rules every 15 seconds. The default is every 1 minute.
# scrape_timeout is set to the global default (10s).

# Alertmanager configuration
alerting:
alertmanagers:
- static_configs:
 - targets:
   # - alertmanager:9093

# Load rules once and periodically evaluate them according to the global 'evaluation_interval'.
rule_files:
# - "first_rules.yml"
# - "second_rules.yml"

# A scrape configuration containing exactly one endpoint to scrape:
# Here it's Prometheus itself.
scrape_configs:
# The job name is added as a label `job=<job_name>` to any timeseries scraped from this config.
- job_name: 'prometheus'

 # metrics_path defaults to '/metrics'
 # scheme defaults to 'http'.

 static_configs:
 - targets: ['localhost:9090']
如果后面配置了exporter组件,可以在scrape_configs里添加job,例如:
scrape_configs:
# The job name is added as a label `job=<job_name>` to any timeseries scraped from this config.
- job_name: 'prometheus'

 # metrics_path defaults to '/metrics'
 # scheme defaults to 'http'.

 static_configs:
 - targets: ['localhost:9090']

- job_name: 'node_exporter'
 static_configs:
 - targets: ['localhost:9100']
启动
# Start Prometheus.
# 默认情况下,Prometheus会将其数据库存储在./data (flag—storage.tsdb.path)中
$ cd prometheus-2.13.1.linux-amd64/
$ nohup ./prometheus --config.file=prometheus.yml >/dev/null &
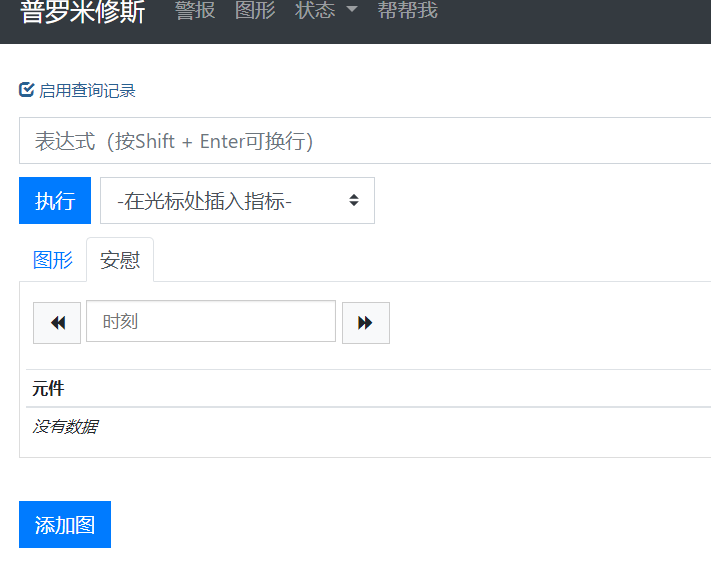
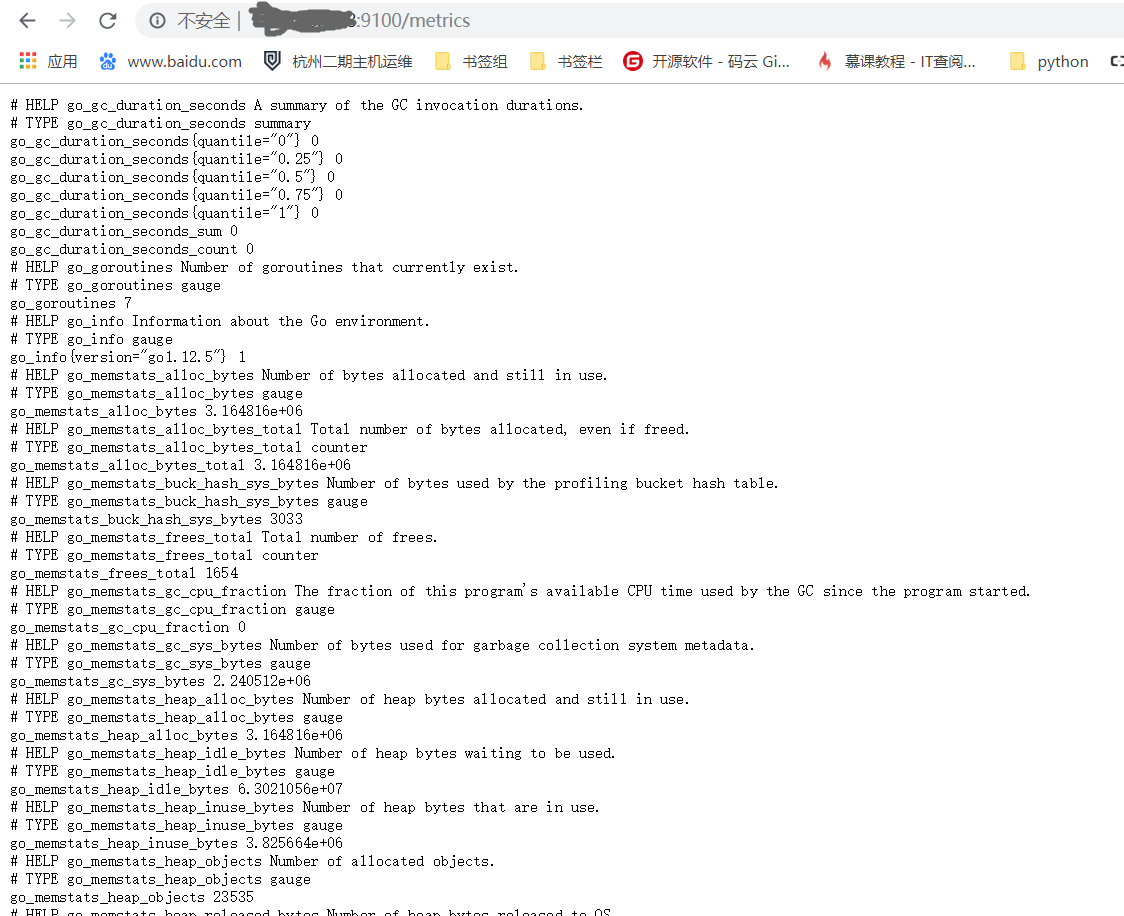
- 验证:可以通过http://ip:9090访问浏览器,或者http://ip:9090/metrics看是否能提供关于自身的各项指标
安装node_exporter
下载二进制安装包,安装并启动
wget https://github.com/prometheus/node_exporter/releases/download/v*/node_exporter-*.*-amd64.tar.gz
tar xvfz node_exporter-*.*-amd64.tar.gz
cd node_exporter-*.*-amd64
nohup ./node_exporter >/dev/null &
- 启动不需要带配置文件,此时服务器会有9100的监听端口。
- 验证: 可以通过访问浏览器http://ip:9100/metrics访问服务器运行指标
安装process_exporter
下载二进制安装包
$ wget https://github.com/ncabatoff/process-exporter/releases/download/v0.5.0/process-exporter-0.5.0.linux-amd64.tar.gz
$ tar -xvf  process-exporter-0.5.0.linux-amd64.tar.gz
$ ll
-rw-r--r-- 1 3434 3434    1076 Apr 14  2019 LICENSE
-rwxr-xr-x 1 3434 3434 7681088 Apr 14  2019 process-exporter
-rw-r--r-- 1 3434 3434   12958 Apr 14  2019 README.md
- 这个解压完后默认是没有配置文件的,需要我们自己写一个,启动时通过-config.path 指定配置文件。
读配置文件的本质就是,读里面配置的服务名,通过服务名称去进行pid的查找和分析,以下为范例<这里使用{{.Matches}}模板>匹配mysql和prometheus两个服务:
$ vim process.yaml
process_names:
  - name: "{{.Matches}}"
    cmdline:
    - 'mysqld'

  - name: "{{.Matches}}"
    cmdline:
    - 'prometheus'
启动
# Start process_exporter.
nohup ./process-exporter -config.path process.yaml >/dev/null &
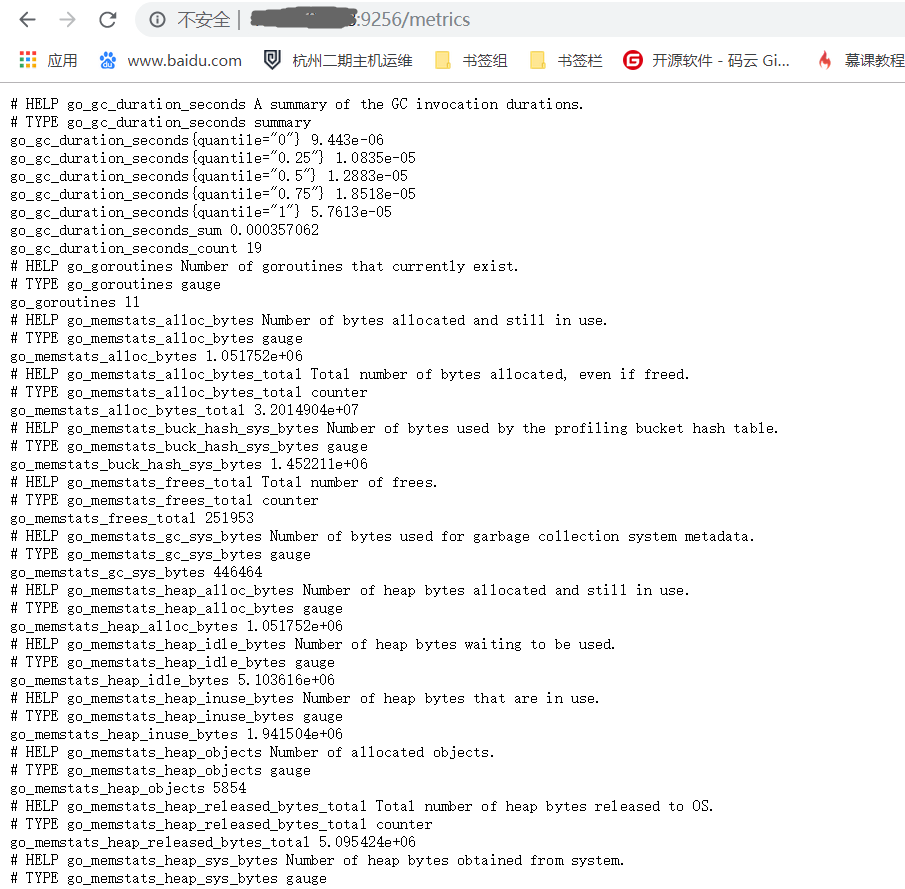
- 验证:访问浏览器http://ip:9256/metrics ,会返回配置文件里指定的服务进程信息
安装grafana
下载二进制安装包
wget https://dl.grafana.com/oss/release/grafana-6.4.3.linux-amd64.tar.gz
tar -zxvf grafana-6.4.3.linux-amd64.tar.gz
启动
- 这里使用官方说明的二进制启动方式,有点忒简单了,正式项目建议都配置为system系统服务
 $ cd grafana-6.4.3
 $ nohup ./bin/grafana-server web >/dev/null &
- 验证:访问浏览器http://ip:3000, 默认的账号密码为: admin / admin

使用grafana配置prometheus数据源
进入grafana管理页面
配置prometheus数据源
- 点击左边齿轮图标————>> Add data source —————>>点击prometheus

- 拉到最下面点击 Save&Test, 然后再点齿轮就可以看到配置的数据源了
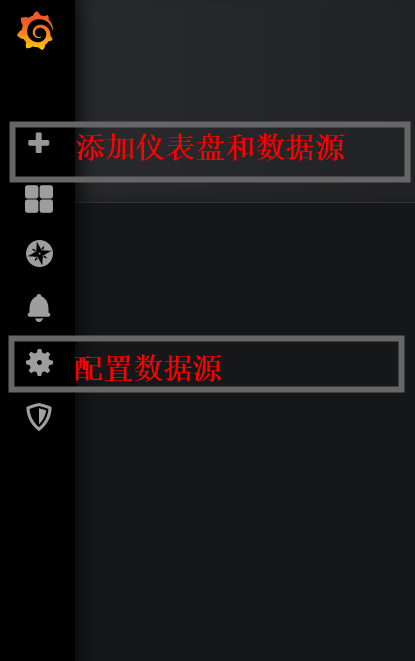
添加仪表盘<可直接看最后一步>
- 点击左边的加号图标————>>点击Choose Visualization(添加仪表盘)
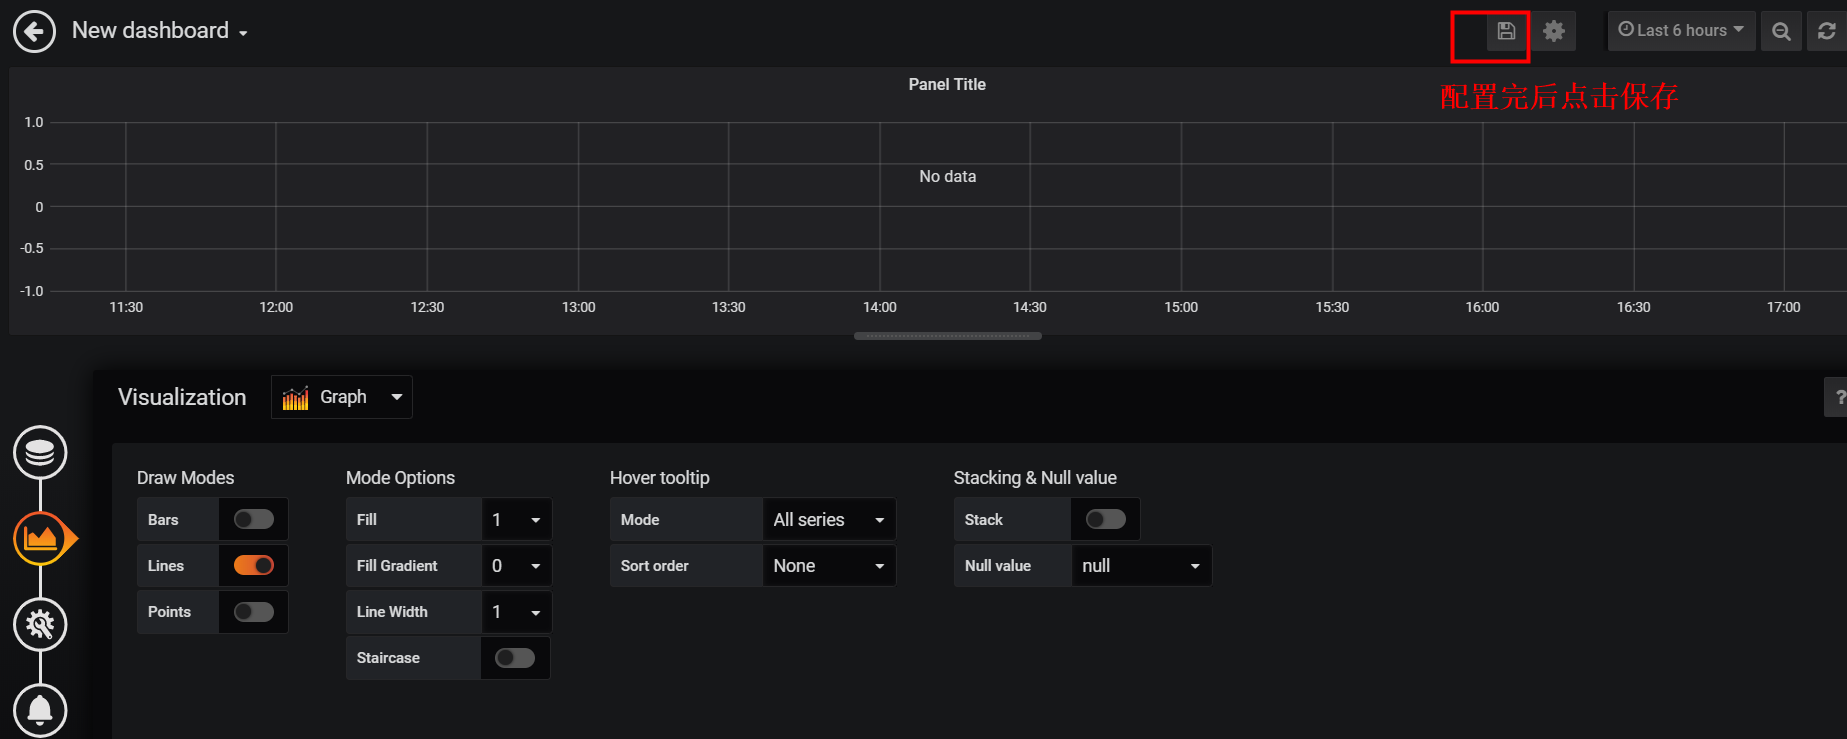
给仪表盘添加数据源<可直接看最后一步>
- 点击左边的方块图标————>>选择刚保存的仪表盘————>>点击仪表盘的Title

使用现有仪表盘模板
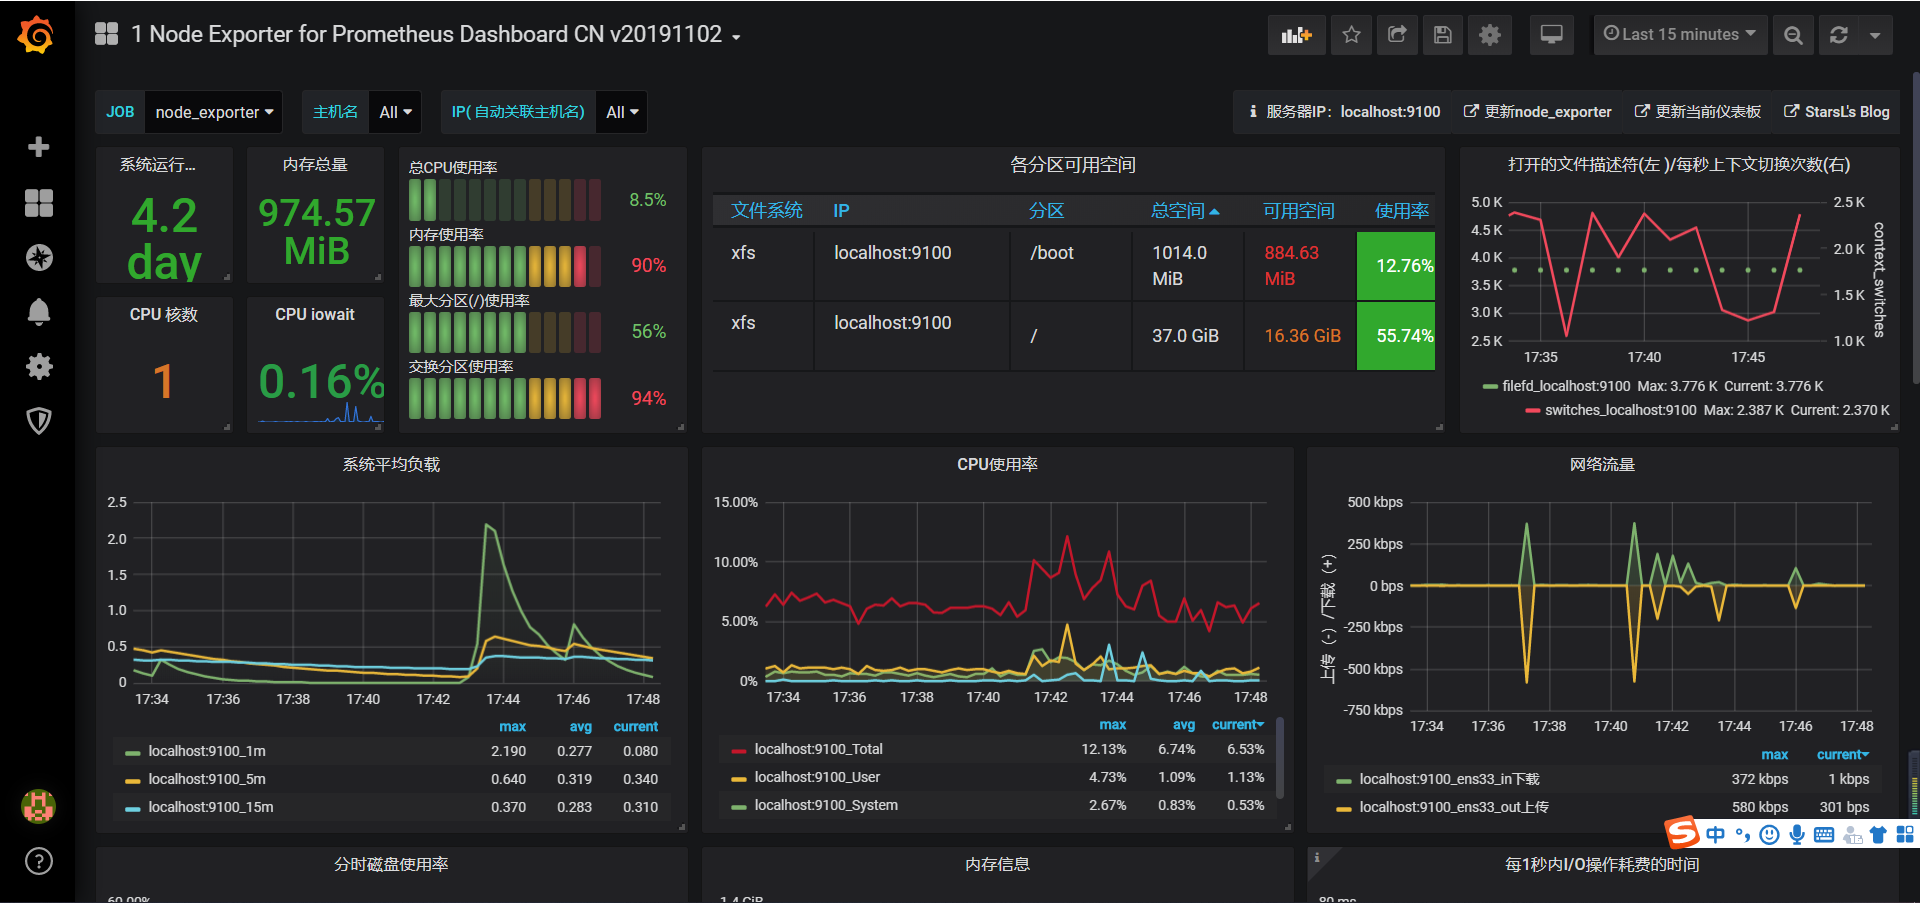
- 点击左边加好图标————>>import————>>在Grafana.com Dashboard中填入8919,然后等待几秒ok
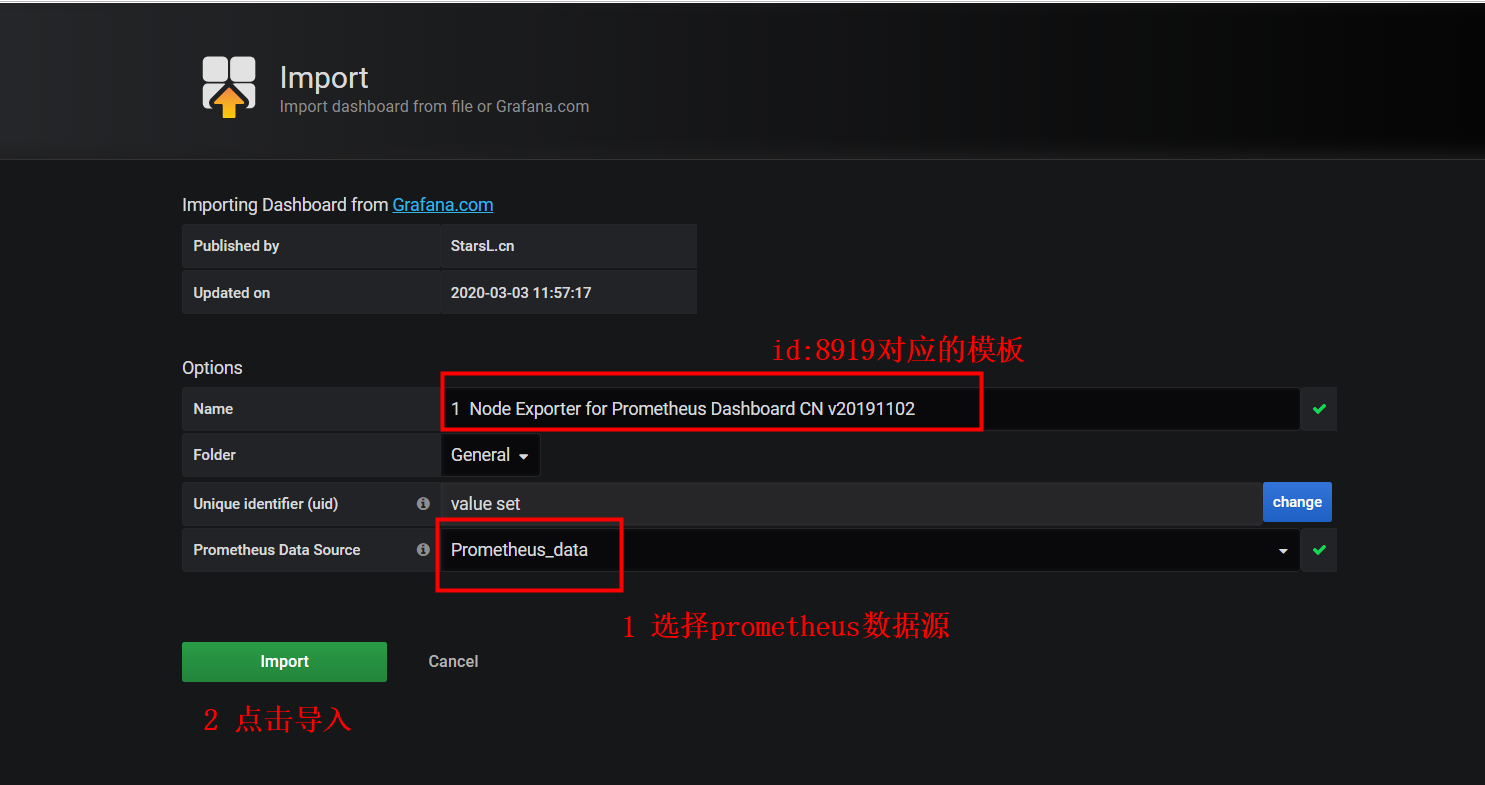
- 最后大功告成
Beautiful is better than ugly.
Explicit is better than implicit.
Simple is better than complex.
Complex is better than complicated.
Flat is better than nested.
Sparse is better than dense.
Readability counts.
Special cases aren't special enough to break the rules.
Although practicality beats purity.
Errors should never pass silently.
Unless explicitly silenced.
In the face of ambiguity, refuse the temptation to guess.
There should be one-- and preferably only one --obvious way to do it.
Although that way may not be obvious at first unless you're Dutch.
Now is better than never.
Although never is often better than *right* now.
If the implementation is hard to explain, it's a bad idea.
If the implementation is easy to explain, it may be a good idea.
Namespaces are one honking great idea -- let's do more of those!

 浙公网安备 33010602011771号