
Understanding SQL Server Query Plans
ore than any other tuning you can perform; creating efficient queries will always give you the most return for your time and effort. I've managed to squeeze a few more percentage points of performance by adding more memory and processors to a system, and I've been able to gain a few more with an efficient storage system. But these only address the way the system handles the work it has to do. To make extreme gains, you have to deal with the work the system is doing to begin with. And in the case of SQL Server, that work involves queries.
It's important to note that what you ask the server to do using Transact-SQL (T-SQL) statements isn't exactly what the server runs. The Query Processor, which is the part of the system that interprets your commands and reformats them, develops a path to get to the data – called theQuery Plan. SQL Server, like many database systems, uses a cost-base system to determine the fastest way to the data. That means it looks at how much each operation (more on those later) costs, and then uses the least expensive way to get to the data you asked for. You can view the query plan, and change your query accordingly to get a better one. This process is calledrefactoring the query. As the developer of the code, it's one of the most important jobs you have. Not only can you refactor a query to speed up the system, but there are other strategies you can follow to tune your system. We'll come to those in a moment.
Before you can refactor the query or make any other adjustments, you need to know what the server is doing. You have several methods you can use to view the query plan, but in this overview I'll focus on just two: a graphical output and a textual output. Both are available in the query windows in the management tools – Query Analyzer (QA) for SQL Server 2000 and SQL Server Management Studio (SSMS) for SQL Server 2005. I'll also only focus on the query plans that don't include XML. In SQL Server 2005, XML gets its own query processor, so I'll cover that in another overview. Also in SQL Server 2005, you can see the query plan in XML, which has some other advantages. In this tutorial however, I'll stick to the views found in both versions.
Viewing the Query Plan
As I mentioned earlier, each step that the cost-based optimizer considers is called an operation. These operations are what you'll use to find out what choices the system made to query the data, and how you can change your query or environment to make it go faster.
There are two primary methods for viewing the output of the query plan: graphical and textual. Let's start with the graphical plans, and then take a look at the text-based methods. I'll stay generic to SQL Server here; ignoring some of the newer operations you'll find in SQL Server 2005. I'll save that discussion for another overview.
To start the graphical plan, just open either Query Analyzer (SQL Server 2000) or SQL Server Management Studio (SQL Server 2005). In Management Studio click the "Query" menu item and select the "Include Actual Execution Plan" item or press CTRL-M. In Query Analyzer choose the "Query" menu item and select "Show Execution Plan" or press CTRL-K. It's a toggle so it will stick until you select the option again.
You can also run the query with the "estimated plan", which doesn't actually run the query. This is useful if you're on a slow system where it would take some time to run the query, but to be honest, I don't use it that often. The reason is that many of my queries are non-deterministic – they don't have the same result every time. For instance, if you pass in a set of variables to a query, as most of the time you will, the system doesn't really know what you're going to ask it. So it's kind of like my saying to you, "Just go down the street a little way, and then turn left somewhere. How long do you think that will take you?" You won't know, because I haven't given you enough information to find out. The query processor is the same way, so I've found that using the actual query plan rather than the estimate is more useful.
So let's set that option and then take a look at the results of the graphical query output. I've run the following query in the Adventureworks database on my SQL Server 2005 Express system. If you have SQL Server 2000, you'll want to use either the pubs or Northwind sample database and one of your own queries to check the display. Here's my sample query:
USE [AdventureWorks]
GO
SET SHOWPLAN_ALL ON

SELECT
  e.[EmployeeID]
  ,c.[Title]
  ,c.[FirstName]
  ,c.[MiddleName]
FROM [HumanResources].[Employee] e
  INNER JOIN [Person].[Contact] c
  ON c.[ContactID] = e.[ContactID]

GO
And here is the output it produced on my system:
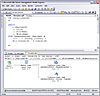
I say "on my system" because sometimes a plan will render differently based on the hardware or more often the indexes and other environmental settings on different systems.
So what do all these graphics mean? Well, there's a complete list here, but that list can be a bit overwhelming. Sure, the pictures and descriptions are there, but what do they really mean? To understand them in relation to what is happening on your server, you should read through them all and bookmark that reference to them. Once you have a basic understanding of the icon, the important thing is to figure out why the system chose those particular operators in that order to satisfy the query.
By the way, you can also hover over the icons on the screen to see a lot more information about what the query processor was thinking. In fact, some of those icons can be acted on, as I'll explain later.
It helps to think of the query plan like the engine for a chess game on a computer. The Query Processor has gone through as many "moves" as it can within a reasonable period of time and assigned the operators it thought best to solve the problem. You have to consider these moves not so much individually as much as part of a group. Since understanding all the operations will take articles, in this exercise we'll only focus on a couple of them.
You can see from the query results of the simple query I have here that a few things are going on. The plans are read right to left, top to bottom, so if you're a native English speaker make sure you keep that in mind.
As you read through the icons from right to left, you'll see what the system did. When the branches split into two or more lines, the operations were happening at the same level of execution. You'll notice that these are always brought back together with another operator, sometimes a join or merge operation and sometimes a computational operation. Each icon will have a percentage of time that the query processor spent on it as a portion of 100%. In fact, you can get another visual clue by looking at the width of the arrows that connect the operators.
You may notice that some icons have two operations listed, separated by a slash mark. The first of these is the physical operator (what really happened) followed by the logical operation (how it happened). This will become clearer as you read through the icons.
We're not going to spend a lot of time here on the meaning of the icons. There are some icons that have definite meanings, such as a Seek operation being better than a Scan operation, but most of the time, it depends. If something takes 1/10000000 of a second to complete for the whole query, it really doesn't matter if it was a Scan or a Seek. We'll come back to the meaning of these icons in another tutorial.
I mentioned that you can also view the query plan using text commands. The primary text commands are SET SHOWLPLAN_TEXT ON and SET SHOWPLAN_ALL ON. These have the same effect as the graphical output, but instead of the icons you get the text descriptions and not as much detail. These statements must be the only ones in the query you run, and the queries that follow only show the plan until you issue the SET SHOWLPLAN_TEXT OFF or SET SHOWLPLAN_ALL OFF.
Changing the Query Plan
Now that you know how to display the plan for your query, you can make changes to the query to take a different path, in a more optimized fashion.
Refactoring the Query
The first place you should dealing with the query plan is to evaluate the query statements. There are some basic strategies that you can consider right away when you build your query that will make the query processor work less – and when you decrease the workload, the overall task will complete faster.
Strategy #1: Don't get what you don't need
You would think that this is an obvious thing to do. When you go to the grocery store, for instance, you don't usually buy coffee filters if you don't have a coffee machine. In fact, to save money, you probably make a list of things that you need and you only buy those things. No one would think of buying everything in the Dairy aisle when all they want is one carton of milk! But this happens all the time in database programming.
You should almost never use the SELECT * FROM tablename statement. If you need the first and last names from a table, ask for just those columns and no others. While it might seem trivial, it could well be the difference between the system being able to use an Index Seek and avoid a Table Scan operation.
The point is, only ask for the specific things you need.
As part of this strategy, make sure you have a WHERE clause on your queries. It's very rare to need all of the data even in one column, and if you don't include a WHERE clause in the query, you'll almost always cause a SCAN operation. Scans are very expensive unless the table is small, say fewer than a thousand rows or so.
Strategy #2: Set up your environment
It's important to have enough resources to run your queries. You need a fast drive, a good network connection strategy, and enough memory and CPU resources to ensure that the system doesn't wait on resources unnecessarily. I've covered these concepts in another tutorial. The good news is that by tuning your queries, you make the server work less, which lessens the need for more hardware.
The other part of the environment to take care of is to preface your queries with the right options. You should normally include a SET NOCOUNT ON and other options to keep the system from doing more than you need. Remember, each query sent to the server is treated as a batch of operations, and will take either the environment settings defined by the server or those specified in your transaction or batch.
Strategy #3: Use indexes properly
I've covered indexes in other places on this site, but you'll see them pop up in lots of locations. Used correctly, they can make your queries perform exceptionally well. Used incorrectly, they can actually slow things down.
One of the most interesting aspects of indexes is the statistics. These are indexes created by SQL Server to track metadata about how best to find or use an index. In the graphical plan output I mentioned earlier, you'll see a red icon around an operation with missing indexes. Right-click that item, and you can bring up a dialog that will create or update them for you.
Strategy #4: Think globally, act locally
You would think that this is an obvious thing to do. When you go to the grocery store, for instance, you
There are more things you can do to tune your queries, and I'll cover those in depth in another tutorial. For now, take these basic concepts and follow them in your scripts.
Query Hints
SQL Server supports several query hints that can be used to help optimize a query. These hints include FORCE ORDER, LOOP JOIN, and KEEP PLAN. Once again, I'll cover these in another tutorial since they have a lot of information you need to know before you use them.
But when environment variables (such as referenced table row counts, statistics, and indexes) change, these statements don't always "stick". In SQL Server 2005, you can use the USE PLANquery hint which provides more control and can make the plan stay more consistent.
We've taken a look at the basics of what a query plan is and how you can view them graphically or in text. In other tutorials, especially those dealing with tuning queries, we'll use these skills to help us narrow in on the right thing to do and the right time to do them.
Online Resources – Understanding SQL Server Query Plans
One of the absolutely best resources on this topic is the blog from the team that wrote the software: http://blogs.msdn.com/sqlqueryprocessing/archive/2006/09/29/introduction-to-showplan.aspx

