
Splunk初识
网址汇总
下载:https://www.splunk.com/en_us/download.html
文档:https://docs.splunk.com/Documentation/Splunk/8.0.0
管理员手册:https://docs.splunk.com/images/0/00/Splunk-6.5.0-zh_CN-Admin.pdf
注册与下载
注: 官网注册账号需要审核,下载链接只有登录才能获得,可以直接使用下面的下载链接。可以直接下载,链接是免费版的Splunk。
1. windows下载链接:https://download.splunk.com/products/splunk/releases/8.0.0/windows/splunk-8.0.0-1357bef0a7f6-x64-release.msi
2. rpm下载链接: https://download.splunk.com/products/splunk/releases/8.0.0/linux/splunk-8.0.0-1357bef0a7f6-linux-2.6-x86_64.rpm
3. tgz下载链接:https://download.splunk.com/products/splunk/releases/8.0.0/linux/splunk-8.0.0-1357bef0a7f6-Linux-x86_64.tgz
安装
# 使用 tgz 进行安装
tar -xf splunk-8.0.0-1357bef0a7f6-Linux-x86_64.tgz
cd ./splunk/bin
./splunk startcurl
#
用物理机 访问 hostname:8000,输入账号密码。
使用
中文环境
默认进入的环境是英文环境,可以直接改url
默认的:http://test:8000/en-GB/app/launcher/home
更改为:http://test:8000/zh-CN/app/launcher/home
第一次进入的时候,会有使用教程进行提示
关于APP
APPs会为一些想要使用的场景提供解决方案,不能的APP可能是对业务层面的隔离,也可能具体到某曾数据层面的隔离。比如:我拥有一组服务器的LOG而对于这个LOG可能就可以创建一个APP,里面都是对于LOG信息的可视化展示。
Splunk自带的APP
Splunk提供了一组APP,可以直接安装在你的Server上,访问:http://test:8000/zh-CN/manager/launcher/appsremote?offset=0&count=20&order=latest。可以查找应用。
推荐安装Splunk Dashboard Examples来学习。需要登录官方账号与密码。
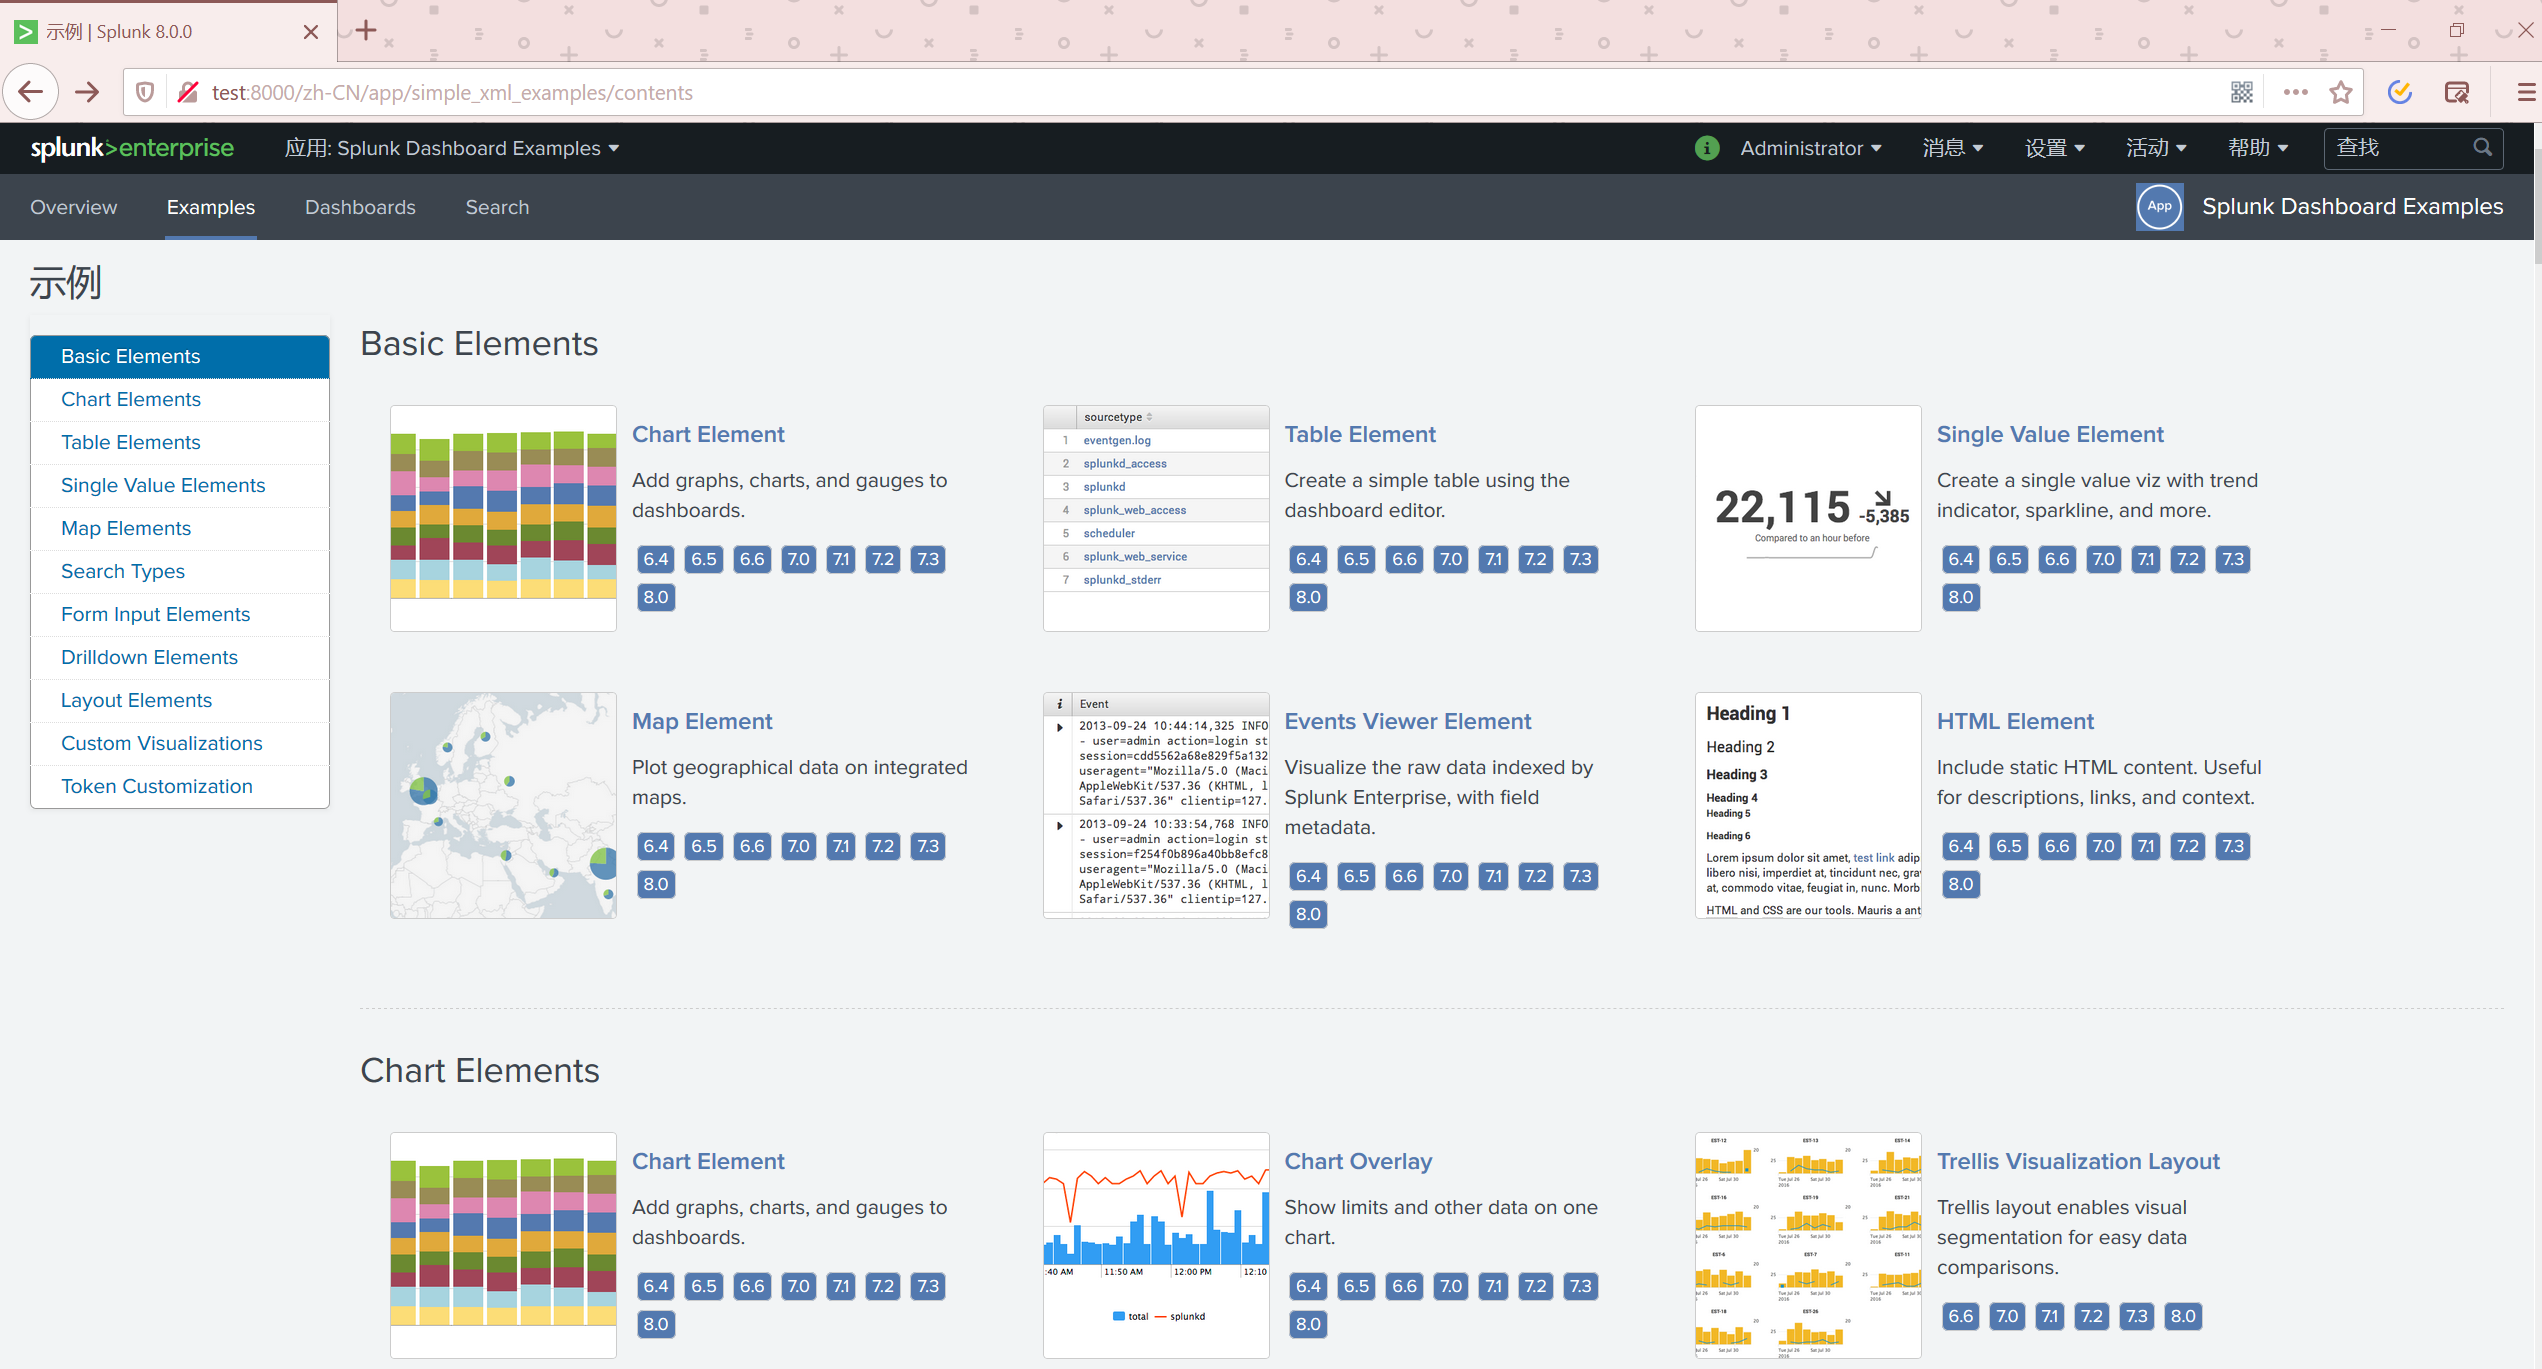
可以通过例子,对Splunk有一个深入的了解。
创建自己的APP
进入管理应用:http://test:8000/zh-CN/manager/simple_xml_examples/apps/local 右上角有创建APP

进入APP
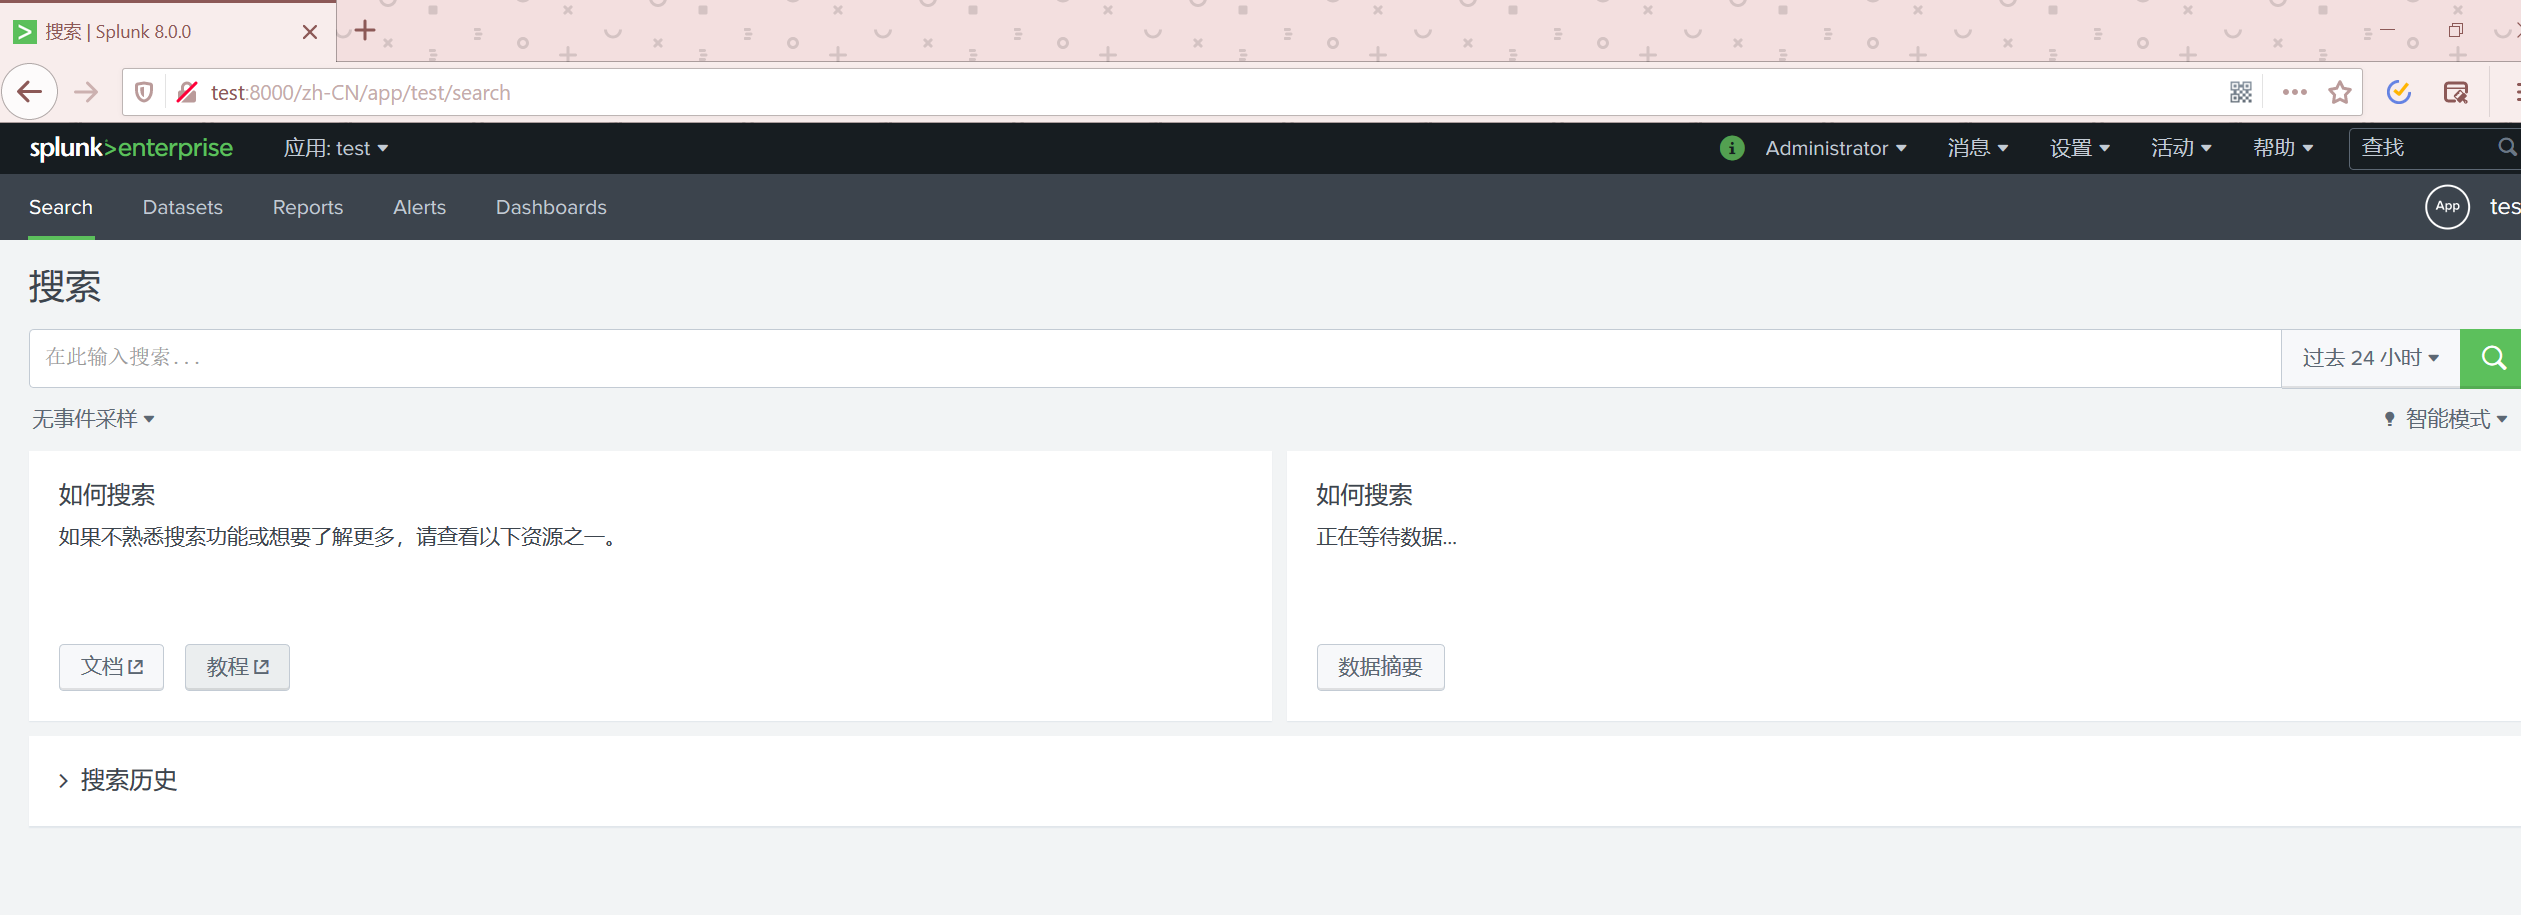
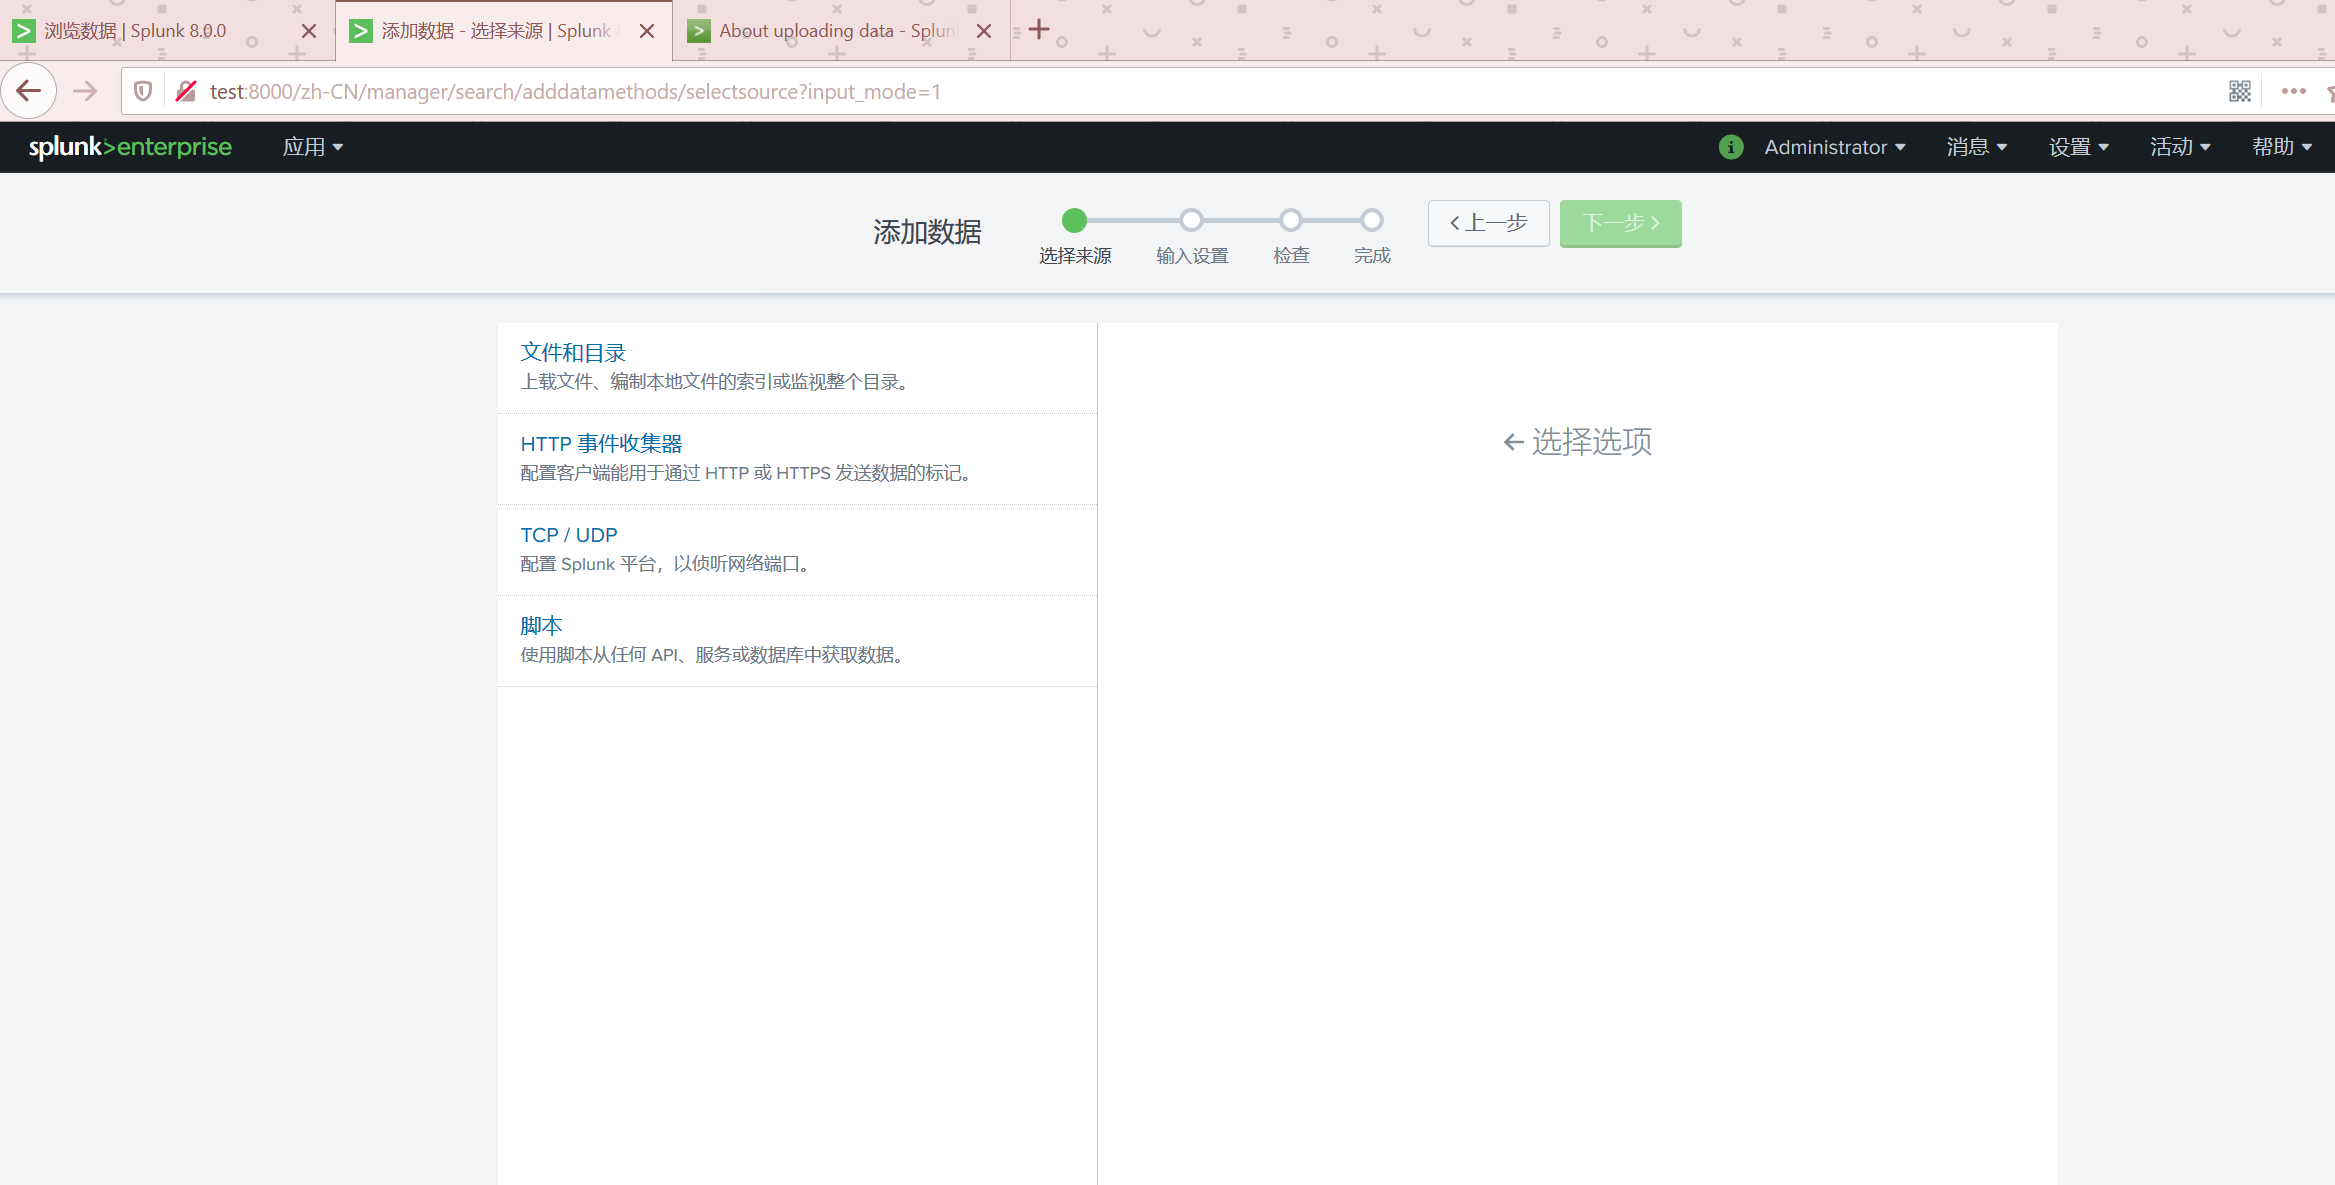
添加数据
点击如图的位置进行数据添加。
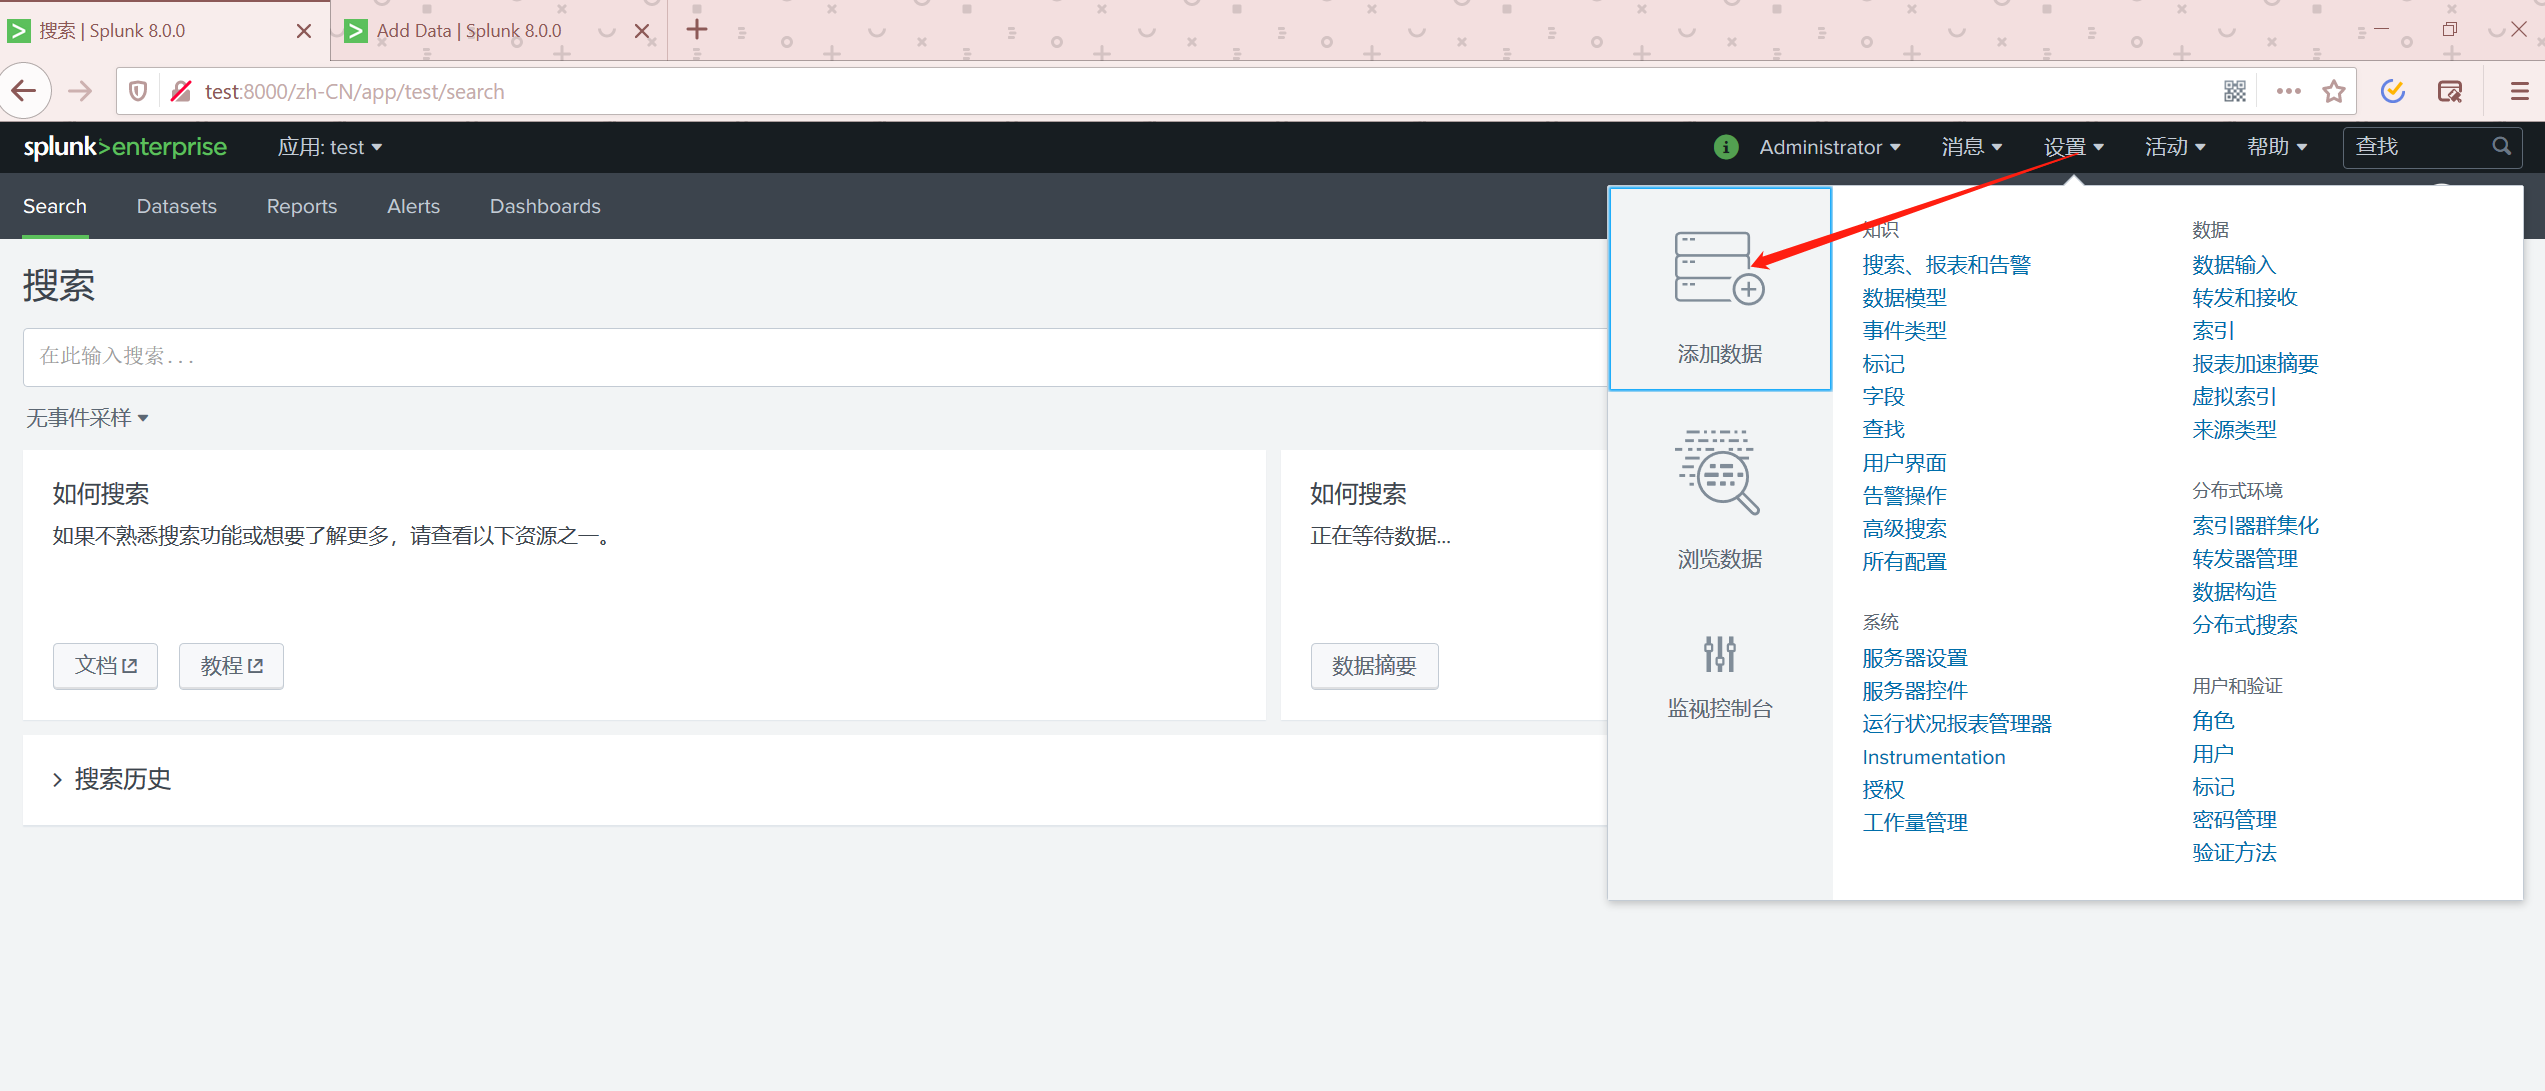
添加数据可以直接从Splunk的合作平台直接链接过来。我们尝试手动添加数据。
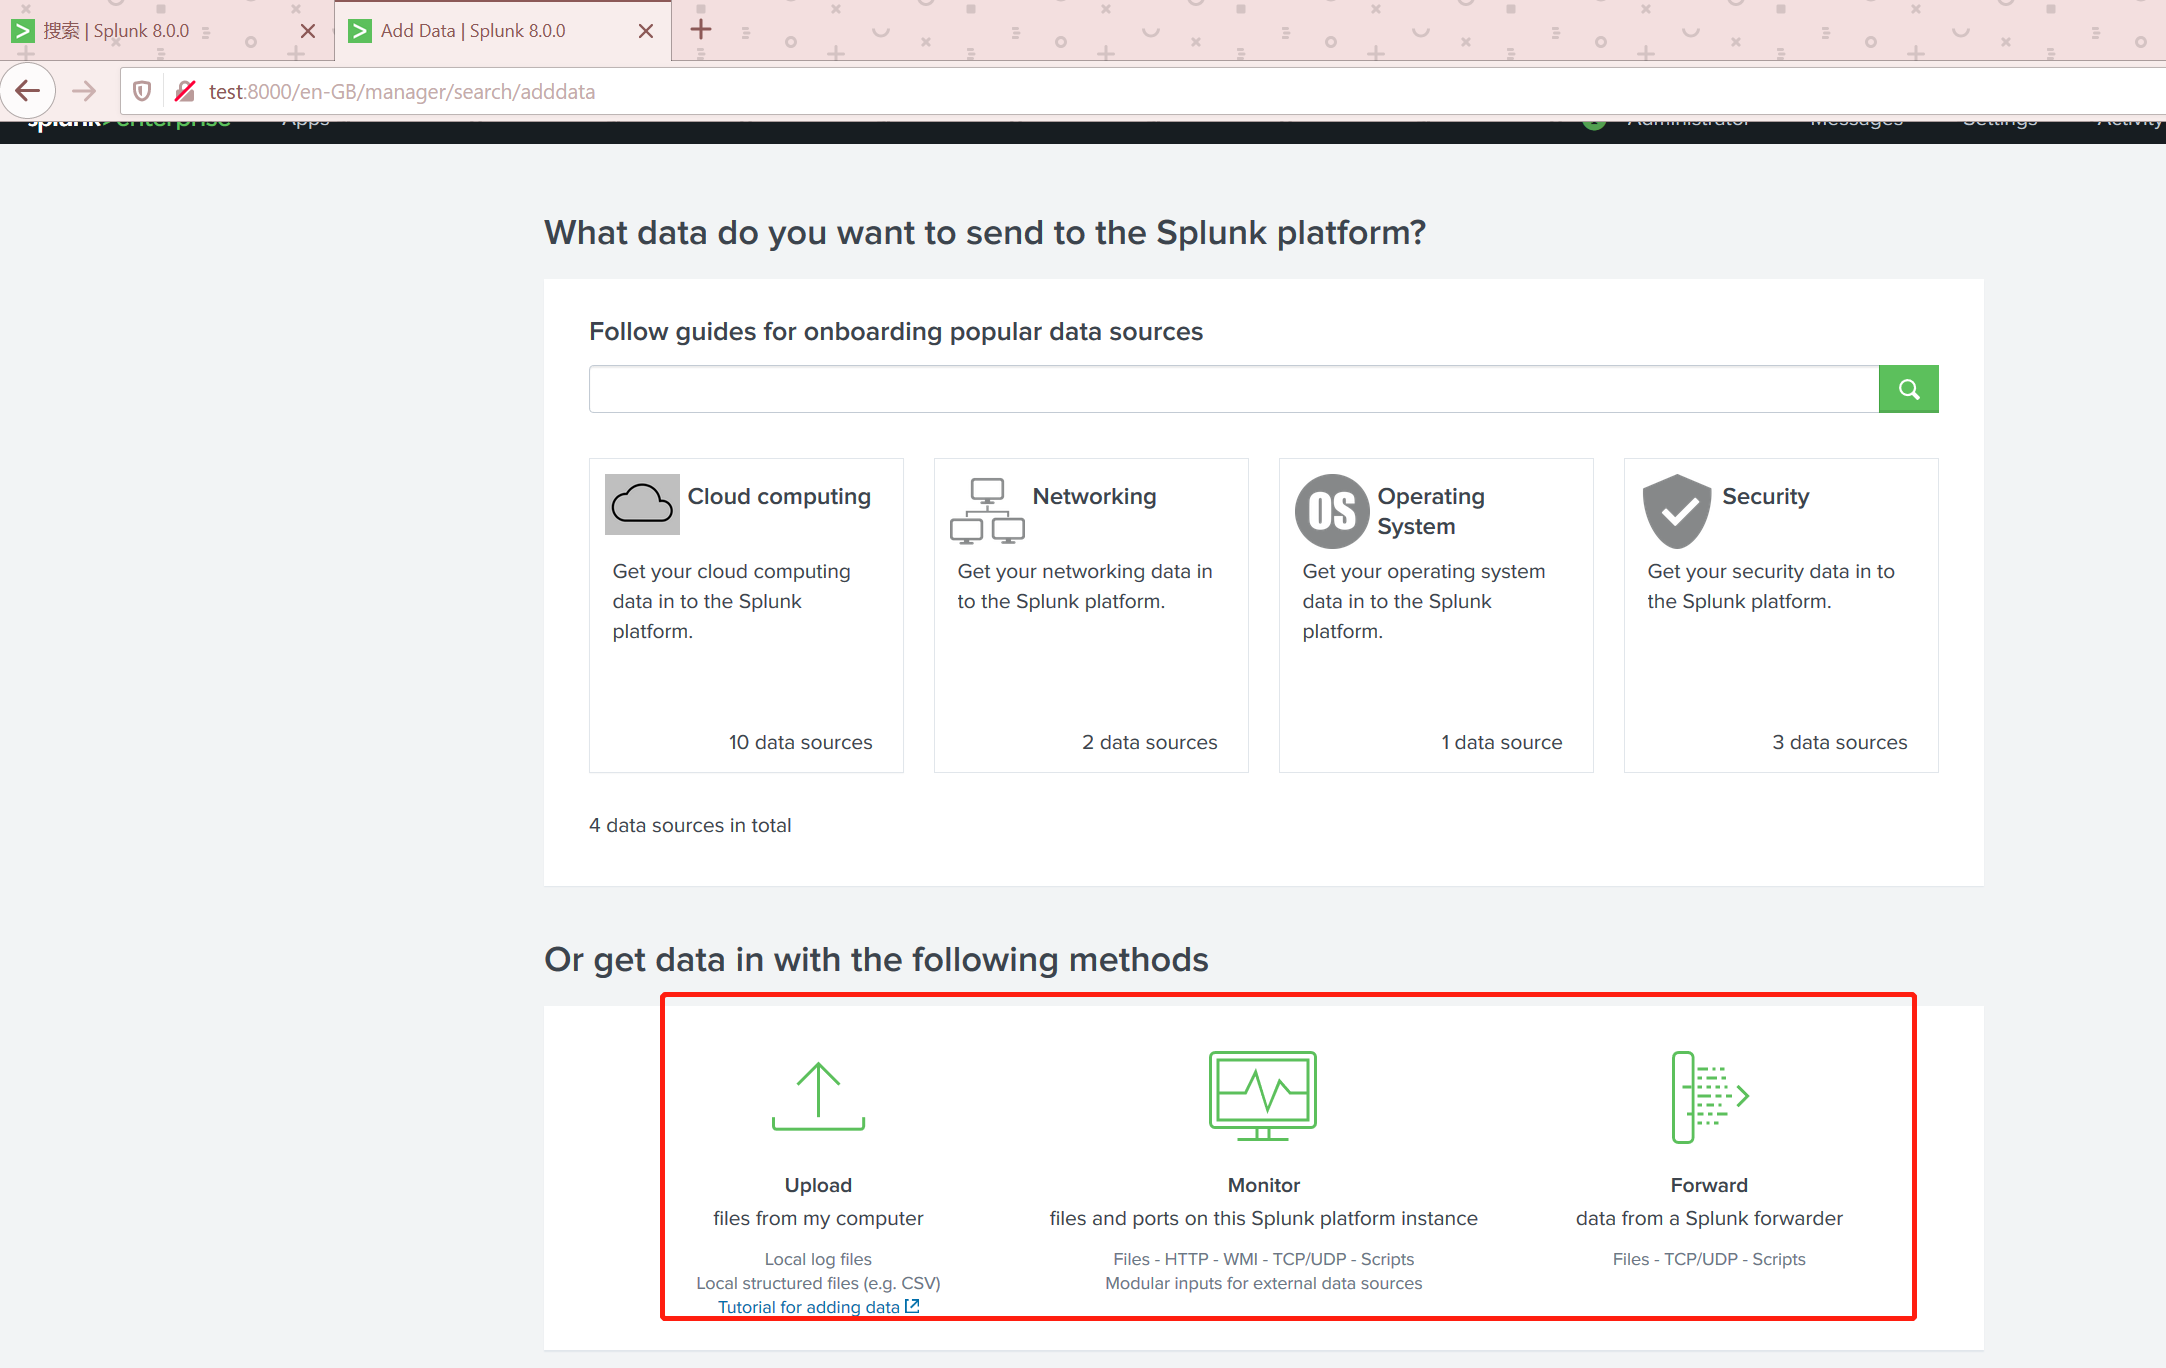
本地文件添加
到官网查看 支持的本地文件类型:https://docs.splunk.com/Documentation/Splunk/8.0.0/SearchTutorial/AboutgettingdataintoSplunk。
如下是我提取的表格:
| Data source | Description |
|---|---|
| Files and directories | Most data that you might be interested in comes directly from files and directories. |
| Network events | The Splunk software can index remote data from any network port and SNMP events from remote devices. |
| IT Operations | Data from IT Ops, such as Nagios, NetApp, and Cisco. |
| Cloud services | Data from Cloud services, such as AWS and Kinesis. |
| Database services | Data from databases such as Oracle, MySQL, and Microsoft SQL Server. |
| Security services | Data from security services such as McAfee, Microsoft Active Directory, and Symantec Endpoint Protection. |
| Vituralization services | Data from virtualization services such as VMWare and XenApp. |
| Application servers | Data from application servers such as JMX & JMS, WebLogic, and WebSphere. |
| Windows sources | The Windows version of Splunk software accepts a wide range of Windows-specific inputs, including Windows Event Log, Windows Registry, WMI, Active Directory, and Performance monitoring. |
| Other sources | Other input sources are supported, such as FIFO queues and scripted inputs for getting data from APIs, and other remote data interfaces. |
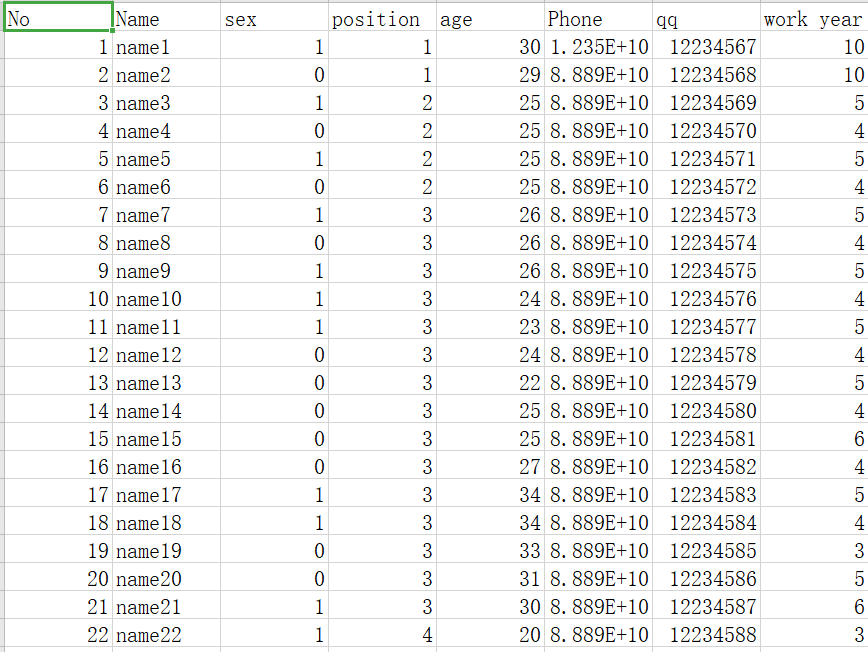
CSV文件
准备了这样一份CSV
按照步骤依次
全部默认就可以。
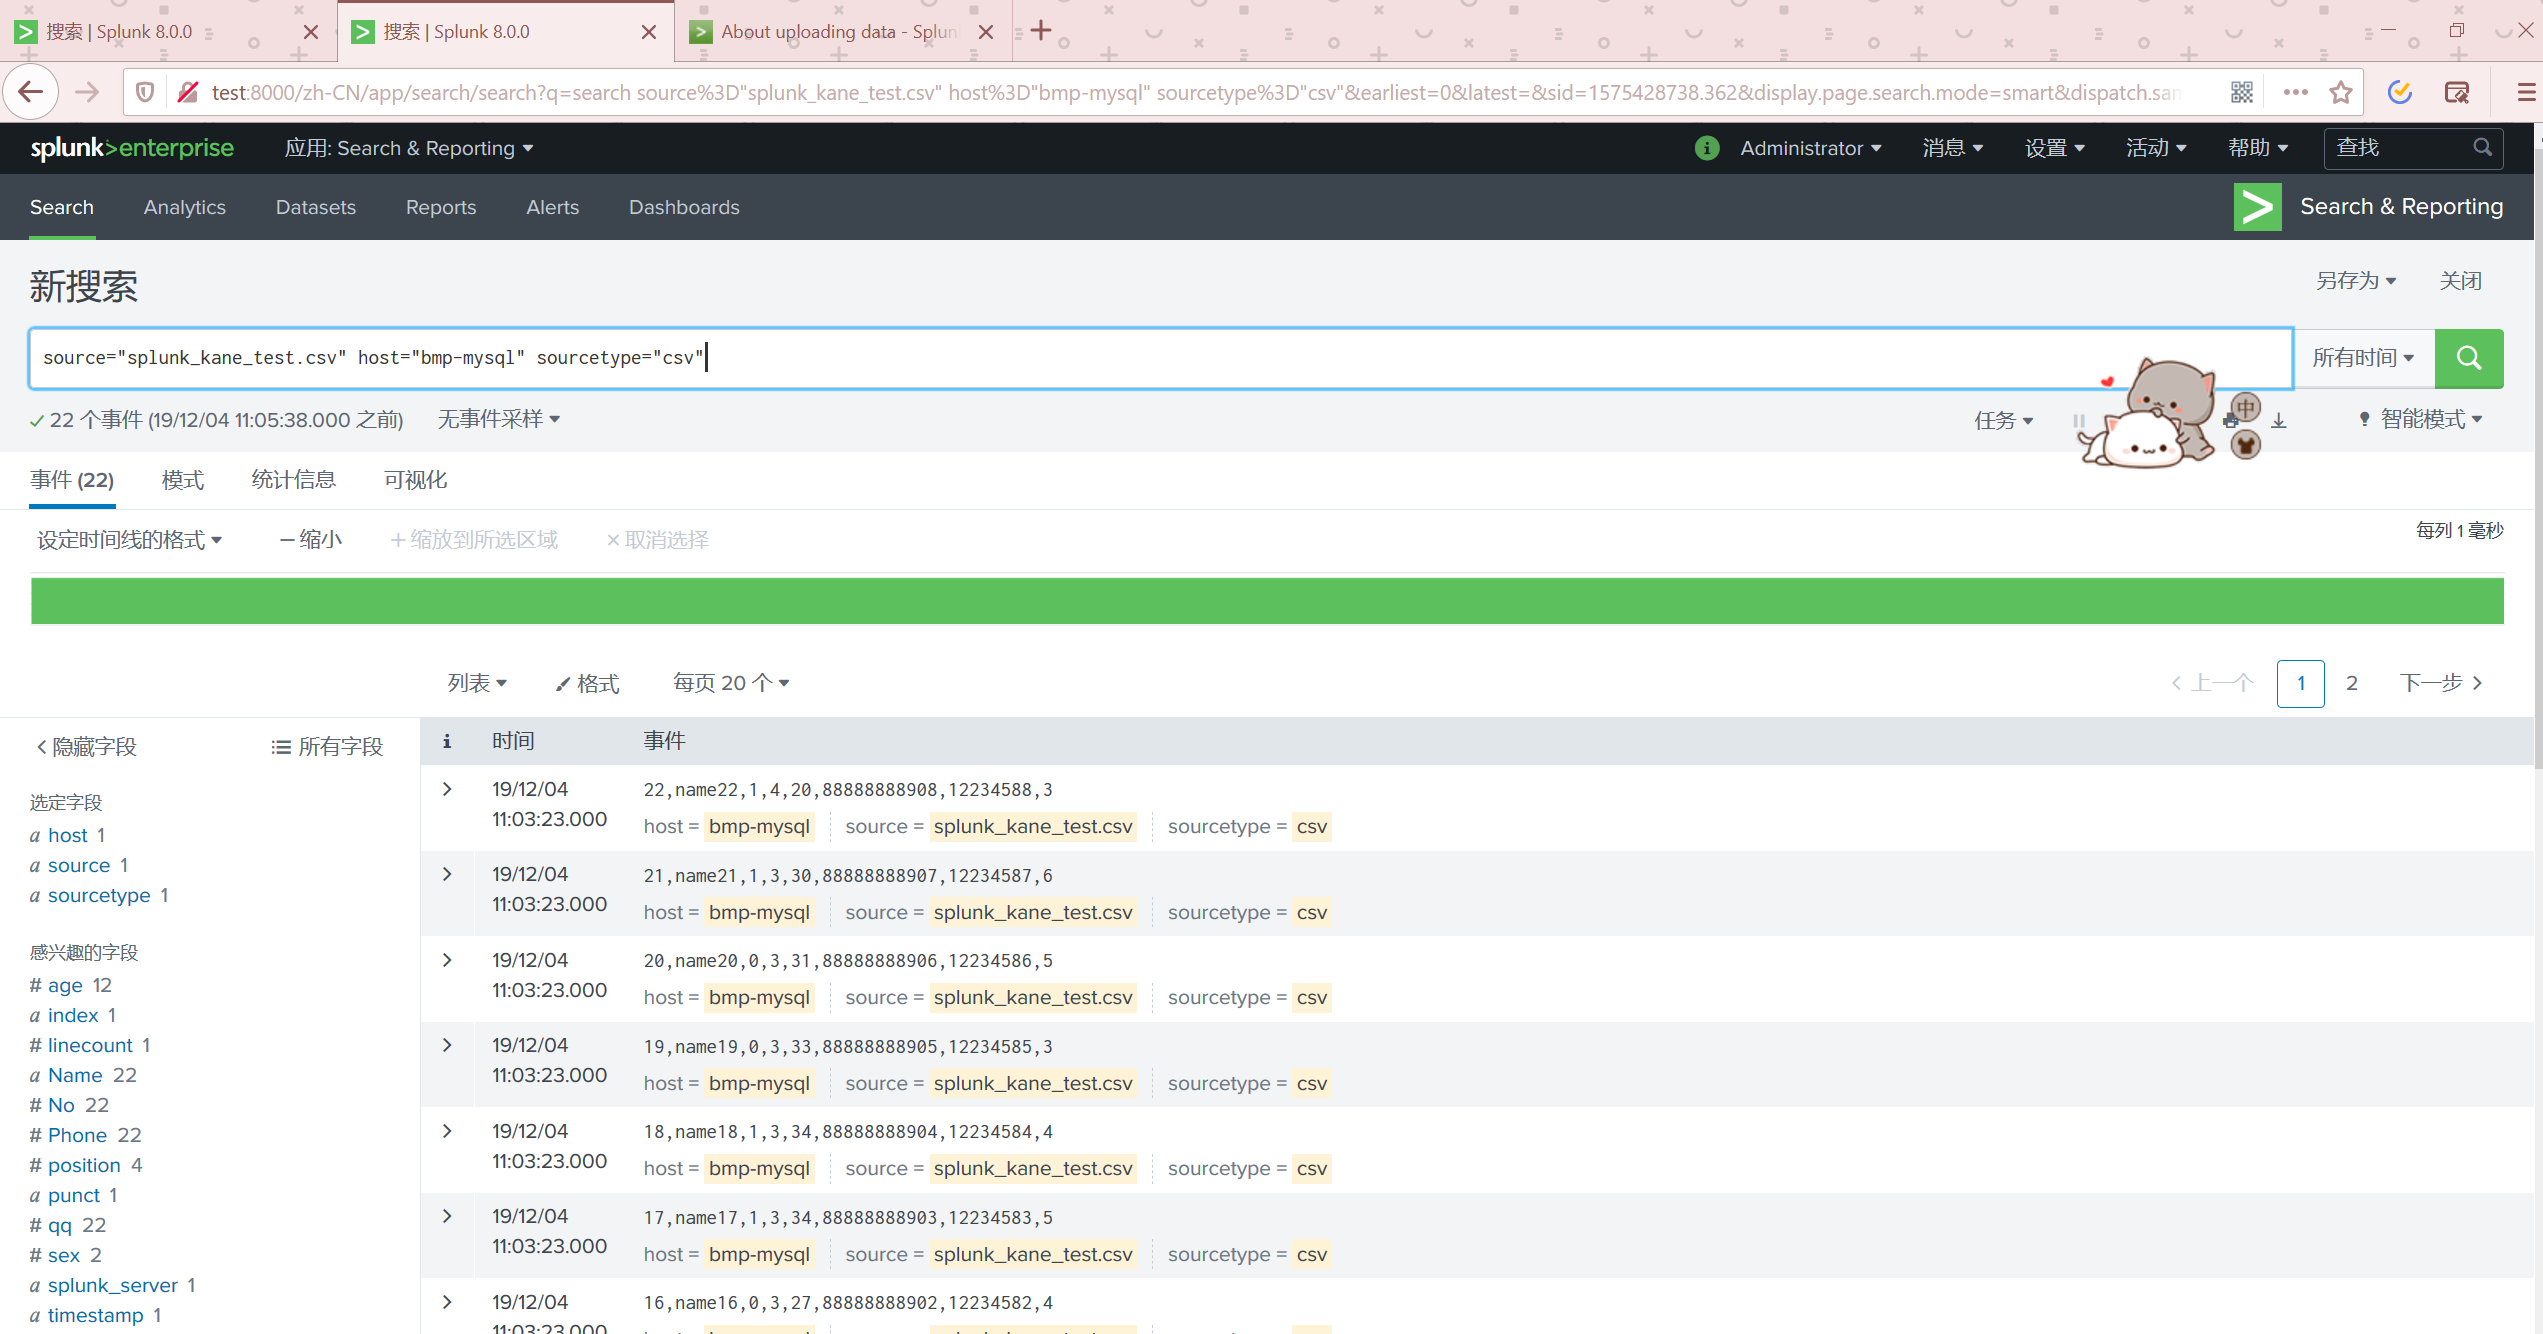
我们点击开始搜索查看数据
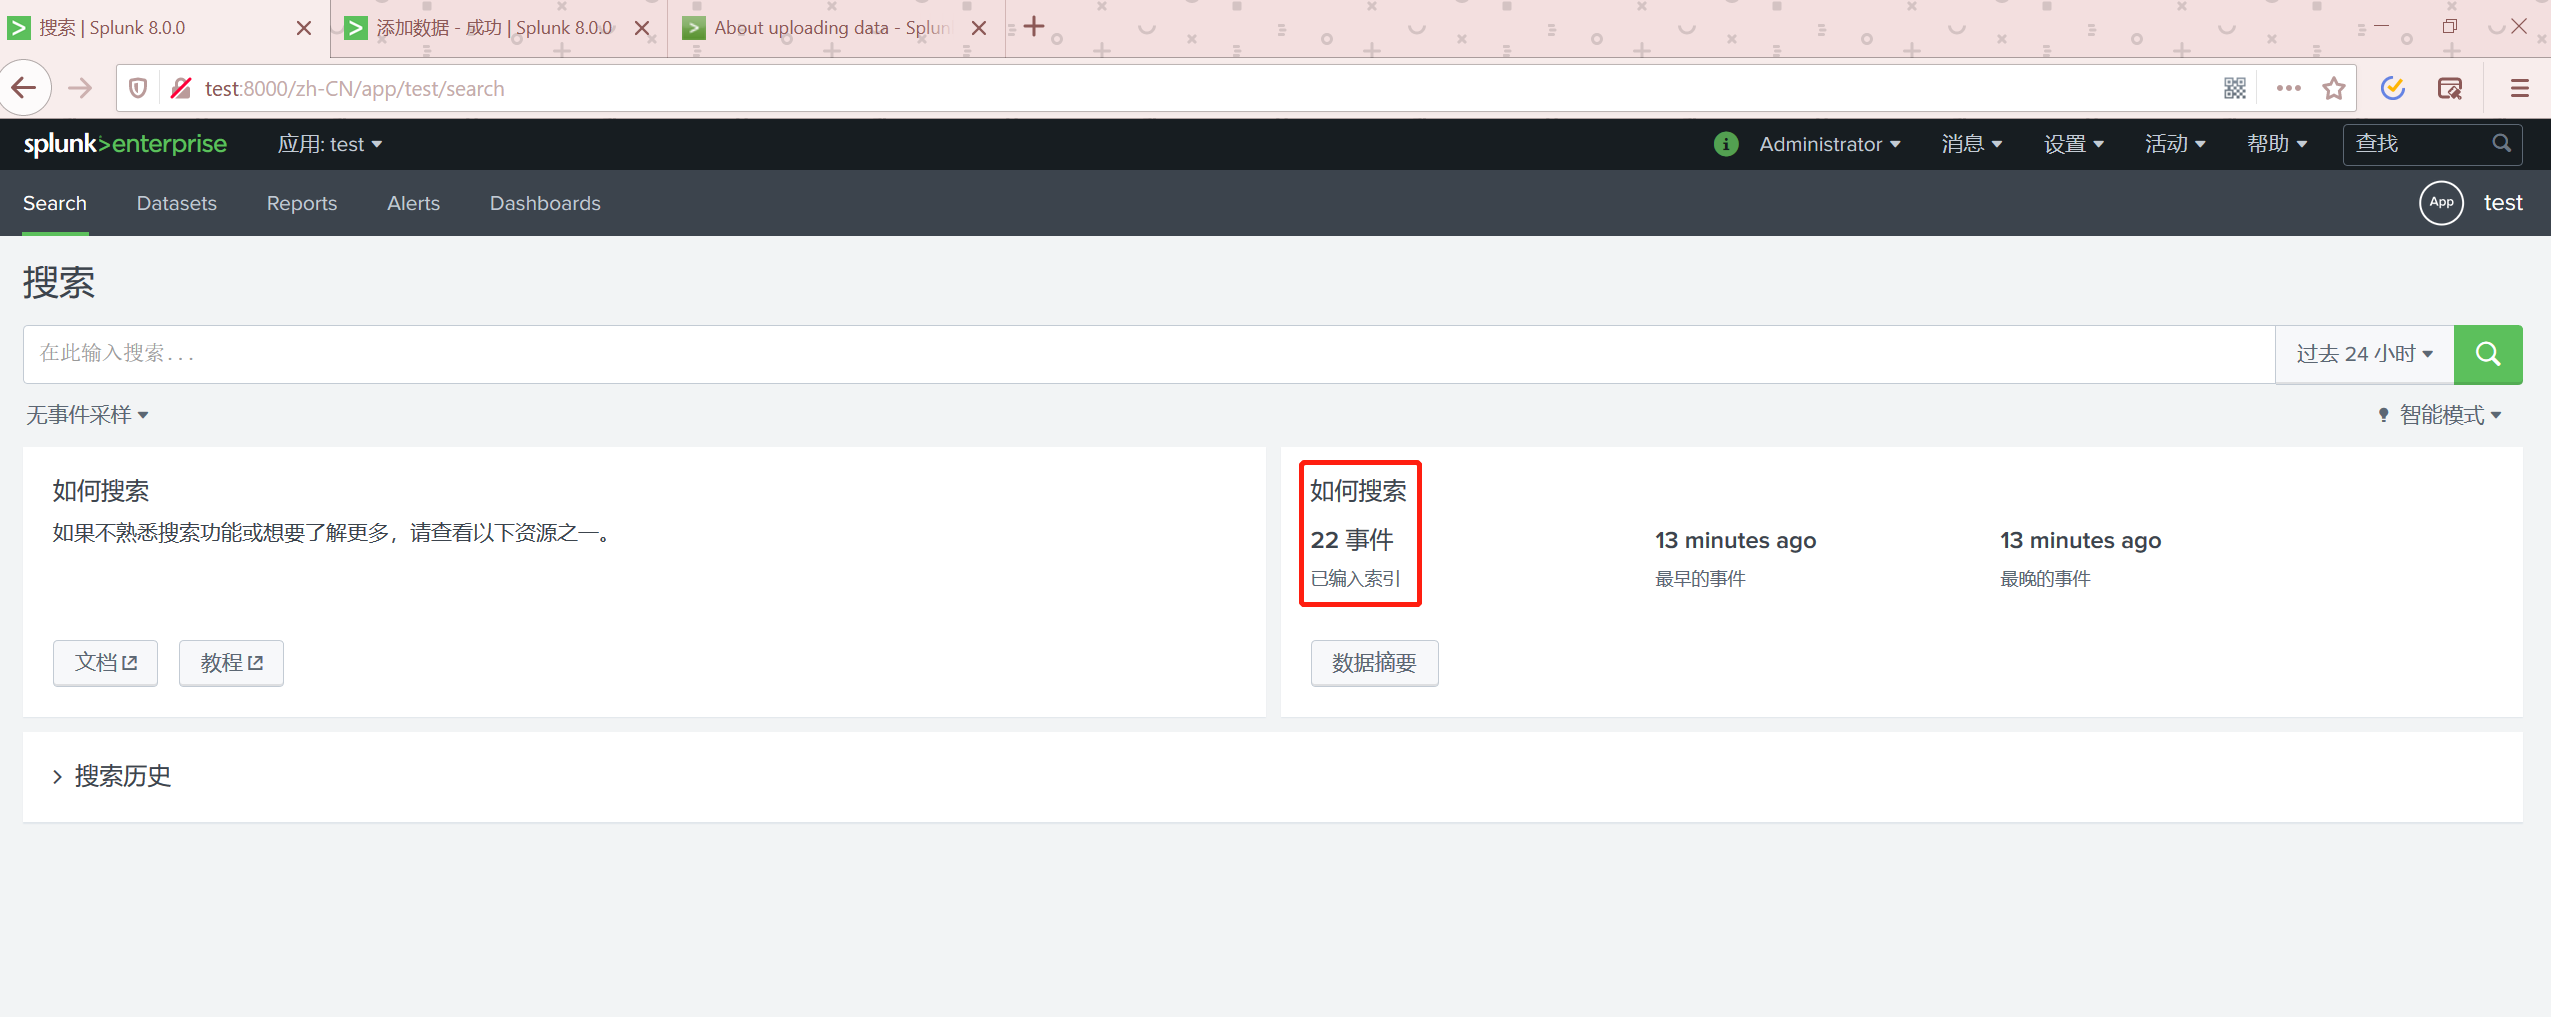
返回到APP首页可以查看数据已经有了
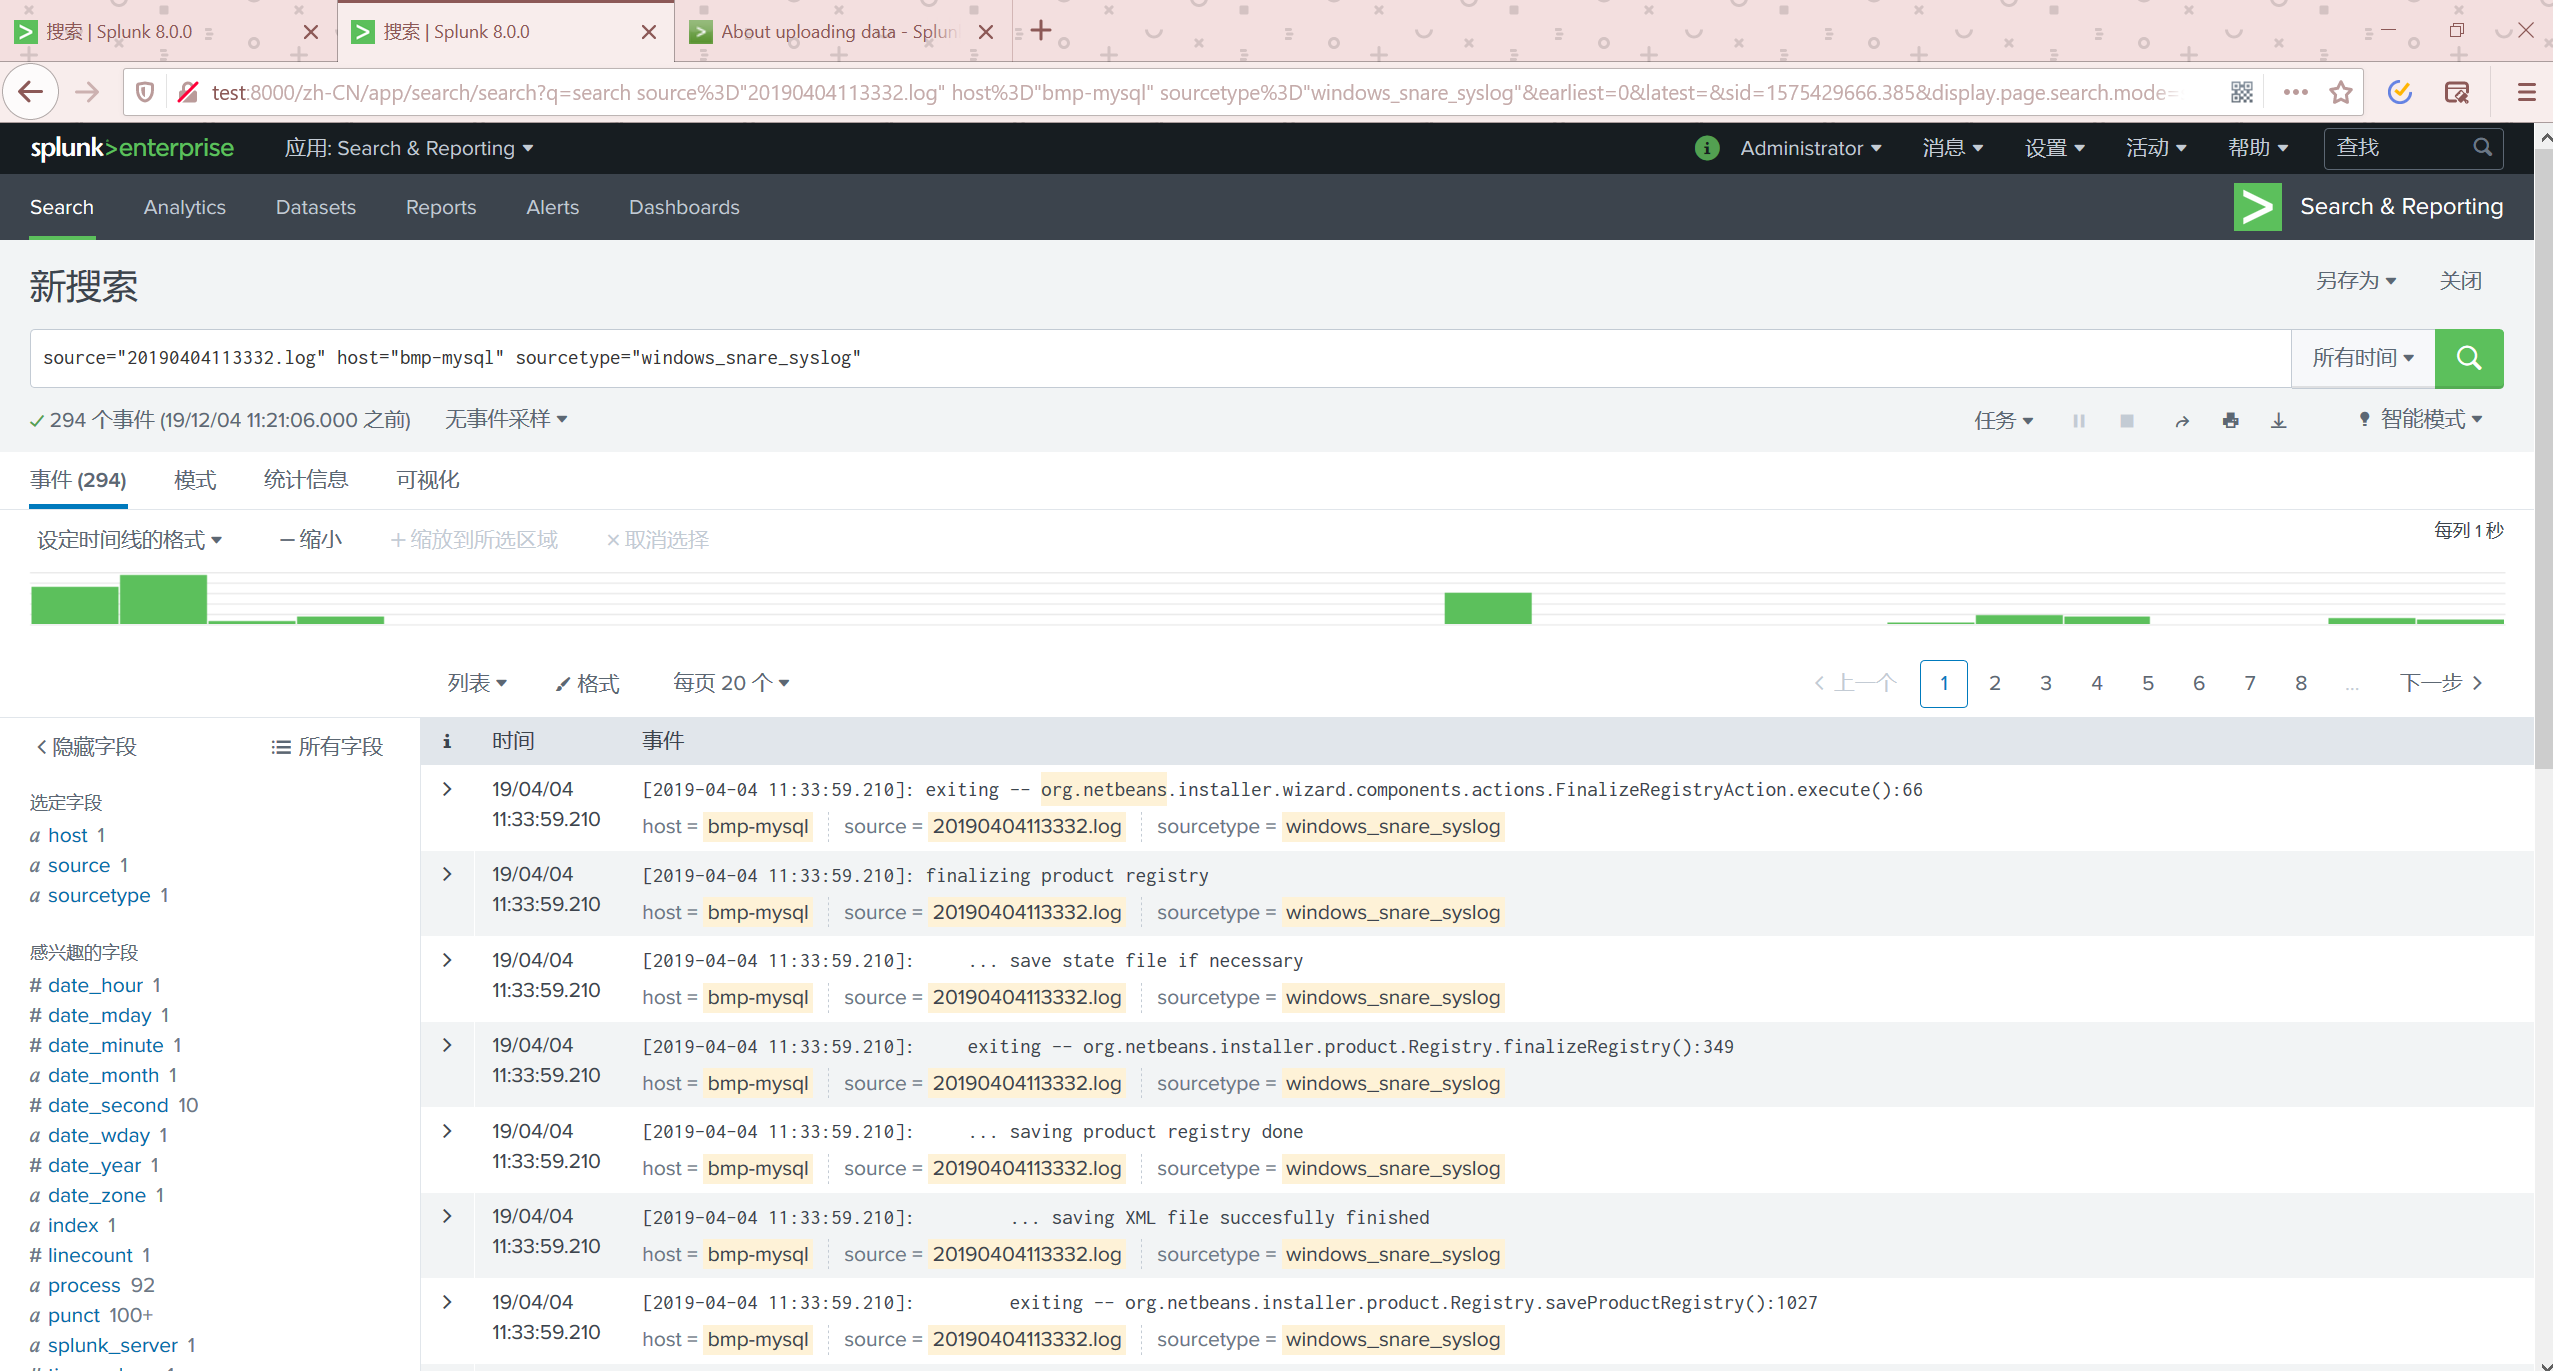
LOG文件
准备这样一份log文件
[2019-04-04 11:33:32.722]: entering -- org.netbeans.installer.Installer.main():81
[2019-04-04 11:33:32.725]: initializing the installer engine
[2019-04-04 11:33:32.725]:     entering -- org.netbeans.installer.Installer.<init>():116
[2019-04-04 11:33:32.725]:     ... initializing ErrorHandler
[2019-04-04 11:33:32.726]:     ... end of ErrorHandler initialization
[2019-04-04 11:33:32.726]:     exiting -- org.netbeans.installer.Installer.<init>():116
[2019-04-04 11:33:32.726]:     entering -- org.netbeans.installer.Installer.<init>():117
[2019-04-04 11:33:32.727]:     dumping target system information
[2019-04-04 11:33:32.727]:         system properties:
[2019-04-04 11:33:32.728]:             awt.toolkit => sun.awt.windows.WToolkit
[2019-04-04 11:33:32.728]:             file.encoding => GBK
[2019-04-04 11:33:32.729]:             file.encoding.pkg => sun.io
[2019-04-04 11:33:32.729]:             file.separator => \
[2019-04-04 11:33:32.729]:             java.awt.graphicsenv => sun.awt.Win32GraphicsEnvironment
[2019-04-04 11:33:32.729]:             java.awt.printerjob => sun.awt.windows.WPrinterJob
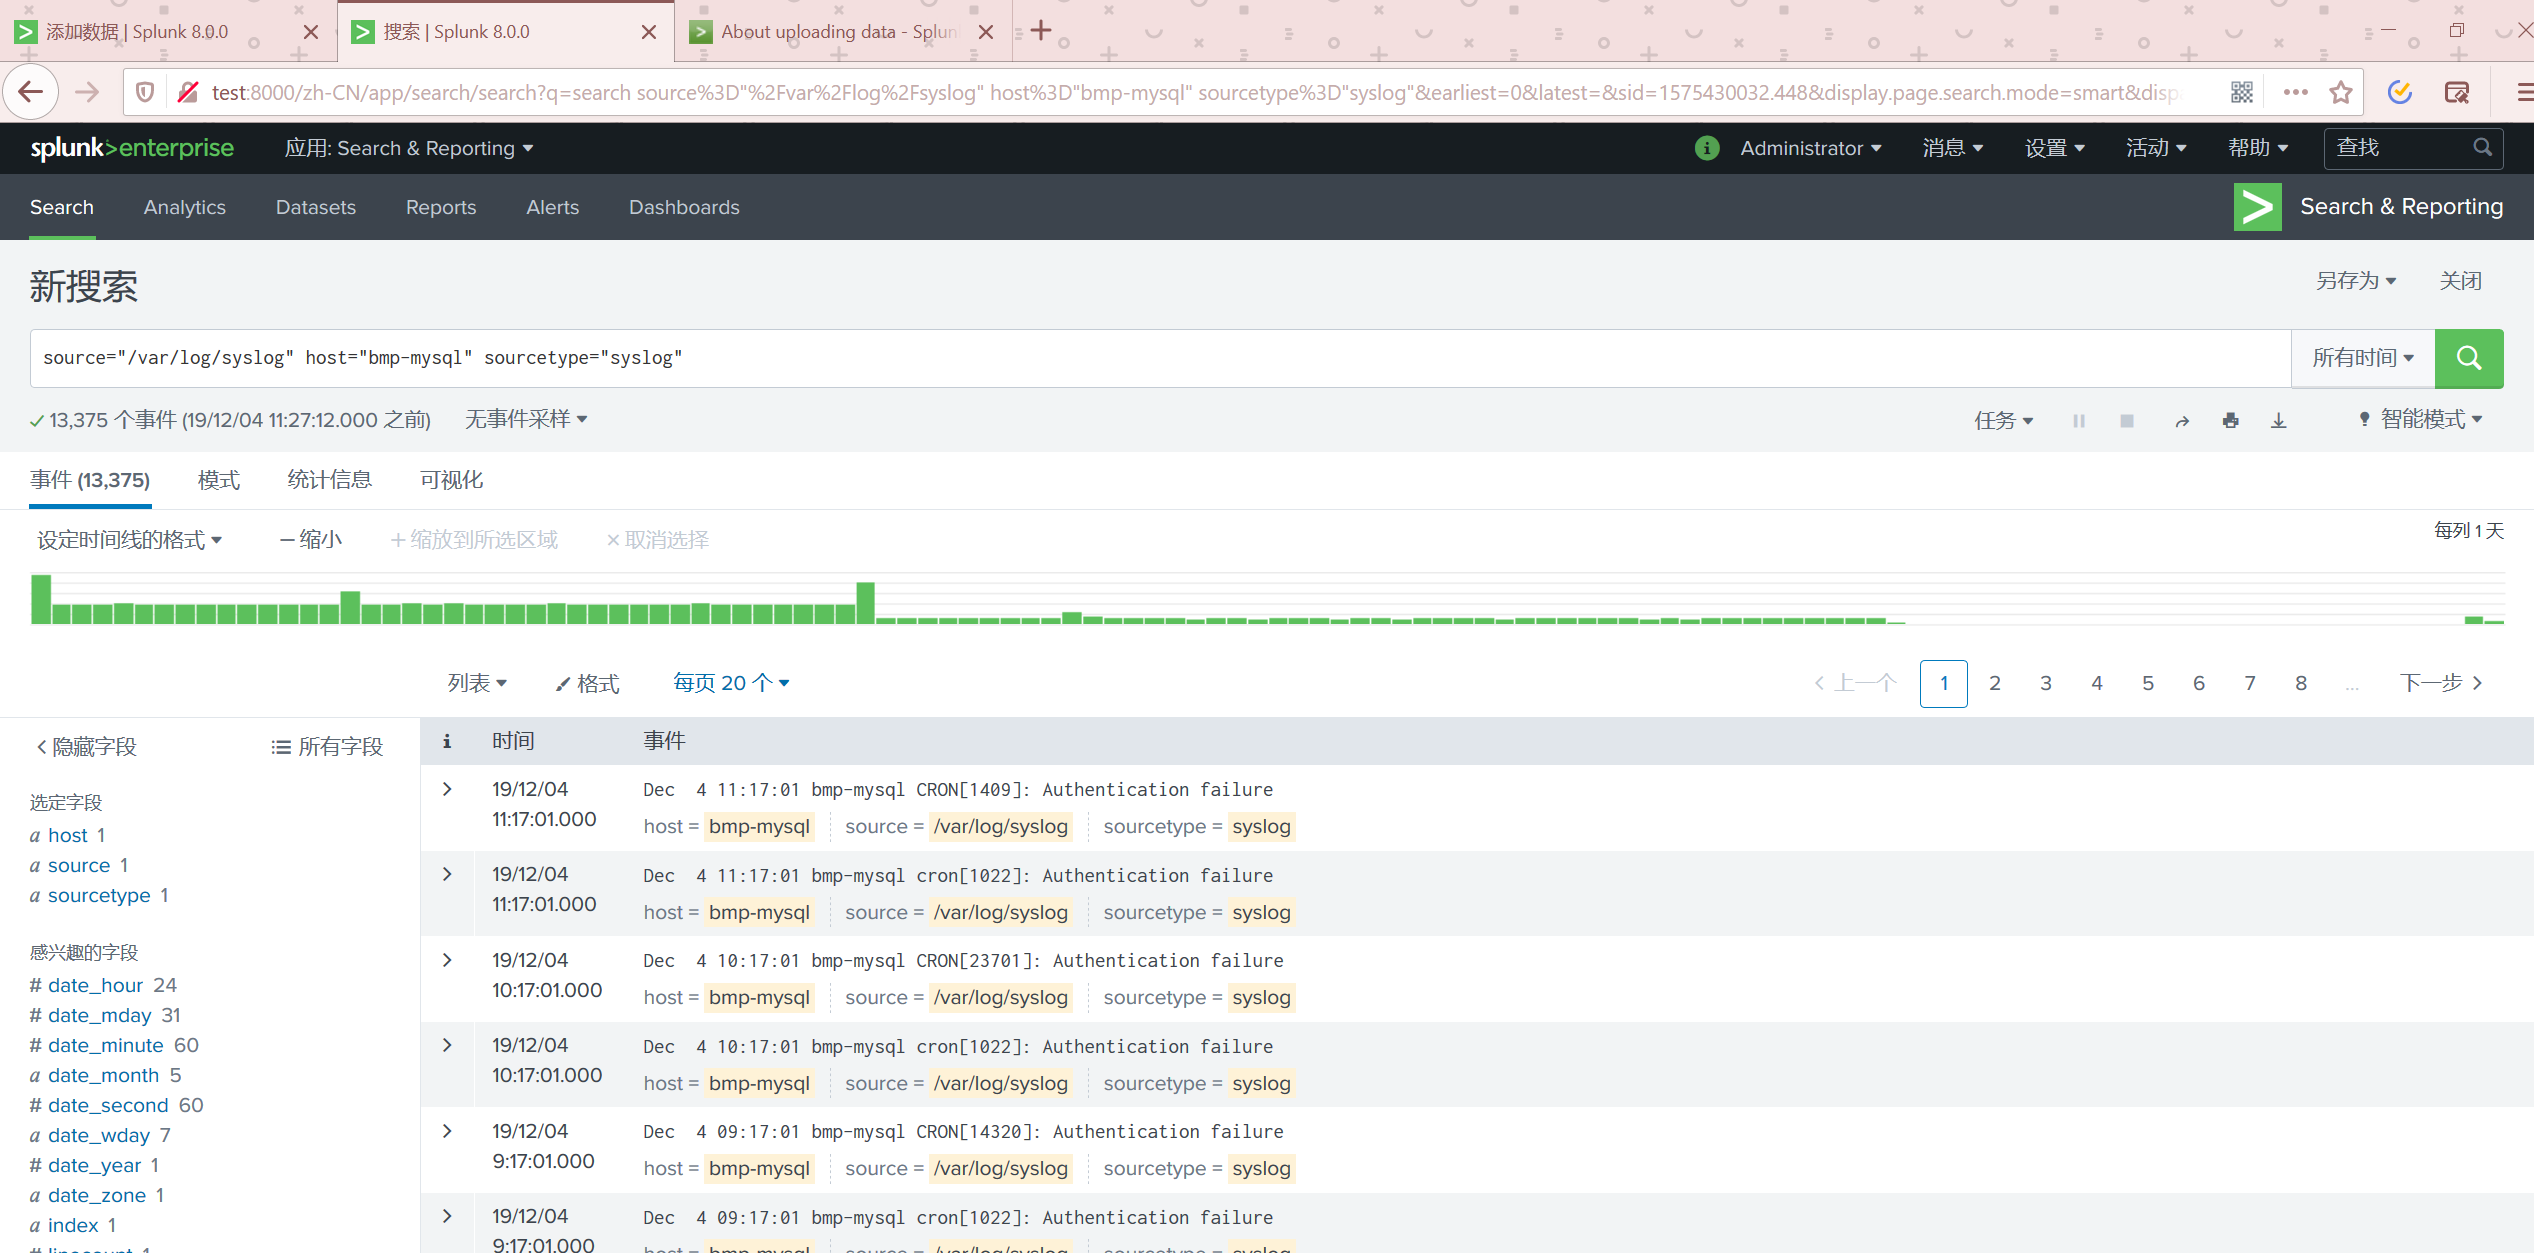
查看数据
通过监视添加数据
我们选择添加数据的监视
监测一个文件
自定义列
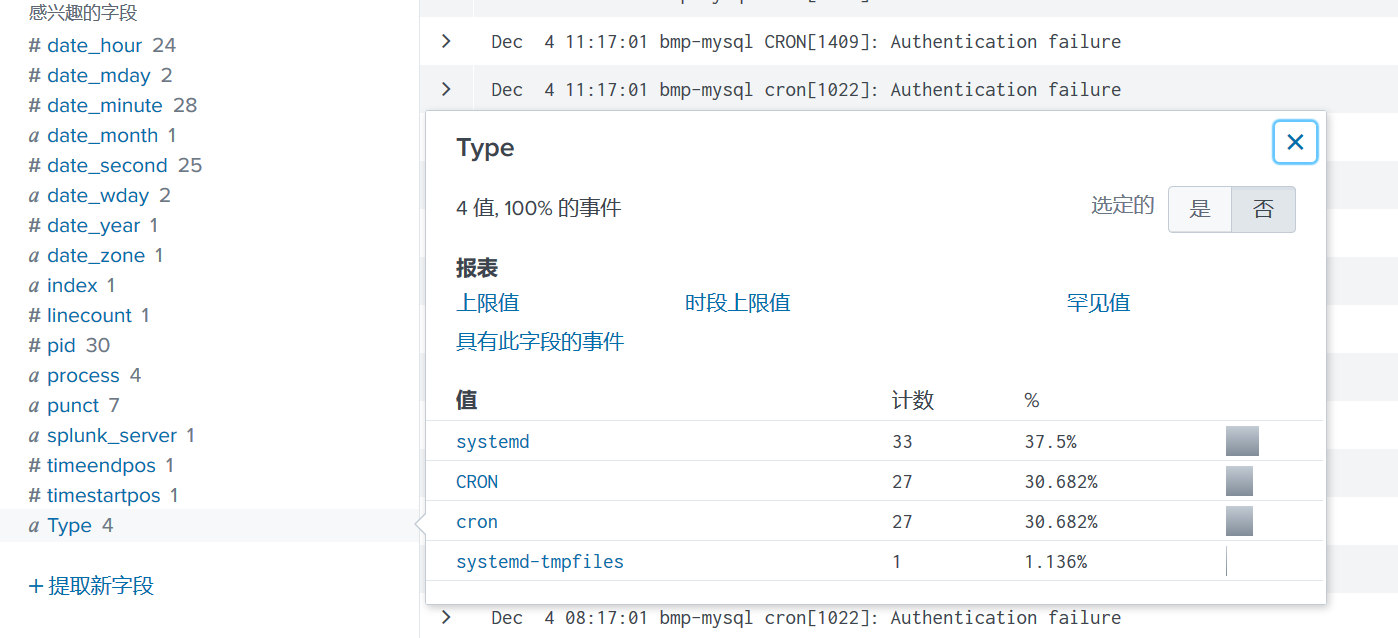
有些时候Splunk可能无法自动识别列,我们可以自定义规则来提取列
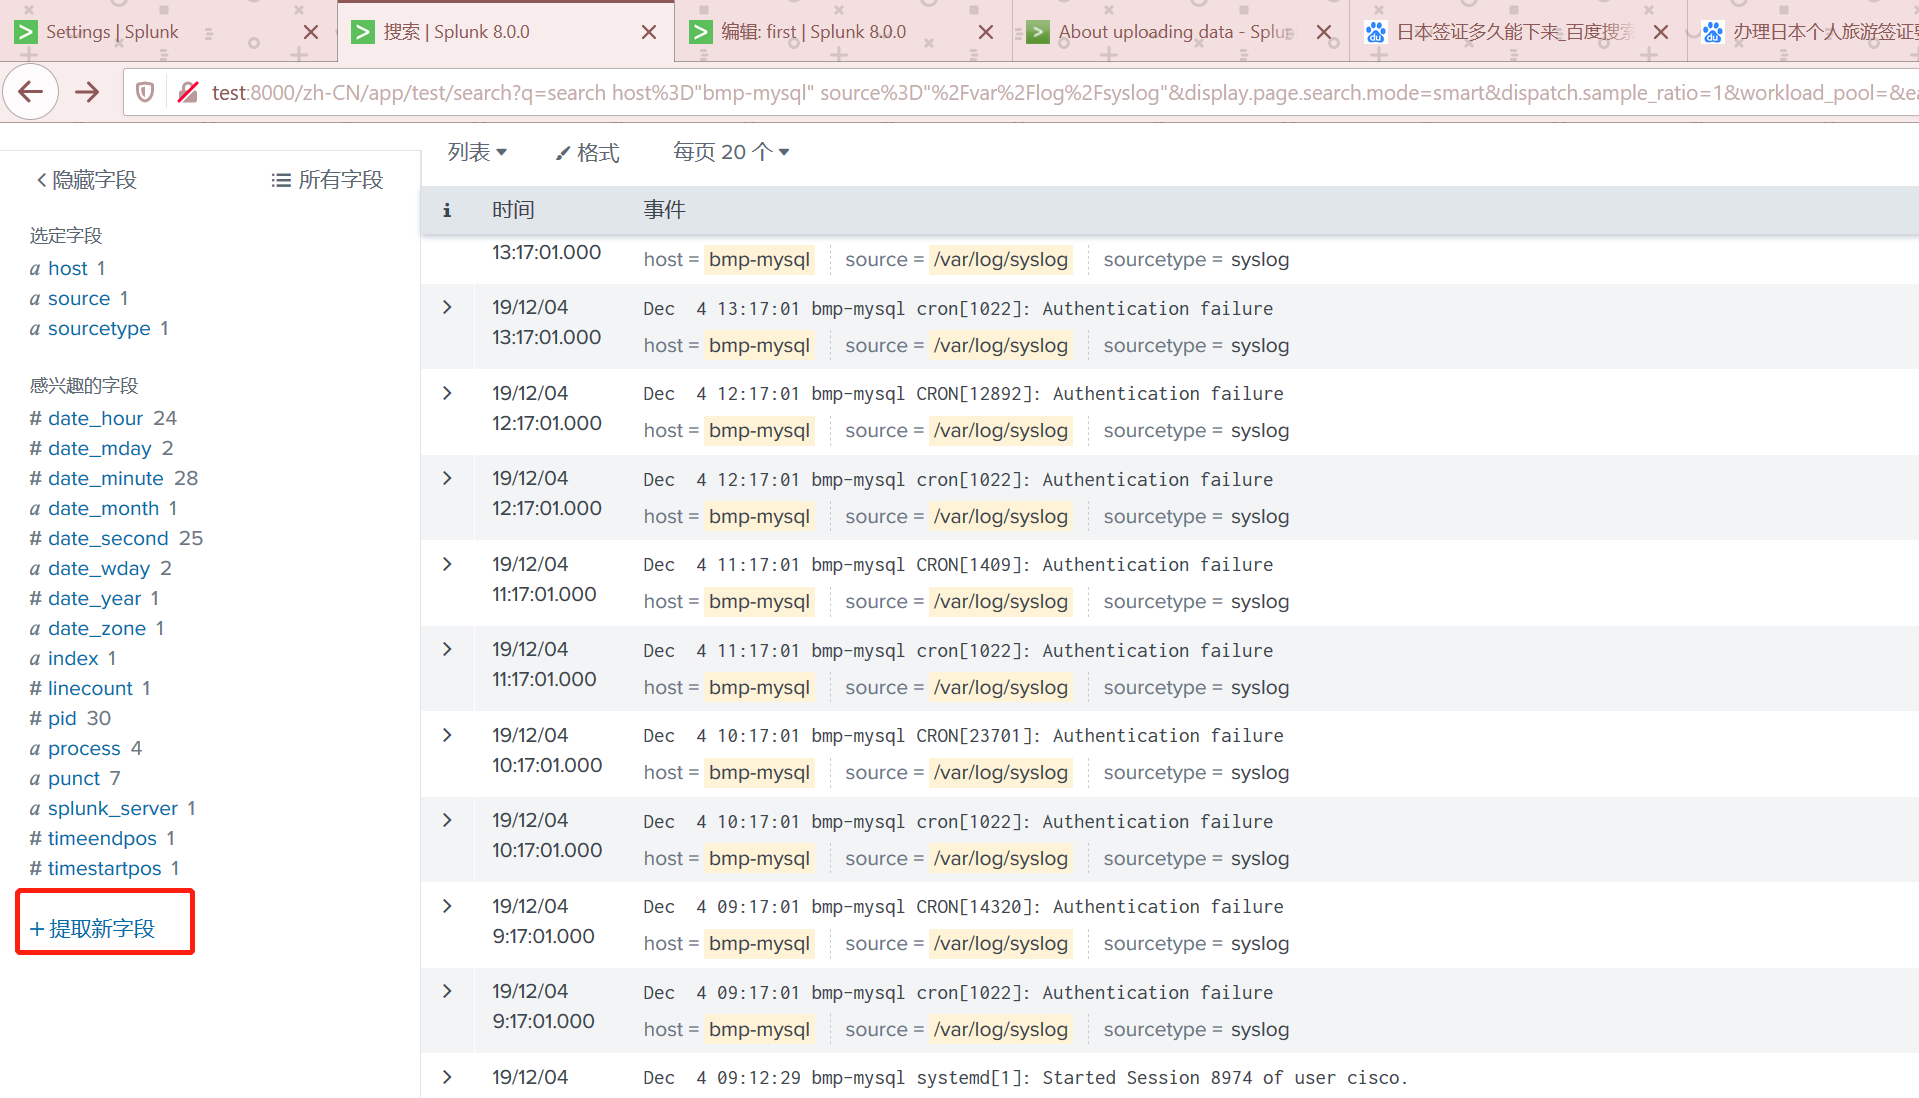
我自定义一个log type的列,提取log中标识当前属于什么log的位置。这样我们就可以对这个系统的log进行分析。
查询语句
Splunk将数据导入后,通过SPL将数据查询出来,然后通过可视化工具进行显示。
SPL 与 SQL对照
访问:https://docs.splunk.com/Documentation/Splunk/8.0.0/SearchReference/SQLtoSplunk
| SQL command | SQL example | Splunk SPL example | 备注 |
|---|---|---|---|
| SELECT * | SELECT * FROM mytable |
source=mytable |
source就相当于table |
| WHERE | SELECT * FROM mytable WHERE mycolumn=5 |
source=mytable mycolumn=5 |
|
| SELECT | SELECT mycolumn1, mycolumn2 FROM mytable |
`source=mytable | FIELDS mycolumn1, mycolumn2 ` |
| AND/OR | SELECT * FROM mytable WHERE (mycolumn1="true" OR mycolumn2="red") AND mycolumn3="blue" |
source=mytable AND (mycolumn1="true" OR mycolumn2="red") AND mycolumn3="blue" |
|
| AS (alias) | SELECT mycolumn AS column_alias FROM mytable |
`source=mytable | RENAME mycolumn as column_alias |
| BETWEEN | SELECT * FROM mytable WHERE mycolumn BETWEEN 1 AND 5 |
source=mytable mycolumn>=1 mycolumn<=5 |
|
| GROUP BY | SELECT mycolumn, avg(mycolumn) FROM mytable WHERE mycolumn=value GROUP BY mycolumn |
`source=mytable mycolumn=value | STATS avg(mycolumn) BY mycolumn |
| LEFT (OUTER) JOIN | SELECT * FROM mytable1 LEFT JOIN mytable2 ON mytable1.mycolumn= mytable2.mycolumn |
`source=mytable1 | JOIN type=left mycolumn [SEARCH source=mytable2] ` |
| TRUNCATE TABLE | TRUNCATE TABLE mytable |
`source=mytable | DELETE ` |
| UNION | SELECT mycolumn FROM mytable1 UNION SELECT mycolumn FROM mytable2 |
`source=mytable1 | APPEND [SEARCH source=mytable2] |
| UNION ALL | SELECT * FROM mytable1 UNION ALL SELECT * FROM mytable2 |
`source=mytable1 | APPEND [SEARCH source=mytable2] ` |
命令查找
https://docs.splunk.com/Documentation/Splunk/6.6.0/SearchReference/Abstract
accum
累计求和
host="bmp-mysql" source="splunk_kane_test.csv"| accum age as test | table test,age
| [test](http://test:8000/zh-CN/app/test/search?q=search host%3D"bmp-mysql" source%3D"splunk_kane_test.csv"| accum age as test | table test%2Cage&display.page.search.mode=smart&dispatch.sample_ratio=1&workload_pool=&earliest=-24h%40h&latest=now&display.prefs.events.count=50&display.events.type=list&display.page.search.tab=statistics&display.general.type=statistics&display.prefs.statistics.count=50&sid=1575270504.1260#) | [age](http://test:8000/zh-CN/app/test/search?q=search host%3D"bmp-mysql" source%3D"splunk_kane_test.csv"| accum age as test | table test%2Cage&display.page.search.mode=smart&dispatch.sample_ratio=1&workload_pool=&earliest=-24h%40h&latest=now&display.prefs.events.count=50&display.events.type=list&display.page.search.tab=statistics&display.general.type=statistics&display.prefs.statistics.count=50&sid=1575270504.1260#) |
|---|---|
| 20(20) | 20 |
| 50(20+30) | 30 |
| 81(20+30+31)(51+31) | 31 |
addcoltotals
增加单列求和
host="bmp-mysql" source="splunk_kane_test.csv"| addcoltotals age sex|table _time,age
会在age,sex两列的最下面增加总数的计算。589、11都是整列的求和,没写的列不会求和
| [_time](http://test:8000/zh-CN/app/test/search?q=search host%3D"bmp-mysql" source%3D"splunk_kane_test.csv"| addcoltotals age sex|table _time%2Cage%2Csex&display.page.search.mode=smart&dispatch.sample_ratio=1&workload_pool=&earliest=-24h%40h&latest=now&display.prefs.events.count=50&display.events.type=list&display.page.search.tab=statistics&display.general.type=statistics&display.prefs.statistics.count=100&sid=1575270911.1266#) | [age](http://test:8000/zh-CN/app/test/search?q=search host%3D"bmp-mysql" source%3D"splunk_kane_test.csv"| addcoltotals age sex|table _time%2Cage%2Csex&display.page.search.mode=smart&dispatch.sample_ratio=1&workload_pool=&earliest=-24h%40h&latest=now&display.prefs.events.count=50&display.events.type=list&display.page.search.tab=statistics&display.general.type=statistics&display.prefs.statistics.count=100&sid=1575270911.1266#) | [sex](http://test:8000/zh-CN/app/test/search?q=search host%3D"bmp-mysql" source%3D"splunk_kane_test.csv"| addcoltotals age sex|table _time%2Cage%2Csex&display.page.search.mode=smart&dispatch.sample_ratio=1&workload_pool=&earliest=-24h%40h&latest=now&display.prefs.events.count=50&display.events.type=list&display.page.search.tab=statistics&display.general.type=statistics&display.prefs.statistics.count=100&sid=1575270911.1266#) |
|---|---|---|
| 2019/12/02 10:48:21 | 25 | 1 |
| 2019/12/02 10:48:21 | ... | |
| 589 | 11## |
addtotals
对列、行求和
host="bmp-mysql" source="splunk_kane_test.csv"|table Name age sex| addtotals  fieldname="Row Totals" col=true labelfield=Name label=Total
# fieldname是对行求和新加的列
# col = true意思是队列求和 false就不求和了
# labelfield对列求和刨除的列,相应的求和的标签也会放在这一列的下面
# label对列求和的标签
| [Name](http://test:8000/zh-CN/app/test/search?q=search host%3D"bmp-mysql" source%3D"splunk_kane_test.csv"|table Name age sex| addtotals fieldname%3D"Row Totals" col%3Dtrue labelfield%3DName label%3DTotal&display.page.search.mode=smart&dispatch.sample_ratio=1&workload_pool=&earliest=-24h%40h&latest=now&display.prefs.events.count=50&display.events.type=list&display.page.search.tab=statistics&display.general.type=statistics&display.prefs.statistics.count=100&sid=1575272391.1292#) | [age](http://test:8000/zh-CN/app/test/search?q=search host%3D"bmp-mysql" source%3D"splunk_kane_test.csv"|table Name age sex| addtotals fieldname%3D"Row Totals" col%3Dtrue labelfield%3DName label%3DTotal&display.page.search.mode=smart&dispatch.sample_ratio=1&workload_pool=&earliest=-24h%40h&latest=now&display.prefs.events.count=50&display.events.type=list&display.page.search.tab=statistics&display.general.type=statistics&display.prefs.statistics.count=100&sid=1575272391.1292#) | [sex](http://test:8000/zh-CN/app/test/search?q=search host%3D"bmp-mysql" source%3D"splunk_kane_test.csv"|table Name age sex| addtotals fieldname%3D"Row Totals" col%3Dtrue labelfield%3DName label%3DTotal&display.page.search.mode=smart&dispatch.sample_ratio=1&workload_pool=&earliest=-24h%40h&latest=now&display.prefs.events.count=50&display.events.type=list&display.page.search.tab=statistics&display.general.type=statistics&display.prefs.statistics.count=100&sid=1575272391.1292#) | [Row Totals](http://test:8000/zh-CN/app/test/search?q=search host%3D"bmp-mysql" source%3D"splunk_kane_test.csv"|table Name age sex| addtotals fieldname%3D"Row Totals" col%3Dtrue labelfield%3DName label%3DTotal&display.page.search.mode=smart&dispatch.sample_ratio=1&workload_pool=&earliest=-24h%40h&latest=now&display.prefs.events.count=50&display.events.type=list&display.page.search.tab=statistics&display.general.type=statistics&display.prefs.statistics.count=100&sid=1575272391.1292#) |
|---|---|---|---|
| name22 | 20 | 1 | 21 |
| ... | ... | ... | ... |
| Total | 589 | 11 | 600 |
stats
对数据进行分组
host="bmp-mysql" source="splunk_kane_test.csv"|table Name age sex| stats avg(age)  as avg_age by sex
#通过sex对age进行分区,并取平均值
| [sex](http://test:8000/zh-CN/app/test/search?q=search host%3D"bmp-mysql" source%3D"splunk_kane_test.csv"|table Name age sex| stats avg(age) as avg_age by sex&display.page.search.mode=smart&dispatch.sample_ratio=1&workload_pool=&earliest=-24h%40h&latest=now&display.prefs.events.count=50&display.events.type=list&display.page.search.tab=statistics&display.general.type=statistics&display.prefs.statistics.count=100&sid=1575272991.1301#) | [avg_age](http://test:8000/zh-CN/app/test/search?q=search host%3D"bmp-mysql" source%3D"splunk_kane_test.csv"|table Name age sex| stats avg(age) as avg_age by sex&display.page.search.mode=smart&dispatch.sample_ratio=1&workload_pool=&earliest=-24h%40h&latest=now&display.prefs.events.count=50&display.events.type=list&display.page.search.tab=statistics&display.general.type=statistics&display.prefs.statistics.count=100&sid=1575272991.1301#) |
|---|---|
| 0 | 26.545454545454547 |
| 1 | 27 |
关于stats中可以使用的方法
| Type of function | Supported functions and syntax | |||
|---|---|---|---|---|
| Aggregate functions | avg() count() distinct_count() estdc() estdc_error() |
exactperc() max() median() min() mode() |
perc() range() stdev() stdevp() |
sum() sumsq() upperperc() var() varp() |
| Event order functions | first() |
last() |
||
| Multivalue stats and chart functions | list() |
values() |
||
| Time functions | earliest() earliest_time() |
latest() latest_time() |
rate() |
eval
通过表达式进行一些计算
host="bmp-mysql" source="splunk_kane_test.csv"|table Name age sex| eval test=age+sex |table test,age
# 算age与sex的合,给新的列test。最终将test列结果输出出来
| [test](http://test:8000/zh-CN/app/test/search?q=search host%3D"bmp-mysql" source%3D"splunk_kane_test.csv"|table Name age sex| eval test%3Dage%2Bsex |table test%2Cage%2Csex&display.page.search.mode=smart&dispatch.sample_ratio=1&workload_pool=&earliest=-24h%40h&latest=now&display.prefs.events.count=50&display.events.type=list&display.page.search.tab=statistics&display.general.type=statistics&display.prefs.statistics.count=100&sid=1575273199.1304#) | [age](http://test:8000/zh-CN/app/test/search?q=search host%3D"bmp-mysql" source%3D"splunk_kane_test.csv"|table Name age sex| eval test%3Dage%2Bsex |table test%2Cage%2Csex&display.page.search.mode=smart&dispatch.sample_ratio=1&workload_pool=&earliest=-24h%40h&latest=now&display.prefs.events.count=50&display.events.type=list&display.page.search.tab=statistics&display.general.type=statistics&display.prefs.statistics.count=100&sid=1575273199.1304#) | [sex](http://test:8000/zh-CN/app/test/search?q=search host%3D"bmp-mysql" source%3D"splunk_kane_test.csv"|table Name age sex| eval test%3Dage%2Bsex |table test%2Cage%2Csex&display.page.search.mode=smart&dispatch.sample_ratio=1&workload_pool=&earliest=-24h%40h&latest=now&display.prefs.events.count=50&display.events.type=list&display.page.search.tab=statistics&display.general.type=statistics&display.prefs.statistics.count=100&sid=1575273199.1304#) |
|---|---|---|
| 25 | 25 | 0 |
| 26 | 25 | 1 |
| 29 | 29 | 0 |
| 31 | 30 | 1 |
eval可以用if case 很多函数,参照https://docs.splunk.com/Documentation/Splunk/8.0.0/SearchReference/Eval#Functions
关于if的例子
host="bmp-mysql" source="splunk_kane_test.csv"|table Name age sex| eval test=if(sex=="1","男","女") |table test,age,sex
head
限制结果的数量
host="bmp-mysql" source="splunk_kane_test.csv"|table Name age sex| eval test=if(sex=="1","男","女") |table test,age,sex|head 1
# 只显示第一行了
timechart
新建时间序列图表,这个查询会默认添加上_time这一列
host="bmp-mysql" source="splunk_kane_test.csv"|timechart avg(age) by sex
# 这个要表达的意思是 统计每种性别的平均年龄,并且统计每个时间段的
| [_time](http://test:8000/zh-CN/app/test/search?q=search host%3D"bmp-mysql" source%3D"splunk_kane_test.csv"|timechart avg(age) by sex&display.page.search.mode=smart&dispatch.sample_ratio=1&workload_pool=&earliest=-24h%40h&latest=now&display.prefs.events.count=50&display.events.type=list&display.page.search.tab=statistics&display.general.type=statistics&display.prefs.statistics.count=100&sid=1575273704.1317#) | [0](http://test:8000/zh-CN/app/test/search?q=search host%3D"bmp-mysql" source%3D"splunk_kane_test.csv"|timechart avg(age) by sex&display.page.search.mode=smart&dispatch.sample_ratio=1&workload_pool=&earliest=-24h%40h&latest=now&display.prefs.events.count=50&display.events.type=list&display.page.search.tab=statistics&display.general.type=statistics&display.prefs.statistics.count=100&sid=1575273704.1317#) | [1](http://test:8000/zh-CN/app/test/search?q=search host%3D"bmp-mysql" source%3D"splunk_kane_test.csv"|timechart avg(age) by sex&display.page.search.mode=smart&dispatch.sample_ratio=1&workload_pool=&earliest=-24h%40h&latest=now&display.prefs.events.count=50&display.events.type=list&display.page.search.tab=statistics&display.general.type=statistics&display.prefs.statistics.count=100&sid=1575273704.1317#) |
|---|---|---|
| 2019/12/01 16:00:00 | ||
| 2019/12/02 10:30:00 | 26.545454545454547 | 27 |
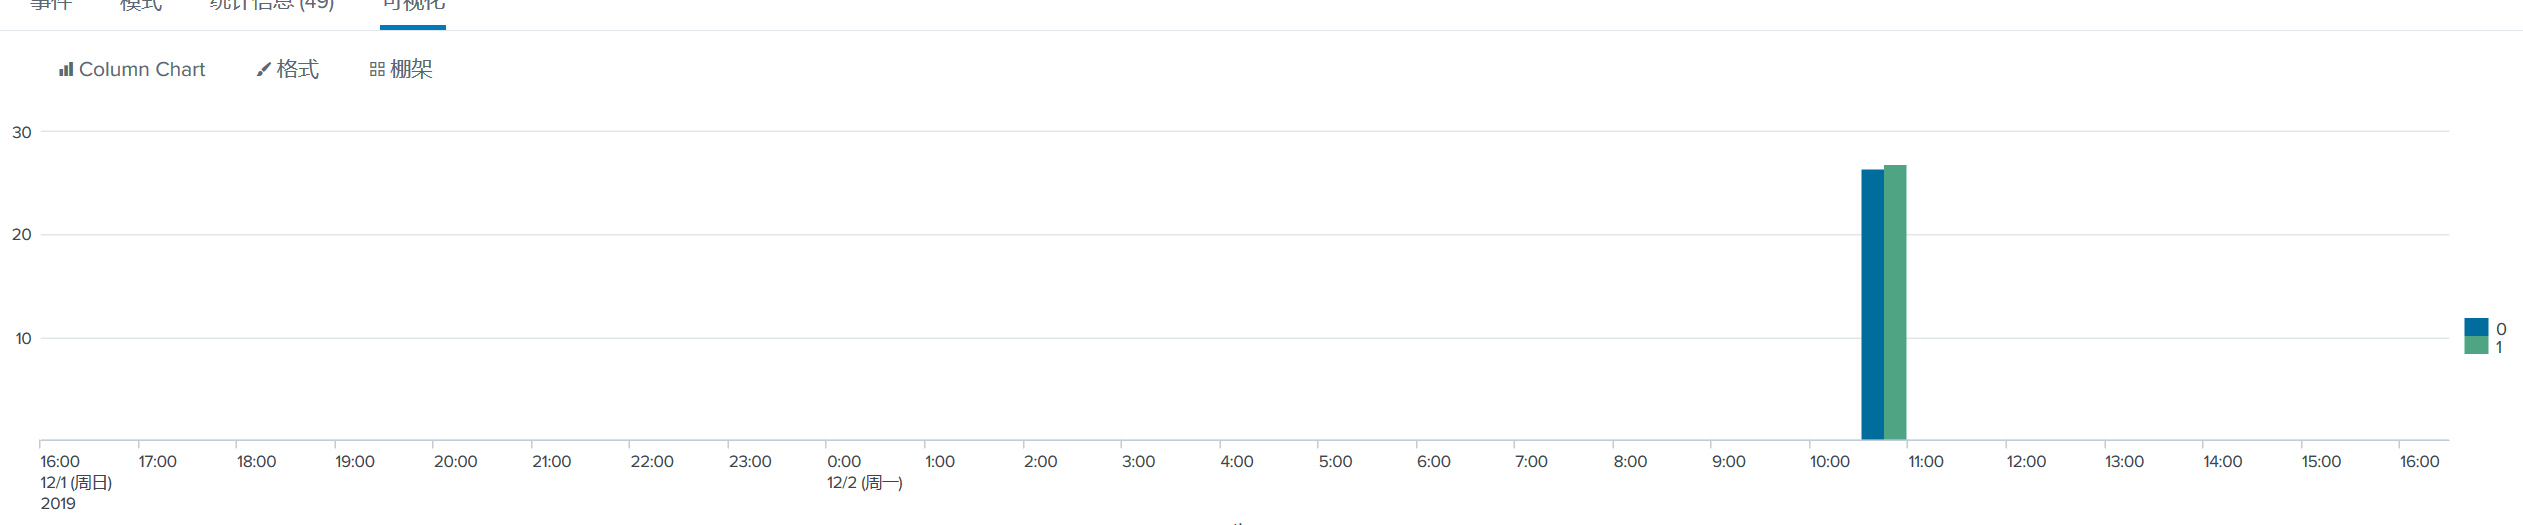
会出一个这样的图。如果每个时间段都有数据进来的话,就会统计每个时间段内进来的数据,按照性别区分的平均年龄
chart
制作图表,这个不带有时间,直接通过sex计算平均值
host="bmp-mysql" source="splunk_kane_test.csv"|chart avg(age) by sex
sort
对字段排序,可多字段
host="bmp-mysql" source="splunk_kane_test.csv"|chart avg(age) by sex | sort - sex
# sex 倒序
dedup
对列去重
fields
列出列,不列出的列在结果中不显示
能够出可视化图表的命令
在Splunk中有一种类型的命令叫做transfroming command这些命令,可以出可视化的图表
addtotals,chart,cofilter,contingency,eventstats,history,makecontinuous,mvcombine,rare,stats,table,timechart,top,xyseries
# 常用的有
addtotals,chart,stats,table,timechart
关于仪表板面板
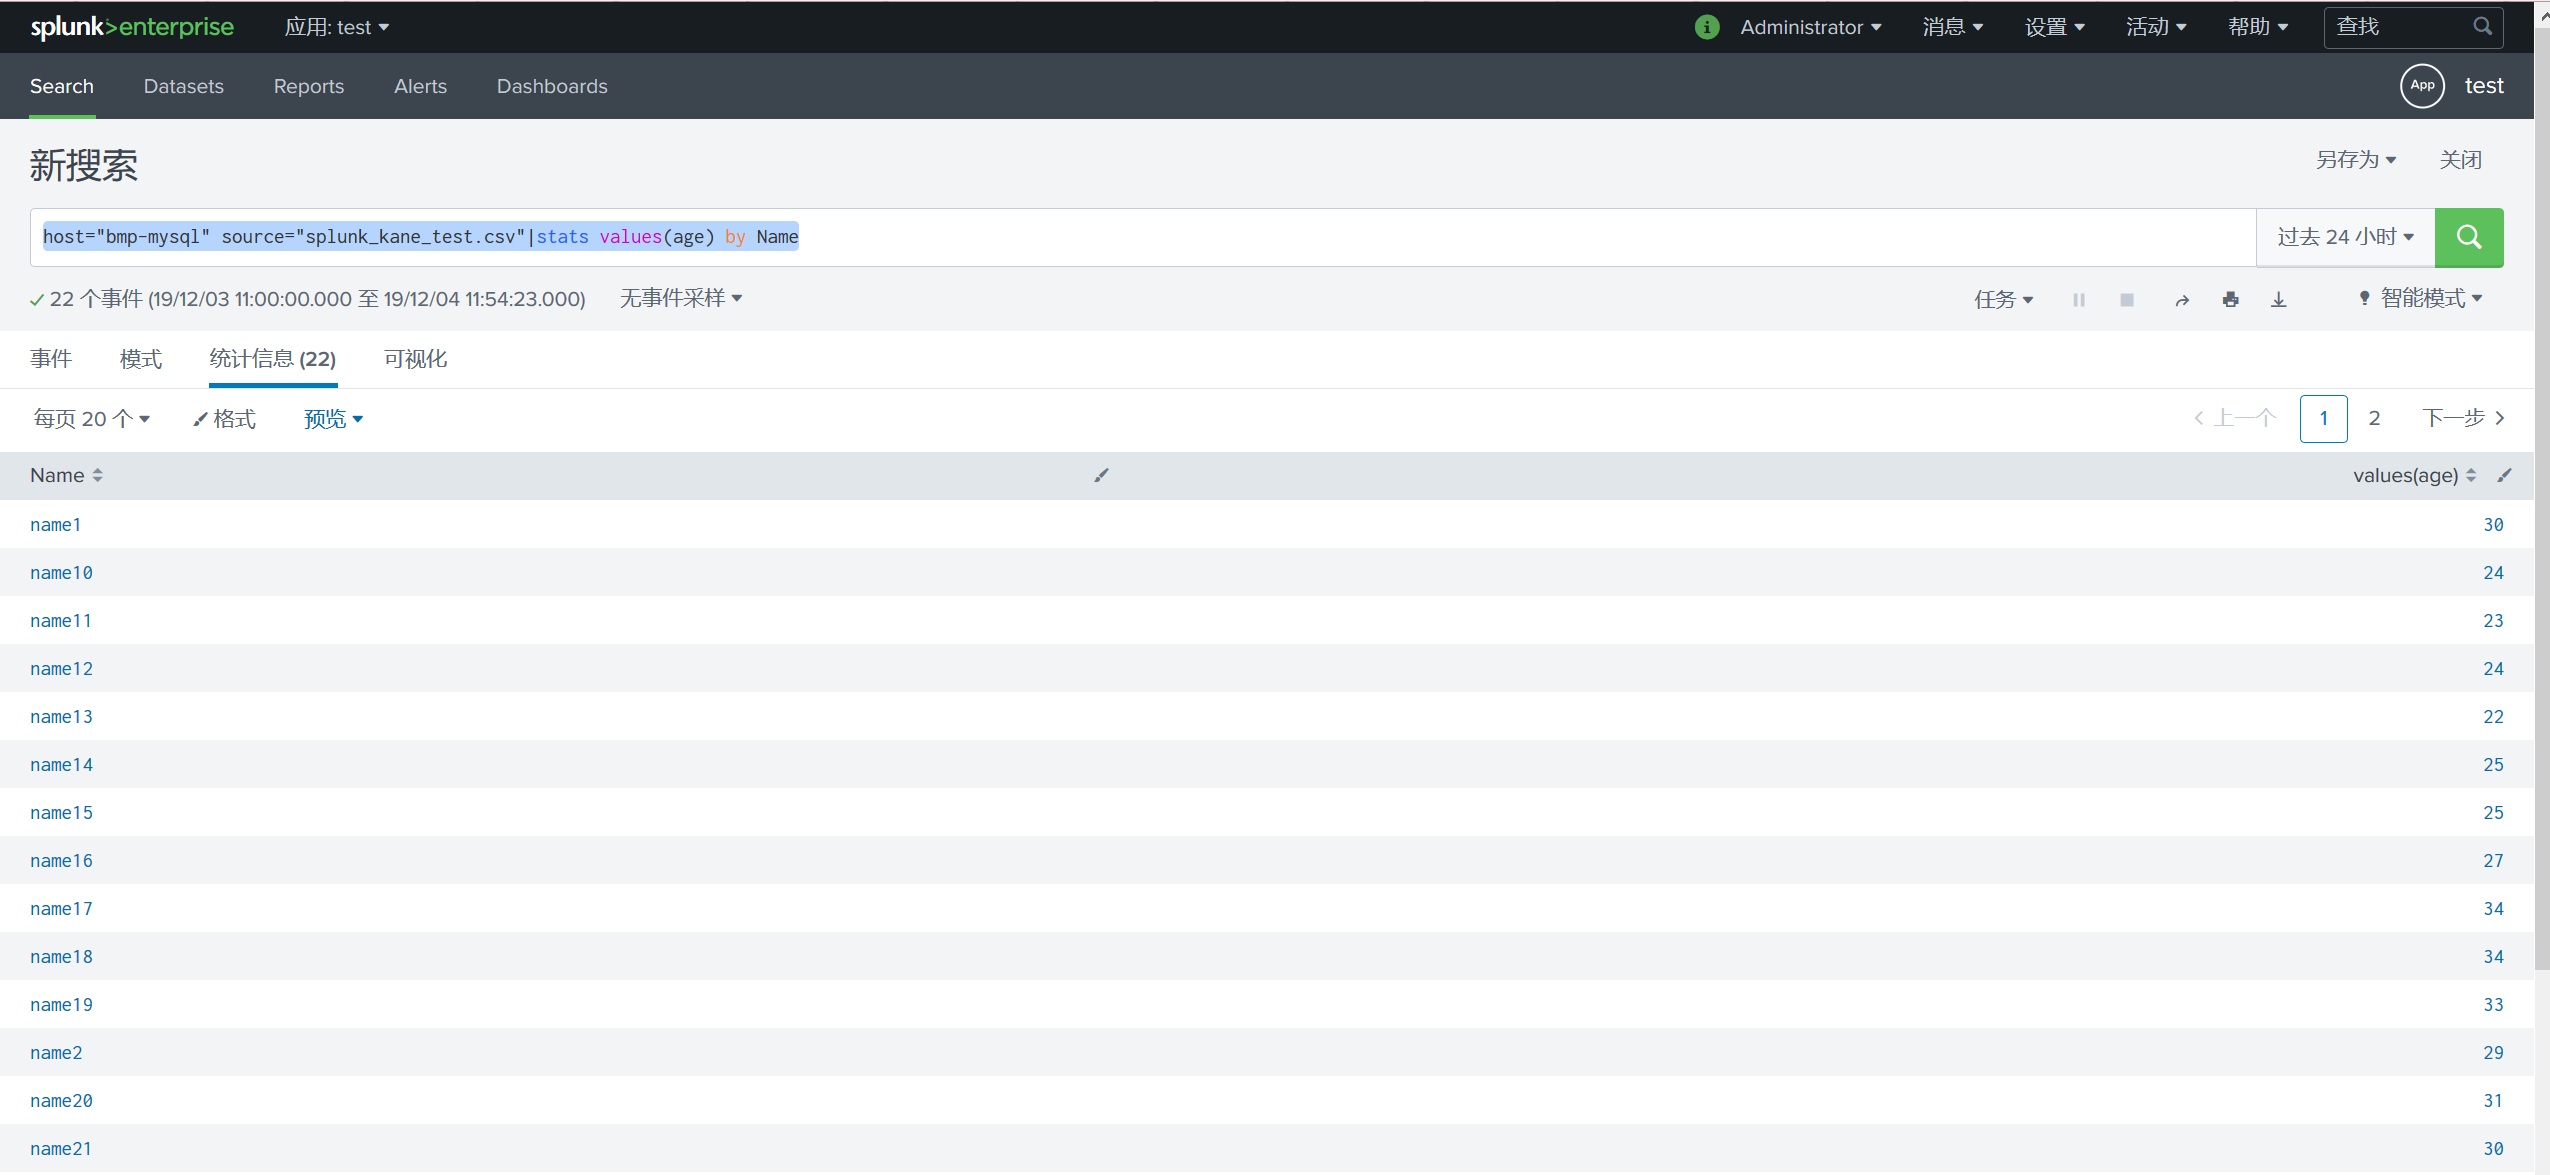
通过Search创建Dashboard
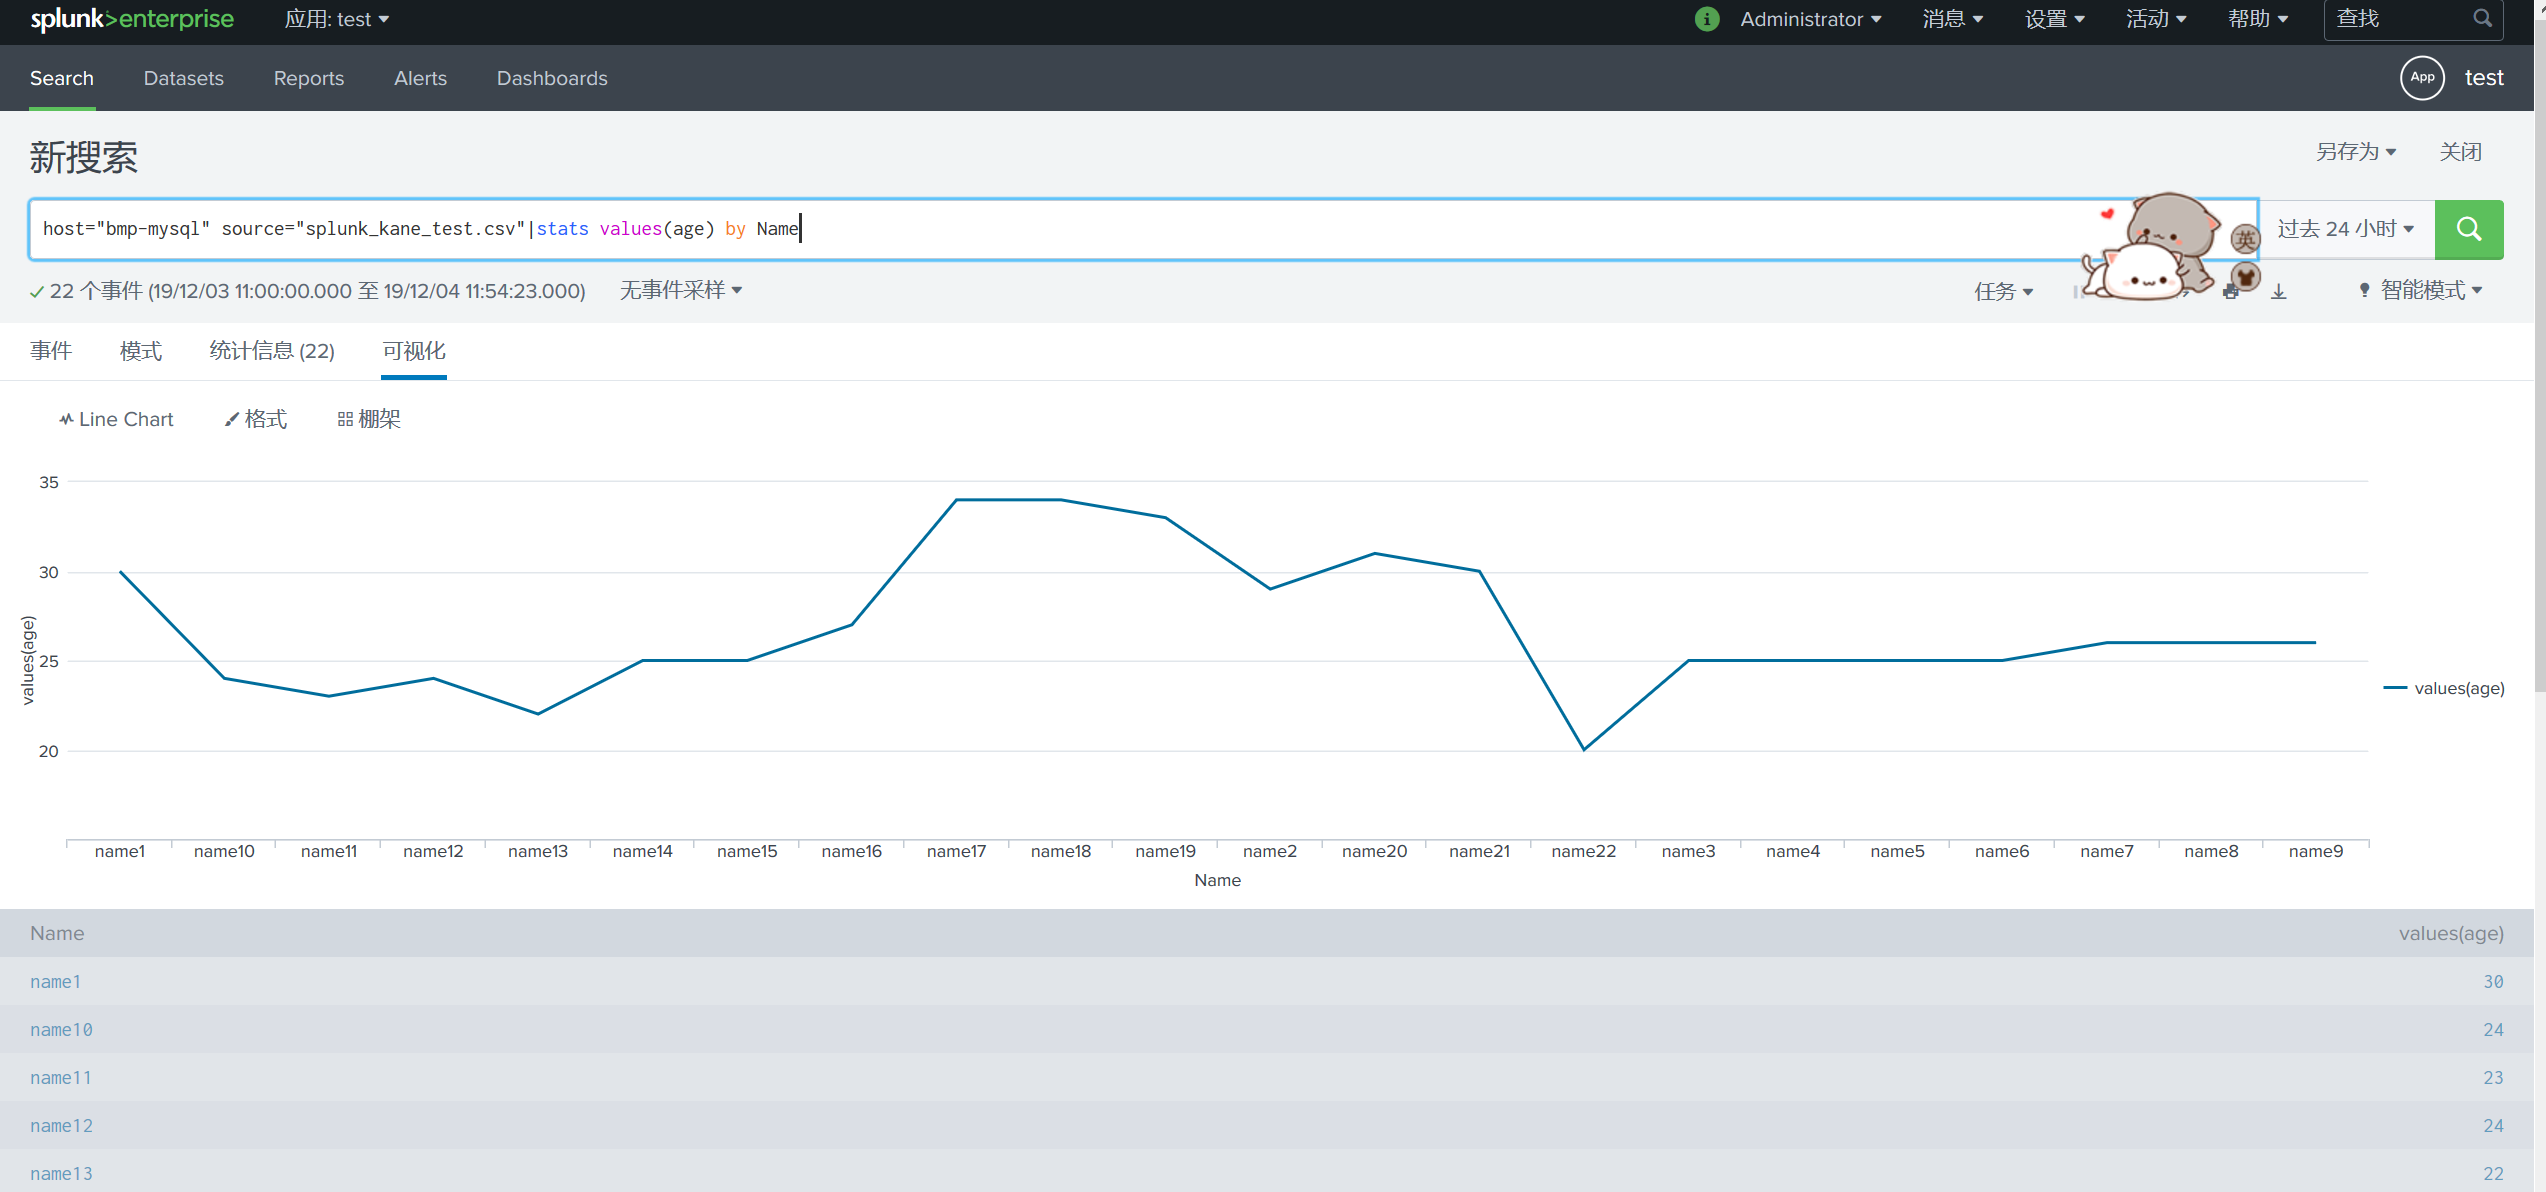
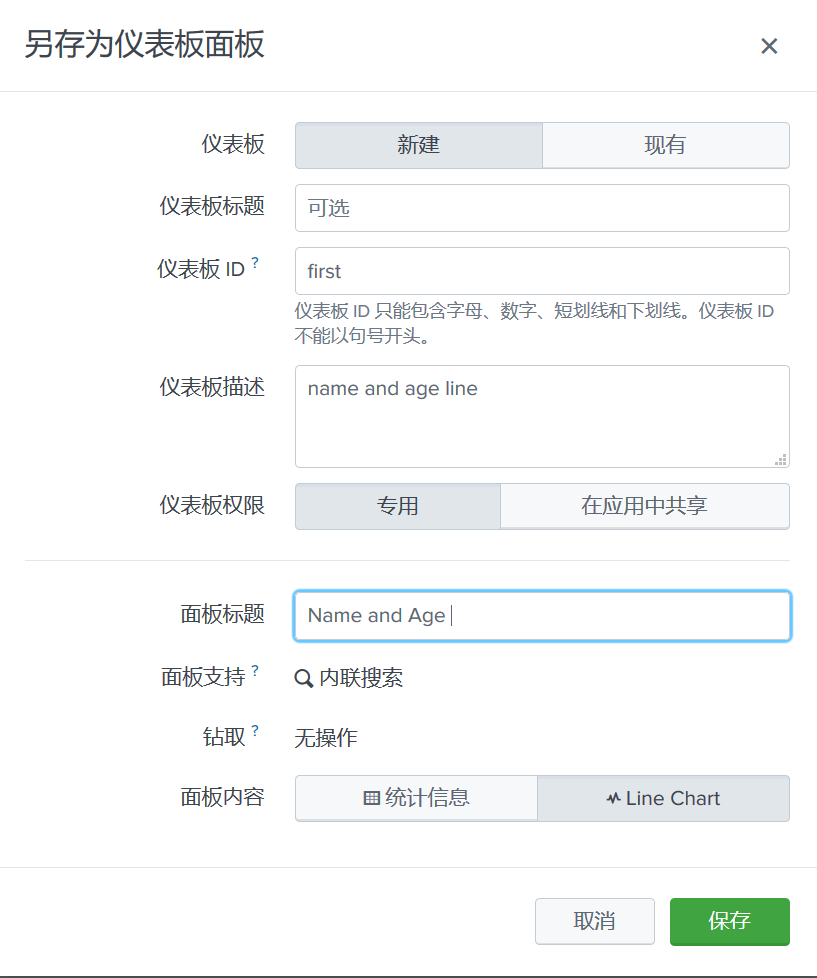
host="bmp-mysql" source="splunk_kane_test.csv"|stats values(age) by Name
统计信息
可视化图表,可切换图表的显示方式
另存为仪表板面板在右上角
查看仪表板
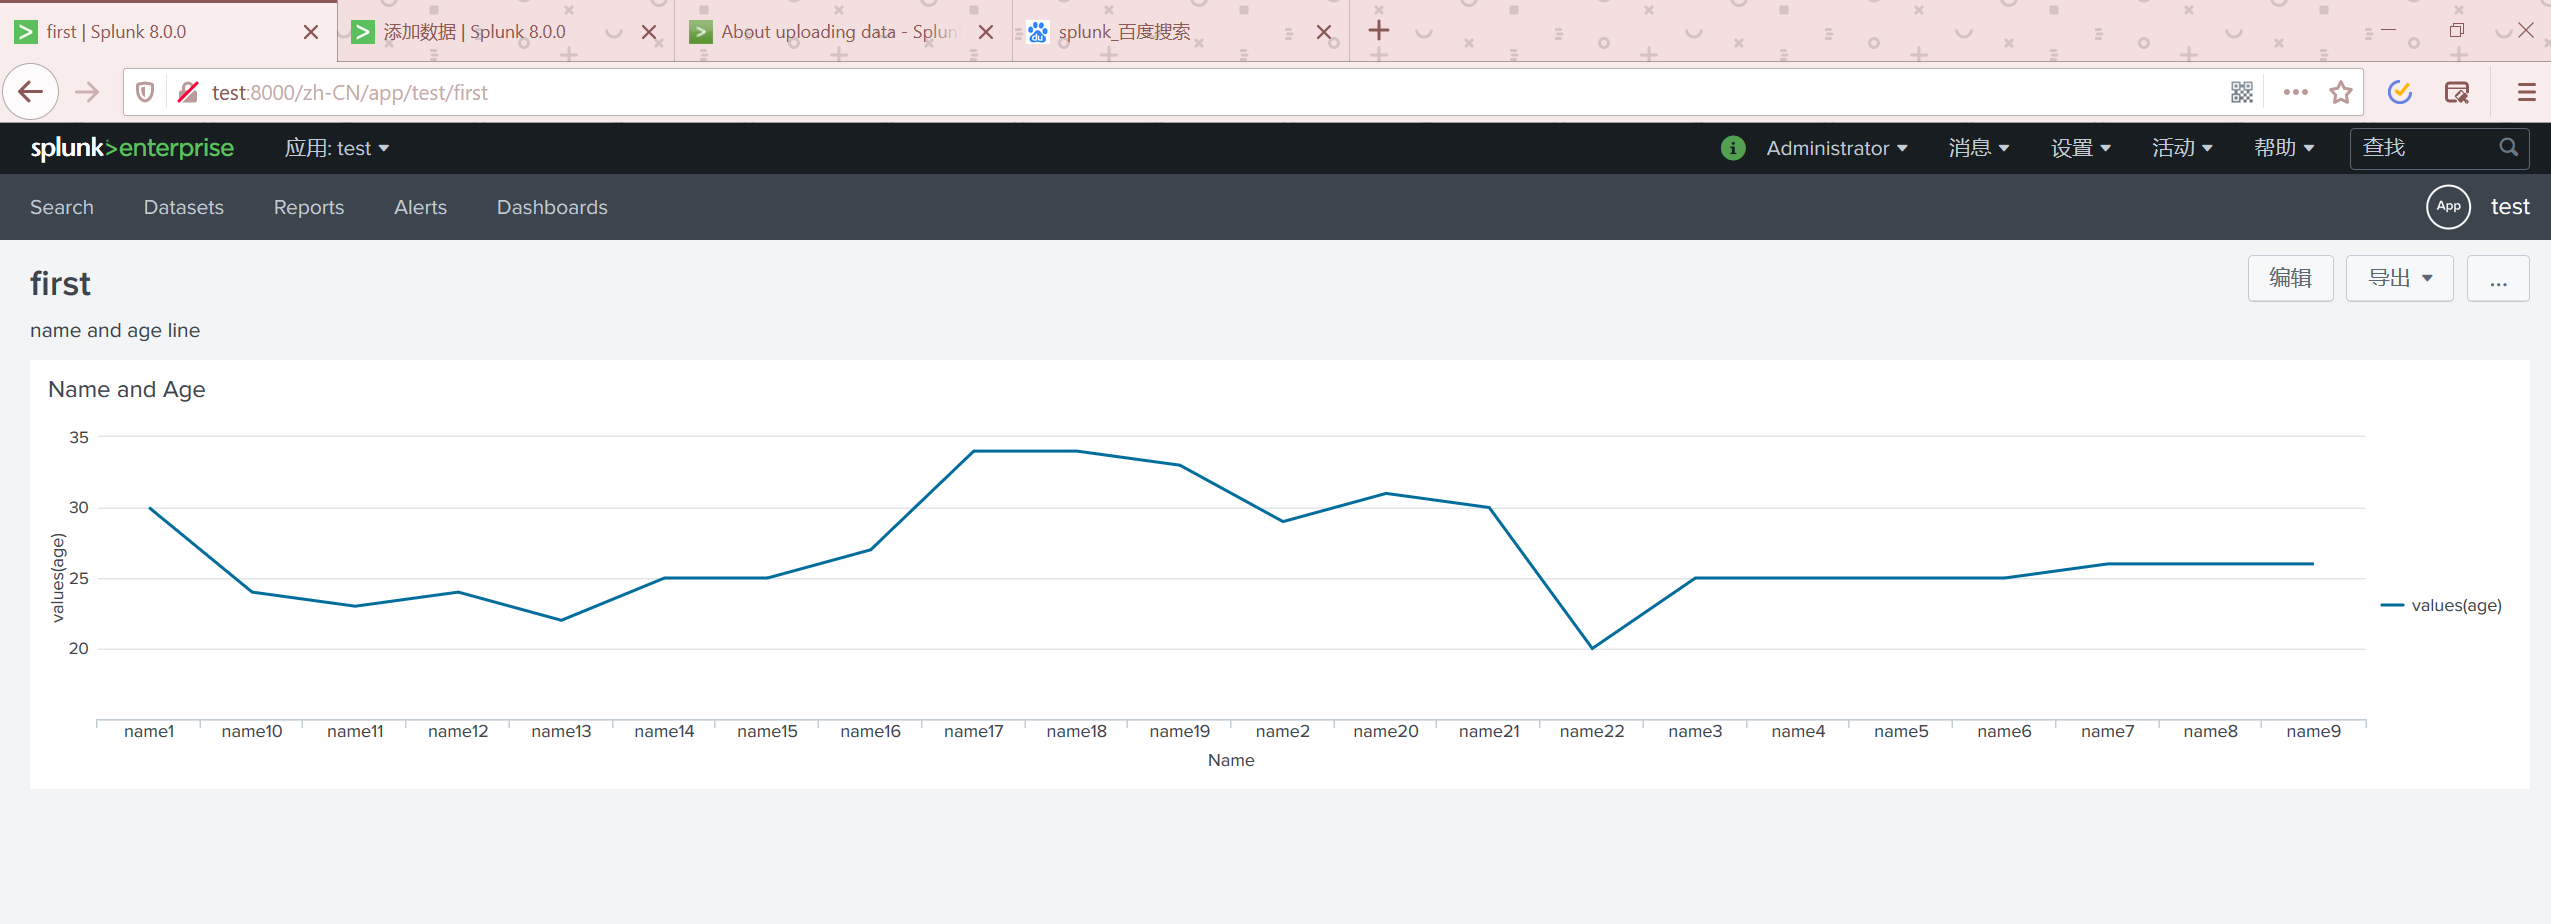
我们可以在编辑页面里面继续修改
配置仪表板的导航
设置(Settings) -----> 用户界面(User Interfaces) -----------> Navigation menus
选中自己的APP然后进行编辑下面的是默认的
<nav search_view="search">
  <view name="search" default='true' />
  <view name="datasets" />
  <view name="reports" />
  <view name="alerts" />
  <view name="dashboards" />
</nav>
使用自定义的JS 与CSS
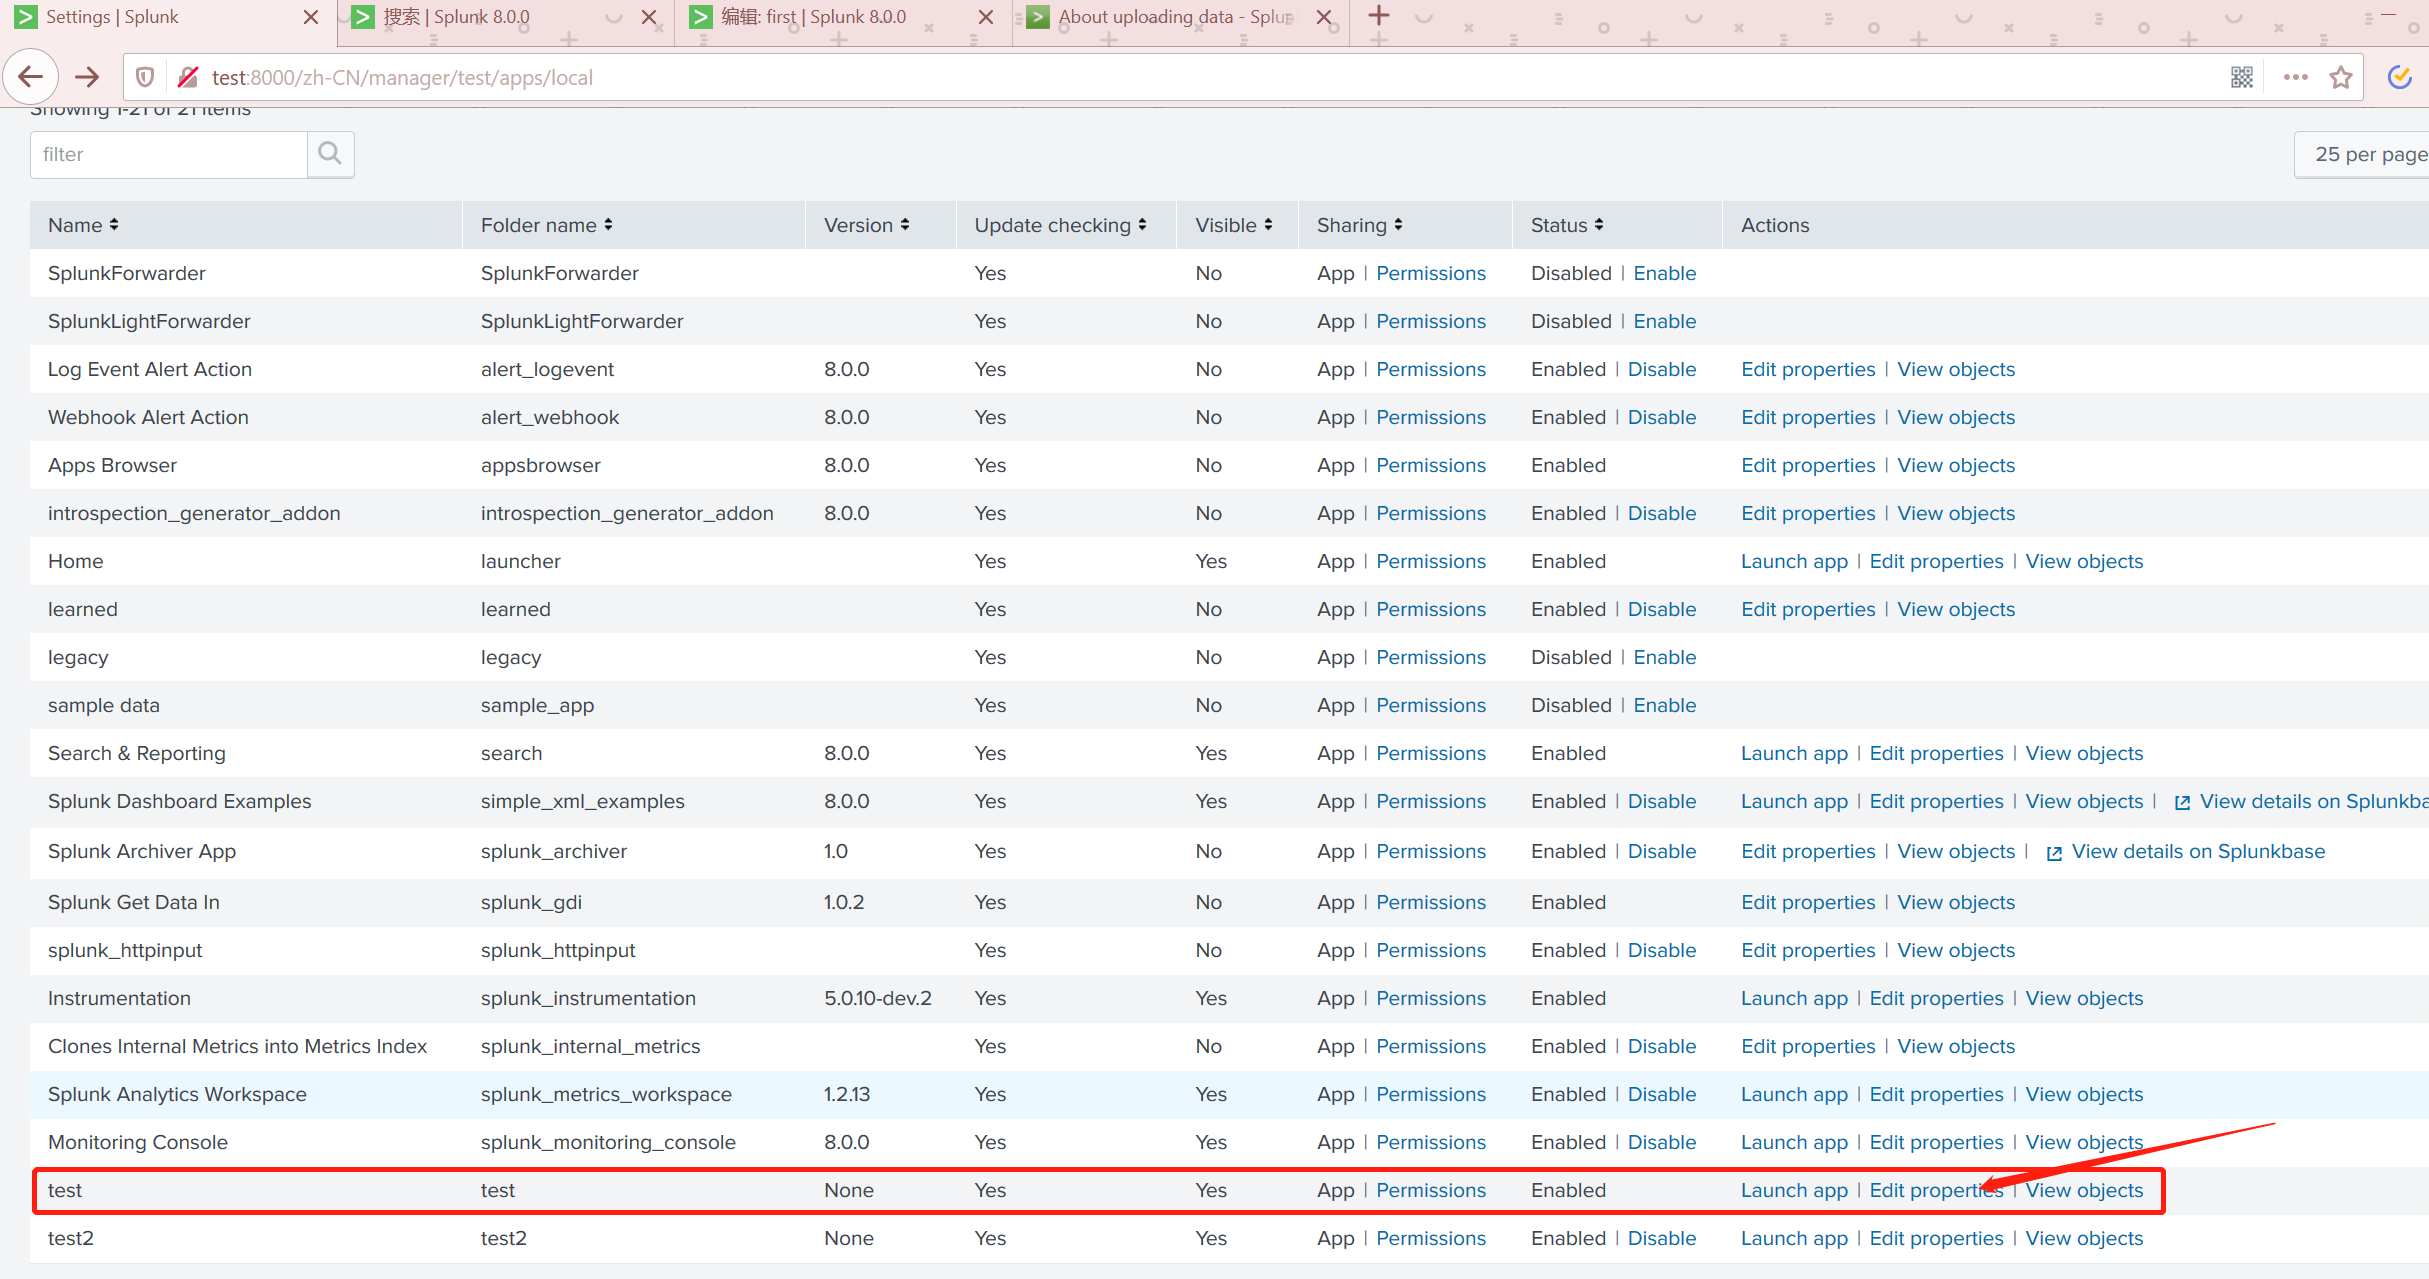
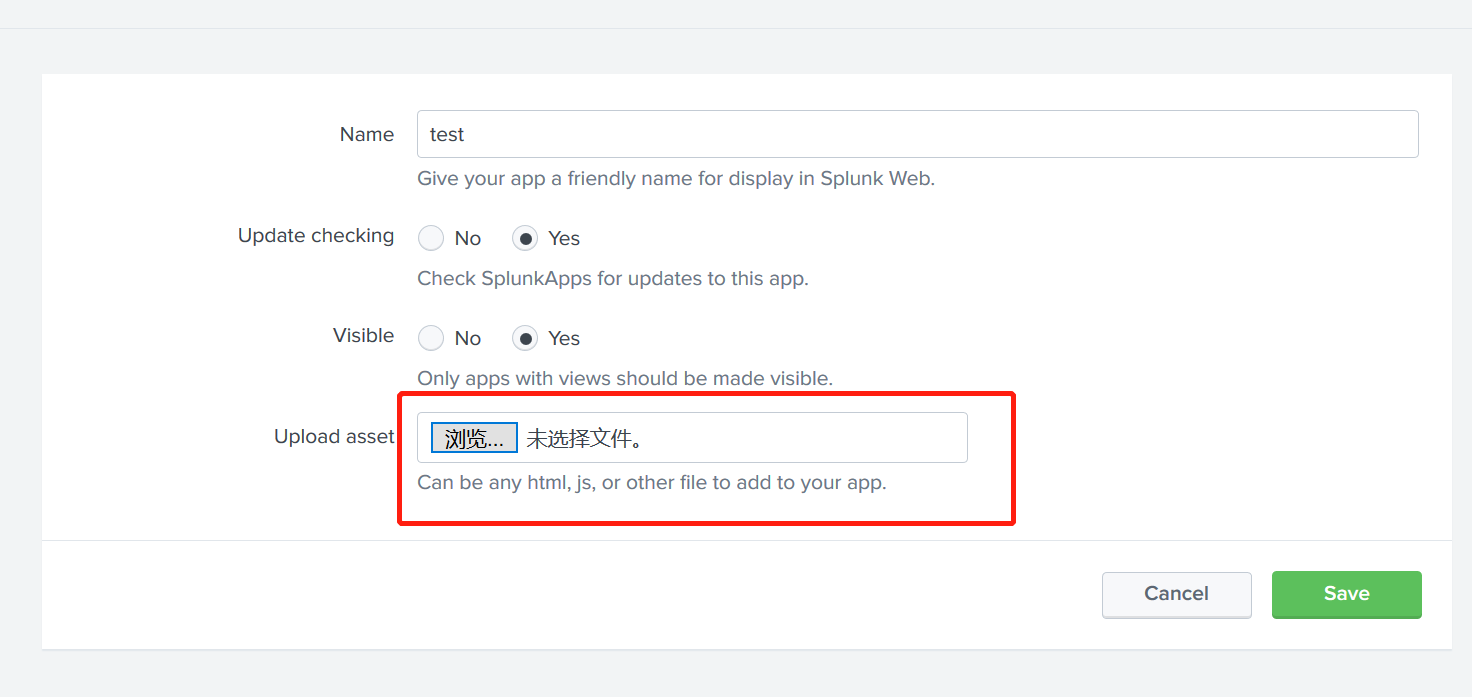
我们可以这样上传自己的自定义的文件,此操作会在服务器上当前APP的目录/splunk/splunk/etc/apps/test下创建/appserver/static并在这个文件夹下。

 浙公网安备 33010602011771号