9 Homomorphic Systems and Cepstrum Analysis of Speech|
10 Pitch and Voicing Determination of Speech with an Extension Toward Music Signals|
11 Formant Estimation and Tracking
9 Homomorphic Systems and Cepstrum Analysis of Speech
Definitions
Discrete-Time Model for Speech Production
The Cepstrum of Speech
Relation to LPC
Application to Pitch Detection
Application to Analysis/Synthesis Coding
Applications to Speech Pattern Recognition
Mel-Frequency Cepstrum Coefficients (MFCC)
The basic idea is to compute a frequency analysis based upon a filter bank with approximately critical band spacing of the filters and bandwidths. For 4 kHz bandwidth, approximately 20 filters are used.
A short-time Fourier analysis is done first, resulting in a DFT \(X_{m}[k]\) for the m-th frame.
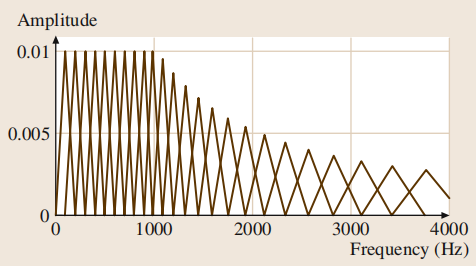
Then the DFT values are grouped together in critical bands and weighted by triangular weighting functions as depicted in Fig.

Note that the bandwidths are constant for center frequencies below 1 kHz and then increase exponentially up to half the sampling rate of 4 kHz, resulting in 24 filters.
The mel-spectrum of the m-th frame is defined for $r=1,2,...,R$ as
$$MF_{m}[r]=\frac{1}{A_{r}}\sum_{k=L_{r}}^{U_{r}}|V_{r}[k]X_{m}[k]|^2$$
where $V_{r}[k]$ is the weighting function for the r-th filter ranging from DFT index $L_{r}$ to $U_{r}$, and
$$A_{r}=\frac{1}{A_{r}}\sum_{k=L_{r}}^{U_{r}}|V_{r}[k]|^2$$
is a normalizing factor for the r-th mel-filter. This normalization is built into the weighting functions in Fig. It is needed so that a perfectly flat input Fourier spectrum will produce a flat mel-spectrum.
For each frame, a discrete cosine (DCT) transform of the log of the magnitude of the mel-filter outputs is computed to form the function mfccp[n] as in
$$mfcc[n]=\frac{1}{R}\sum_{r=1}^{R}log(MF_{m}[r])cos[\frac{2\pi}{R}(r+\frac{1}{2})n]$$


 浙公网安备 33010602011771号