[转]Comparing sFlow and NetFlow in a vSwitch
As virtualization shifts the network edge from top of rack switches to software virtual switches running on the hypervisors; visibility in the virtual switching layer is essential in order to provide network, server and storage management teams with the information needed to coordinate resources and ensure optimal performance.
The recent release of Citrix XenServer 6.0 provides an opportunity for a side-by-side comparison of sFlow and NetFlow monitoring technologies since both protocols are supported by the Open vSwitch that is now the default XenServer network stack.
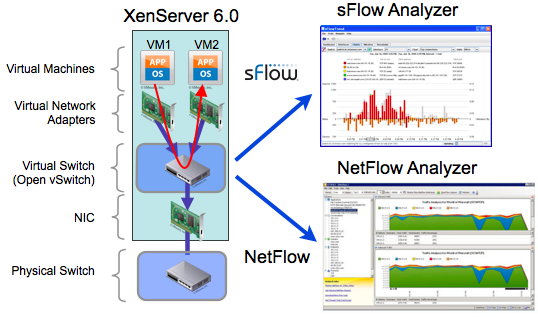
The diagram above shows the experimental setup. Traffic between the virtual machines VM1 and VM2 passes through the Virtual Switch where sFlow and NetFlow measurements are simultaneously generated. The sFlow is sent to an sFlow Analyzer (InMon sFlowTrend) and the NetFlow to a NetFlow Analyzer (SolarWinds Real-Time NetFlow Analyzer). Both tools are running in tandem making it is easy to perform side by side comparisons to see differences in the visibility that NetFlow and sFlow provide into the same underlying traffic.
Note: XenServer 6.0, sFlowTrend and Real-Time NetFlow Analyzer are all available at no charge, making it easy for anyone to reproduce these tests.
Configuration
The Host sFlow supplemental pack was installed to automate sFlow configuration of the Open vSwitch and to export standard sFlow Host metrics. The following /etc/hsflowd.conf file sets the packet sampling rate to 1-in-400, counter polling interval to 20 seconds and sends sFlow to sFlowTrend running on host 10.0.0.42 and listening on UDP port 6343.sflow{
DNSSD = off
polling = 20
sampling = 400
collector{
ip = 10.0.0.42
udpport = 6343
}
}
The following command was used to manually configure NetFlow monitoring, sending NetFlow to the Real-Time NetFlow Analyzer running on host 10.0.0.42 and listening on UDP port 2055:
ovs−vsctl −− set Bridge xenbr0 netflow=@nf \
−− −−id=@nf create NetFlow targets=\"10.0.0.42:2055\" active−timeout=60
Results
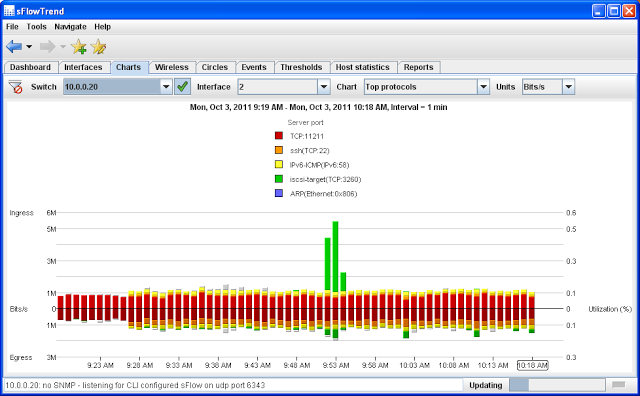
The following charts show the top protocols measured using sFlow and NetFlow:Top Protocols in sFlowTrend
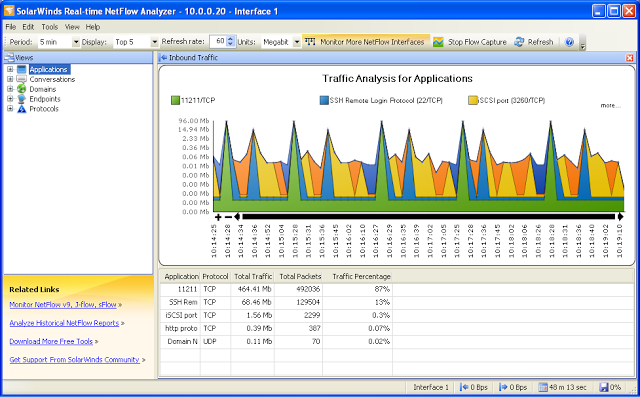
Top Protocols in Real-Time NetFlow Analyzer
Looking at the two charts, both show similar average traffic levels. The sFlowTrend chart shows the ingress Memcache (TCP:11211) traffic at between 0.7 and 0.9 Mb/s. Looking at the Real-time NetFlow Analyzer total traffic table, 464.41Mb were seen over the last 11 minutes 47 seconds, giving an average rate of 0.66 Mb/s. The sFlowTrend measurements are consistently higher since they include the bandwidth consumed by layer 2 headers whereas NetFlow only reports on layer 3 bytes. However, the layer 2 overhead can be estimated by assuming that an additional 18 bytes per packet (MAC source, MAC destination, type and CRC) and multiplying by the total packets count (492,036), resulting in an additional 0.1 Mb/s which brings the NetFlow measurement to 0.76Mb/s, putting it into agreement with the sFlow measurements.
Note: The overhead associated with Ethernet headers and tunneling protocols can represent a significant fraction of overall bandwidth. By exporting packet headers, sFlow provides detailed information on the encapsulations and their overhead. NetFlow does not provide a direct measure of total bandwidth.
The periodic, 60 second, spikes in traffic shown on the NetFlow Analyzer chart are an artifact of the way NetFlow reports on long running connections. With NetFlow, packet and byte counters are maintained for each connection in a flow cache within the switch. When the connection terminates, a flow record is generated containing the connection information and counters. The active-timeout setting in the NetFlow configuration is used to ensure visibility into long running connections, causing the switch to periodically export NetFlow records for active connections. In contrast, sFlow does not use a flow cache, instead sampled packet headers are continually exported, resulting in real-time charts that more accurately reflect the traffic trend.
In addition, exporting packet headers allows an sFlow analyzer to monitor all types of traffic flowing across the switch; note the ARP and IPv6 traffic displayed in sFlowTrend in addition to the TCP/UDP flows. Visibility into layer 2 traffic is particularly important in switched environments where protocols such as DHCP/BOOTP, STP, LLDP and ARP need to be closely managed. sFlow also provides visibility into networked storage, including Ethernet SAN technologies (e.g. FCoE or AoE), that typically dominates bandwidth usage in the data center. Looking forward, there are a number of tunneling protocols being developed to connect virtual switches, including: GRE, mpls, VPLS, VXLAN and NVGRE. As new protocols are deployed on the network they are easily monitored without any change to exiting sFlow agents ensuring end-to-end visibility across the physical and virtual network.
In contrast, NetFlow relies on the switch to decode the traffic. In this case the switch is exporting NetFlow version 5 which only exports records for IPv4 traffic. The NetFlow analyzer is thus only able to report on IPv4 protocols, all other traffic is invisible. This limitation is not unique to Open vSwitch; NetFlow version 5 is the most widely supported version of NetFlow in network devices and is also the version exported by VMware vSphere 5.0.
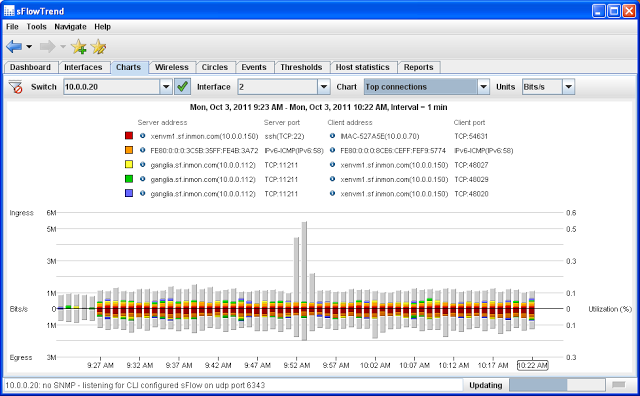
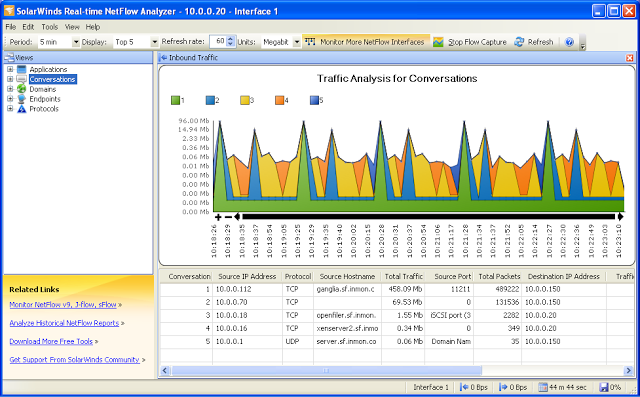
The next two charts show top connections flowing through the virtual switch:
Top Connections in sFlowTrend
Top Connections in Real-Time NetFlow Analyzer
The Top Connections charts further demonstrate the limitation in NetFlow visibility where only IPv4 flows are shown. The sFlow analyzer is able to report in detail on all types of traffic flowing through the switch, in this case showing details of IPv6 traffic in addition to IPv4 flows.
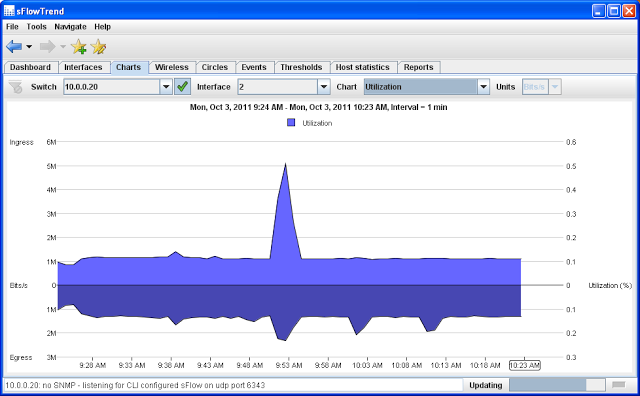
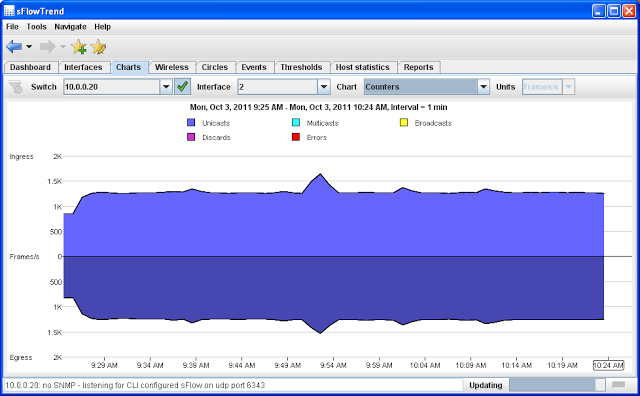
The next two charts show interface utilization and packet counts from sFlowTrend:
Link Utilization in sFlowTrend
Link Counters in sFlowTrend
This type of interface trending is a staple of network management, but obtaining the information is challenging in virtual environments. While SNMP is typically used to obtain this information from network equipment, servers are much less likely to be managed using SNMP and so SNMP polling is often not an option. In addition, there may be large numbers of virtual ports associated with each physical switch port. In a virtual environment with 10,000 physical switch ports you might need to monitor as many as 200,000 virtual ports. Even if SNMP agents were installed on all the servers, SNMP polling does not scale well to large numbers of interfaces. The integrated counter polling mechanism built into sFlow provides scalable monitoring of the utilization of every switch port in the network, both physical and virtual, quickly identifying problems wherever they may occur in the network.
In contrast, NetFlow only reports on traffic flows so neither of these charts is available in the NetFlow Analyzer. The remaining charts are based on sFlow counter data so there are no corresponding NetFlow Analyzer charts.
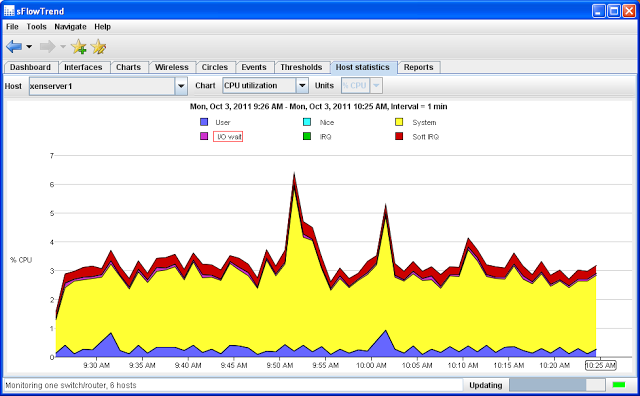
The next sFlowTrend chart shows the CPU load on the hypervisor:
Hypervisor CPU in sFlowTrend
The virtual switch is a software component running on the hypervisor, thus if the hypervisor is overloaded, then network performance will degrade. The sFlow counter polling mechanism extends to system performance counters in addition to the interface counters shown earlier, allowing the sFlow analyzer to display hypervisor CPU utilization. In this case the chart shows a small spike in system CPU utilization corresponds to the spike in traffic at 9:52AM.
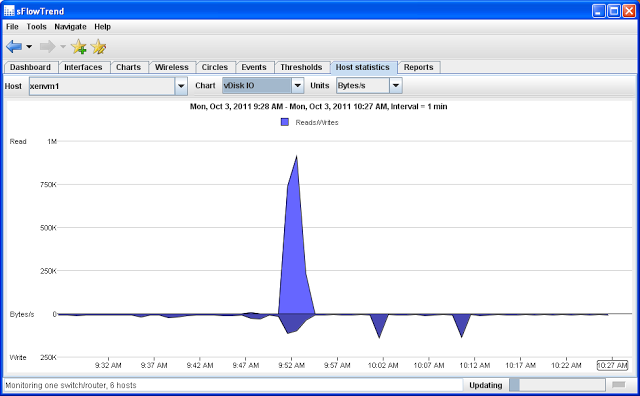
The next sFlowTrend chart shows a trend in disk IO on the virtual machine:
Virtual Machine Disk IO in sFlowTrend
This chart shows that the burst in iSCSI traffic shown in the Top Protocols chart corresponds to a spike in read activity on the virtual machine. Again, sFlow's counter push mechanism efficiently exports information about the performance of virtual machines, allowing the interaction between network and system activity to be understood.
Comments
NetFlow provides limited visibility, focusing on layer 3 network connections. The NetFlow architecture relies on complex functionality within the switches and the complexity of configuring and maintaining NetFlow adds to operational costs and limits scalability. For example, gaining visibility into IPv6 traffic requires firmware (and often hardware) upgrades to the network infrastructure that can be challenging in large scale, always-on, cloud environments.In contrast, adding support for additional protocols in sFlow requires no change to the network infrastructure, but is simply a matter of upgrading the sFlow analyzer. The sFlow architecture eliminates complexity from the agents, increasing scalability and reducing the operational costs associated with configuration and maintenance. sFlow provides comprehensive visibility into network and system resources needed to manage performance in virtualized and cloud environments.




【推荐】国内首个AI IDE,深度理解中文开发场景,立即下载体验Trae
【推荐】编程新体验,更懂你的AI,立即体验豆包MarsCode编程助手
【推荐】抖音旗下AI助手豆包,你的智能百科全书,全免费不限次数
【推荐】轻量又高性能的 SSH 工具 IShell:AI 加持,快人一步
· AI与.NET技术实操系列:向量存储与相似性搜索在 .NET 中的实现
· 基于Microsoft.Extensions.AI核心库实现RAG应用
· Linux系列:如何用heaptrack跟踪.NET程序的非托管内存泄露
· 开发者必知的日志记录最佳实践
· SQL Server 2025 AI相关能力初探
· winform 绘制太阳,地球,月球 运作规律
· 震惊!C++程序真的从main开始吗?99%的程序员都答错了
· 【硬核科普】Trae如何「偷看」你的代码?零基础破解AI编程运行原理
· 超详细:普通电脑也行Windows部署deepseek R1训练数据并当服务器共享给他人
· AI与.NET技术实操系列(五):向量存储与相似性搜索在 .NET 中的实现