
python爬虫爬取各个城市历史天气及数据可视化
前言:
爬取网站www.tianqihoubao.com上各城市的历史天气数据,并利用matplotlib将数据可视化。
代码实现:
  1 import asyncio
  2 import aiohttp
  3 from lxml import etree
  4 import re
  5 from collections import namedtuple
  6 import matplotlib.pyplot as plt
  7
  8 #用来正常显示中文标签
  9 plt.rcParams['font.sans-serif']=['SimHei']
 10
 11 Args = namedtuple('Args',['city','year','month'])
 12
 13 #获取给定城市列表在给定年列表的以月为单位的每天平均温度字典,
 14 #返回格式 {Args(city='wuhan', year=2018, month=4): [21.5, 22.5, ...], Args(city='shanghai', year=2018, month=2): [3.5, 2.5, ...], ...}
 15 def get_weather(citys, years):
 16     tdata = {}
 17     wdata = {}
 18     async def work(args):
 19         url = "http://www.tianqihoubao.com/lishi/%s/month/%d%02d.html" % (args.city, args.year, args.month)
 20         headers = {'User-Agent': 'Mozilla/5.0 (Windows NT 10.0; WOW64) AppleWebKit/537.36 (KHTML, like Gecko) Chrome/61.0.3163.100 Safari/537.36'}
 21         async with aiohttp.ClientSession() as session:
 22             async with session.get(url, headers=headers, timeout=1000, verify_ssl=False) as response:
 23                 html = await response.text()
 24                 ethtml = etree.HTML(html)
 25
 26                 #从html页面提取数据,数据格式如: '10℃/-2℃'
 27                 result = [re.sub("\r\n *","",item.text) for item in ethtml.xpath("//table[@class='b']/tr/td") if not re.fullmatch("\r\n *",item.text)]
 28
 29                 #获取温度数据 '10℃/-2℃',将'10℃/-2℃'格式数据正则提取,求平均值
 30                 tstrs = result[1::3]
 31                 ts = [sum(map(lambda x: int(x), re.findall('(\d+|-\d+)℃\/(\d+|-\d+)℃', tstr)[0]))/2 for tstr in tstrs
 32                                                                                     if re.fullmatch('(\d+|-\d+)℃\/(\d+|-\d+)℃', tstr)]
 33
 34                 #获取天气数据 '多云/晴',
 35                 wstrs = [re.findall('([\u4E00-\u9FA5]+)\/([\u4E00-\u9FA5]+)',wstr)[0] for wstr in result[0::3]
 36                                                                                     if re.fullmatch('([\u4E00-\u9FA5]+)\/([\u4E00-\u9FA5]+)',wstr)]
 37                 ws = [re.sub(' ','',b) for a in wstrs for b in a]
 38
 39                 tdata[args] = ts
 40                 wdata[args] = ws
 41                 print(args, 'done')
 42                 return None
 43
 44     loop = asyncio.get_event_loop()
 45
 46     #用列表推导是为所有城市所有年的每月添加协程
 47     tasks = [asyncio.ensure_future(work(Args(city, year, month))) for city in citys for year in years for month in range(1,13)]
 48
 49     #开始执行协程,事件循环处理异步IO事件,程序阻塞在这里,直到所有的协程执行完毕
 50     loop.run_until_complete(asyncio.wait(tasks))
 51
 52     #return [task.result() for task in tasks]
 53     return (tdata,wdata)
 54
 55
 56 #绘制多个城市在某一年的温度曲线
 57 def temperature_curve(citys, year, data):
 58     for city in citys:
 59         x = range(365)
 60         y = [b for a in [data[Args(city, year, month)] for month in range(1,13)] for b in a][:365]
 61         plt.plot(x, y, label=city)
 62         plt.xticks(list(x)[::31], ['Jan','Feb','Mar','Apr','May','Jun','Jul','Aug','Sept','Oct','Nov','Dec'])
 63         plt.yticks([-10,0,10,20,30,40],['-10℃','0℃','10℃','20℃','30℃','40℃'])
 64         plt.legend()
 65
 66     plt.title('各城市%d年温度曲线图' % year)
 67     plt.ylabel('temperature')
 68     plt.xlabel('month')
 69     plt.show()
 70
 71 #绘制多个城市在某一年各个天气比例
 72 def weather_ratio(citys, year, data):
 73
 74     #创建 天气-颜色 字典
 75     color_dict = {'晴':'tomato', '多云':'gold', '阴':'turquoise', '阴天':'turquoise', '雷阵雨':'darkseagreen',
 76                     '暴雨':'black','晴间多云':'cyan', '阵雨':'cadetblue', '浮尘':'pink', '扬沙':'plum','霾':'dimgray',
 77                     '小雨':'cornflowerblue', '中雨':'blue', '大雨':'navy', '小雪':'lime', '中雪':'violet', '大雪':'teal',
 78                     '雨夹雪':'sienna', '冻雨':'skyblue', '少云':'steelblue', '雾':'white'}
 79     for city in citys:
 80         labels = []
 81         sizes = []
 82         colors = []
 83         city_weathers = [b for a in [data[Args(city, year, month)] for month in range(1,13)] for b in a]
 84         for weather in set(city_weathers):
 85             labels.append(weather)
 86             sizes.append(city_weathers.count(weather) * 100 / len(city_weathers))
 87
 88             #给不同天气添加颜色
 89             colors.append(color_dict[weather])
 90
 91         #关联排序,sizes按逆序排序,labels,colors按sizes关联排序
 92         z = zip(sizes,labels,colors)
 93         z = sorted(z, reverse=True)
 94         sizes,labels,colors = zip(*z)
 95
 96         #只显示最频繁的7中天气文字标签(以免文字间相互遮挡)
 97         labels = list(labels)[:7] + [''] * (len(labels) - 7)
 98
 99         #使比率最大的天气突出显示
100         explode = [0] * len(sizes)
101         explode[0] = 0.1
102
103         ax = plt.subplot(1, len(citys), citys.index(city) + 1)
104         ax.pie(sizes, labels=labels,autopct='%1.1f%%',shadow=False,startangle=150,colors=colors, explode=explode)
105         ax.set_title('%s %d年天气饼图' % (city, year))
106     plt.show()
107
108 tdata,wdata =  get_weather(citys=['wuhan','shanghai','beijing'], years=[2018])
109 temperature_curve(citys=['wuhan', 'shanghai', 'beijing'], year=2018, data=tdata)
110 weather_ratio(citys=['wuhan','shanghai','beijing'], year=2018, data=wdata)
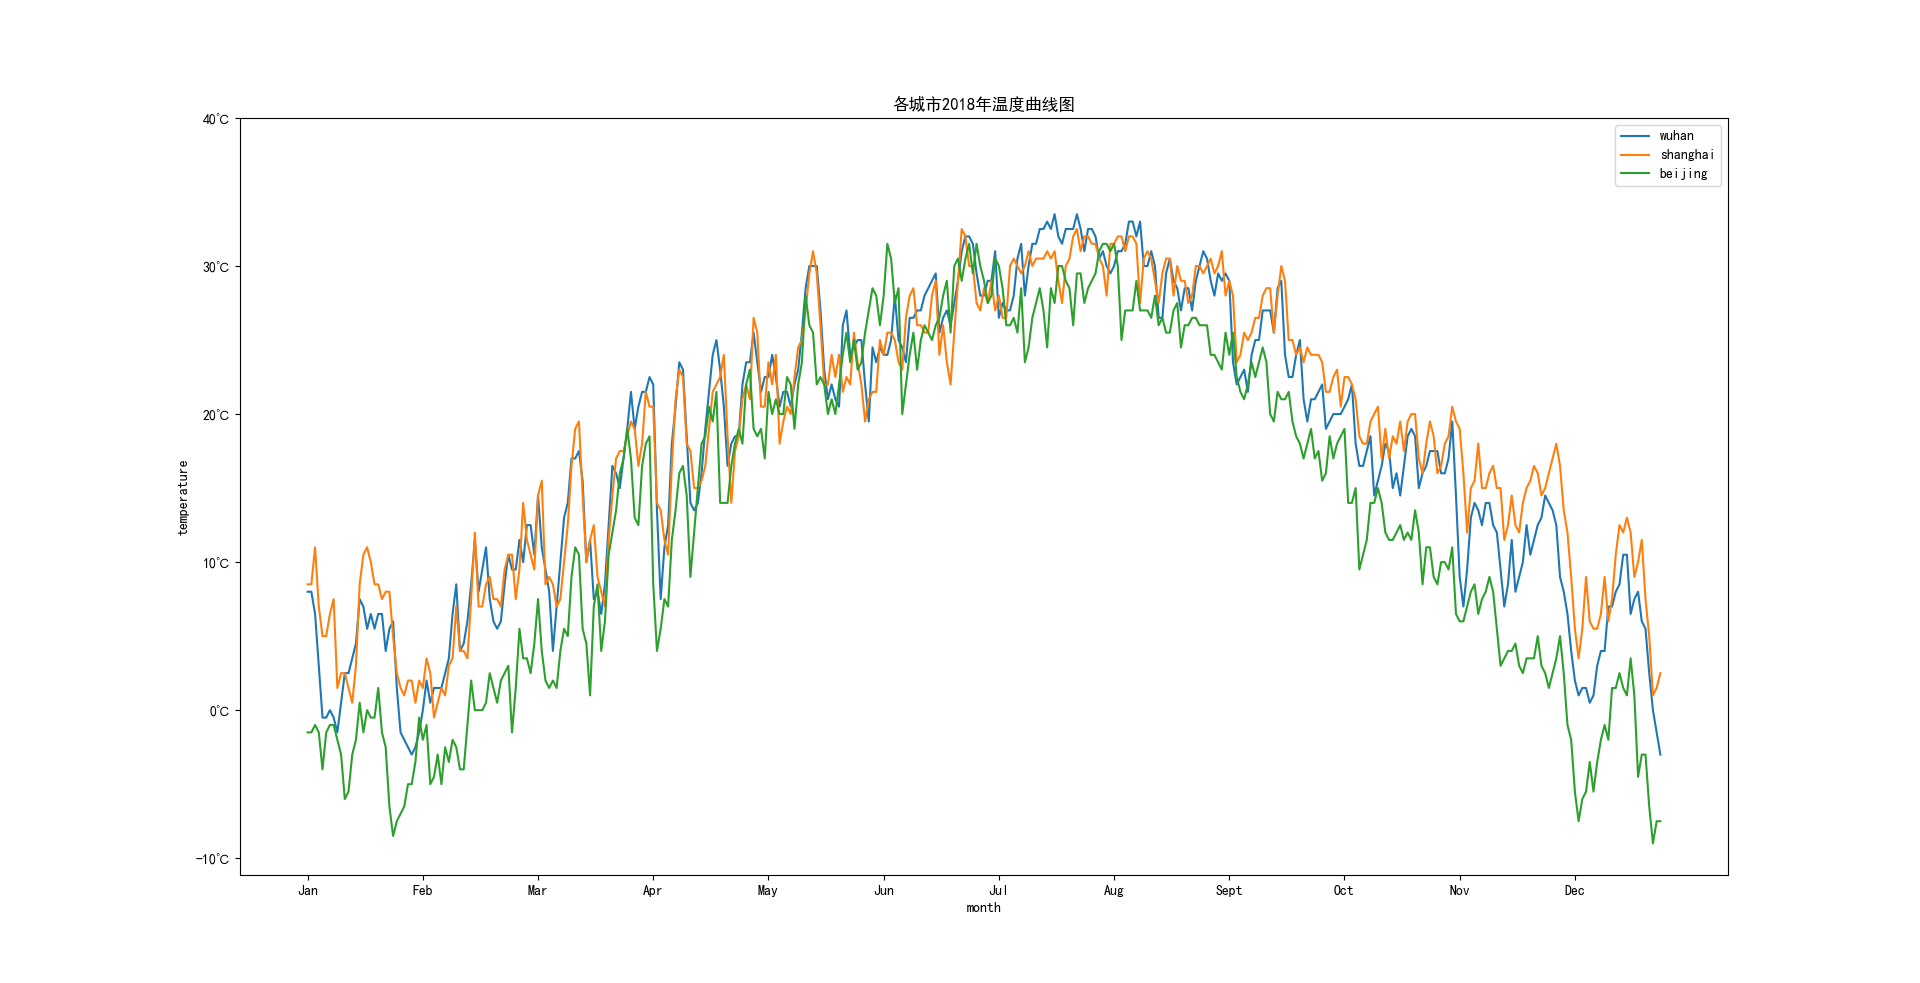
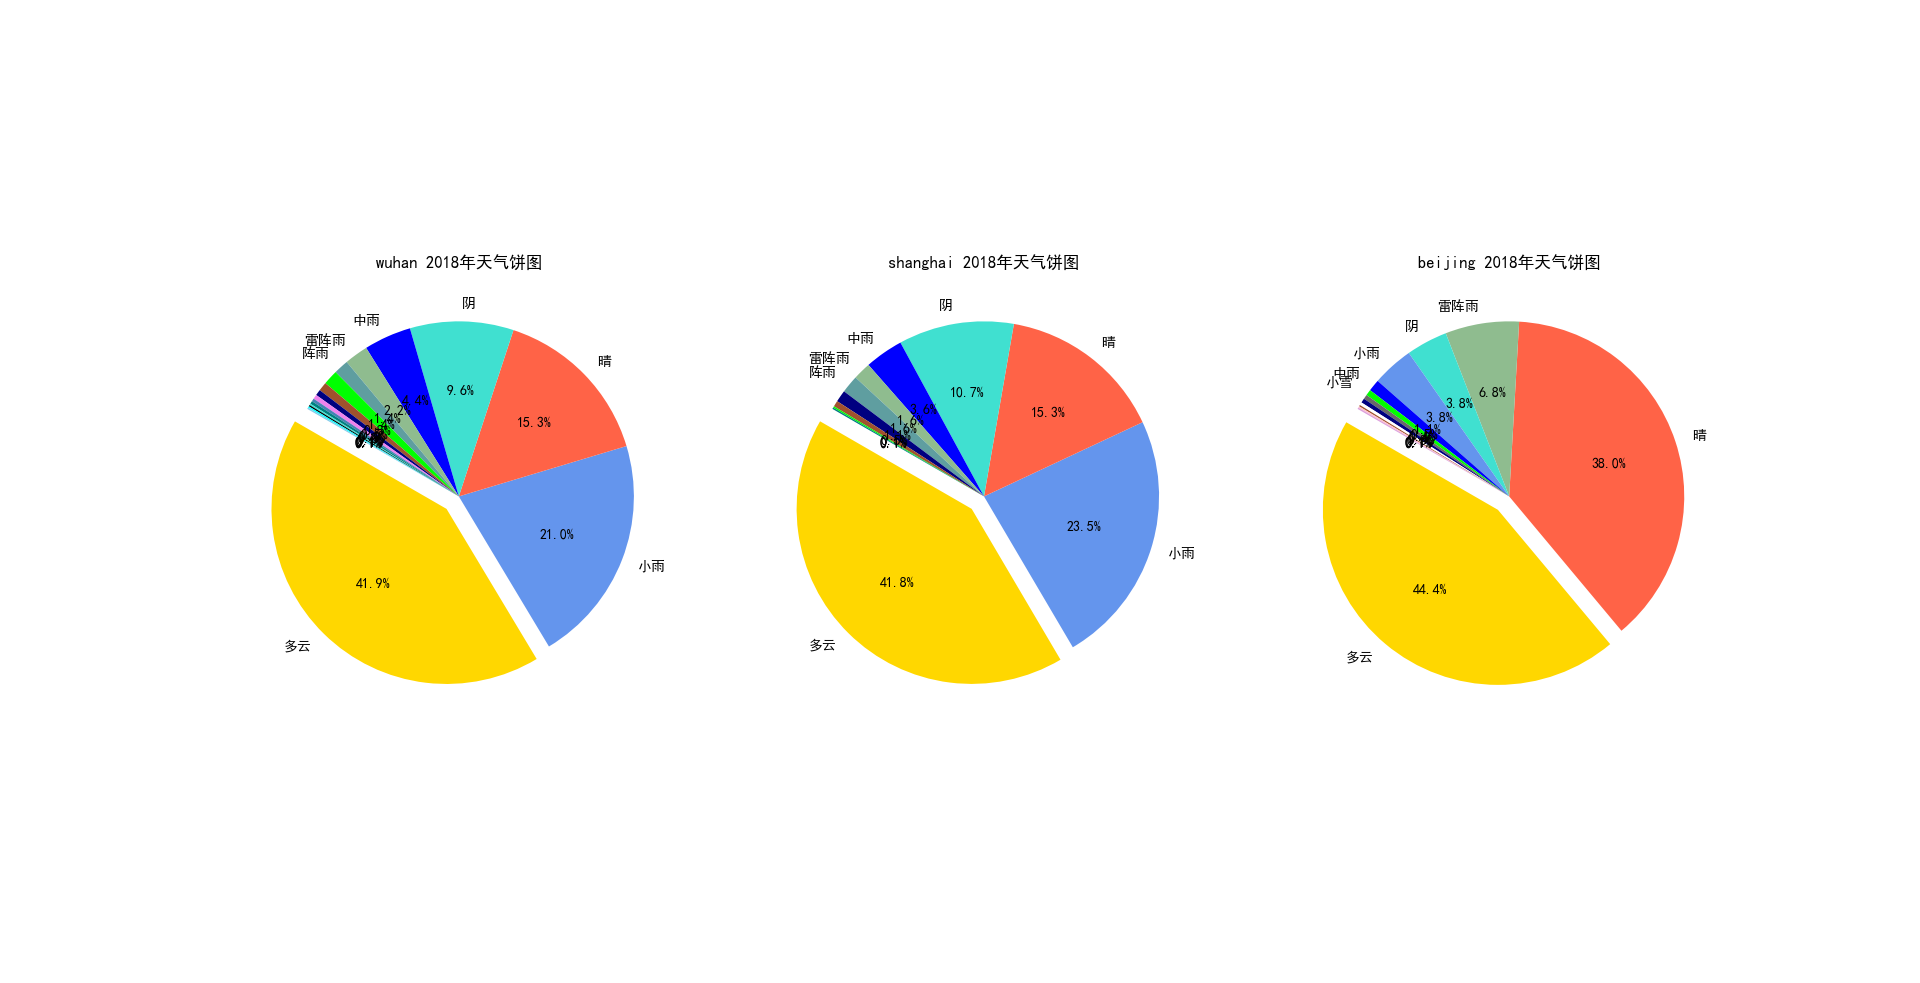
效果展示:
总结:
代码还有很多可以有优化的地方,比如:
1. 数据存储数据库,以防爬取大量数据时程序意外崩溃导致数据丢失
2. 记录已爬url,好让程序重新开始后跳过爬取过的url,节省时间
3. 数据可视化还可以新增内容,同一个城市不同年份天气与气温的纵向比较

