练习六十八:pyecharts模块练习
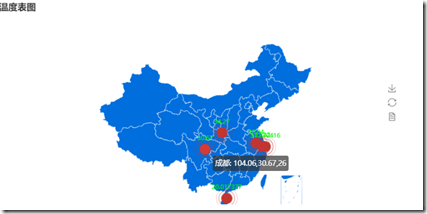
用一个地图显示最热的几个城市温度
代码(用Geo模块)
from pyecharts import Geo

attr = ["西安","上海","苏州","成都","海南","南京"]
value = [28,15,16,26,31,23]
geo = Geo("温度表图")
geo.add("",attr,value,type="effectScatter",border_color="#ffffff",symbol_size=20,
        is_label_show=True,label_text_color="#00FF00",symbol="circle",
        symbol_color="ff0000",geo_normal_color="#006edd",geo_emphasis_color="#0000ff")
# geo.show_config()
# geo.render()  #默认将在当前目录中生成render.html,也看自定义文件名称:geo.render("testhtml.html")
geo  #直接显示在notebook上
结果
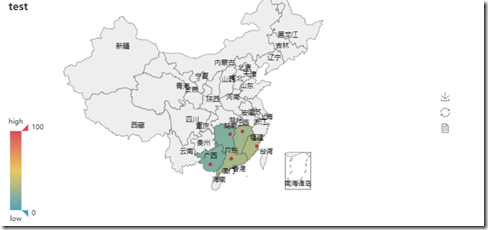
代码(用Map模块):
from pyecharts import Map

areas = ['广东','广西','湖南','江西','福建']
values = [28,15,16,26,31]
test_map = Map("test")
test_map.add("", areas, values, maptype='china', is_visualmap=True, visual_text_color='#000', is_label_show=True)
test_map #notebook上
结果


