
Ganglia+nagios 监控hadoop资源与报警
全篇主要依赖下面2篇文章
http://quenlang.blog.51cto.com/4813803/1571635
http://www.cnblogs.com/mchina/archive/2013/02/20/2883404.html#!comments
一 资源下载
nagios : http://sourceforge.net/projects/nagios/files/nagios-4.x/nagios-4.1.1/nagios-4.1.1.tar.gz/download
nagios-plugs : http://www.nagios-plugins.org/download/nagios-plugins-2.1.1.tar.gz
nrpe : http://sourceforge.net/projects/nagios/files/nrpe-2.x/nrpe-2.15/nrpe-2.15.tar.gz/download
二 ganglia 安装
hadoop1安装ganglia的gmetad、gmond及ganglia-web
2.1 依赖检验,安装
新建一个 ganglia.rpm 文件,写入以下依赖组件
$ vim ganglia.rpm
apr-devel
apr-util
check-devel
cairo-devel
pango-devel
libxml2-devel
glib2-devel
dbus-devel
freetype-devel
fontconfig-devel
gcc-c++
expat-devel
python-devel
rrdtool
rrdtool-devel
libXrender-devel
zlib
libart_lgpl
libpng
dejavu-lgc-sans-mono-fonts
dejavu-sans-mono-fonts
perl-ExtUtils-CBuilder
perl-ExtUtils-MakeMaker
查看这些组件是否有安装
$ rpm -q `cat ganglia.rpm`
package apr-devel is not installed
apr-util-1.3.9-3.el6_0.1.x86_64
check-devel-0.9.8-1.1.el6.x86_64
cairo-devel-1.8.8-3.1.el6.x86_64
pango-devel-1.28.1-10.el6.x86_64
libxml2-devel-2.7.6-14.el6_5.2.x86_64
glib2-devel-2.28.8-4.el6.x86_64
dbus-devel-1.2.24-7.el6_3.x86_64
freetype-devel-2.3.11-14.el6_3.1.x86_64
fontconfig-devel-2.8.0-5.el6.x86_64
gcc-c++-4.4.7-11.el6.x86_64
package expat-devel is not installed
python-devel-2.6.6-52.el6.x86_64
libXrender-devel-0.9.8-2.1.el6.x86_64
zlib-1.2.3-29.el6.x86_64
libart_lgpl-2.3.20-5.1.el6.x86_64
libpng-1.2.49-1.el6_2.x86_64
package dejavu-lgc-sans-mono-fonts is not installed
package dejavu-sans-mono-fonts is not installed
perl-ExtUtils-CBuilder-0.27-136.el6.x86_64
perl-ExtUtils-MakeMaker-6.55-136.el6.x86_64
使用 yum install 安装机器上没有的组件
还要安装 confuse
下载地址:http://www.nongnu.org/confuse/
$ tar -zxf confuse-2.7.tar.gz
$ cd confuse-2.7
$ ./configure CFLAGS=-fPIC --disable-nls
$ make && make install
2.2 安装gangali
hadoop1上安装
$ tar -xvf /home/hadoop/ganglia-3.6.0.tar.gz -C /opt/soft/
## 安装gmetad
$ ./configure --prefix=/usr/local/ganglia --with-gmetad --with-libpcre=no --enable-gexec --enable-status --sysconfdir=/etc/ganglia
$ make && make install
$ cp gmetad/gmetad.init /etc/init.d/gmetad
$ cp /usr/local/ganglia/sbin/gmetad /usr/sbin/
$ chkconfig --add gmetad
## 安装gmond
$ cp gmond/gmond.init /etc/init.d/gmond
$ cp /usr/local/ganglia/sbin/gmond /usr/sbin/
$ gmond --default_config>/etc/ganglia/gmond.conf
$ chkconfig --add gmond
gmetad、gmond安装成功,接着安装ganglia-web,首先要安装php和httpd
yum install php httpd -y
修改httpd的配置文件/etc/httpd/conf/httpd.conf,只把监听端口改为8080
Listen 8080
安装ganglia-web
$ tar xf ganglia-web-3.6.2.tar.gz -C /opt/soft/ $ cd /opt/soft/ $ chmod -R 777 ganglia-web-3.6.2/
$mv ganglia-web-3.6.2/ /var/www/html/ganglia
$ cd/var/www/html/ganglia$ useradd www-data
$ make install
$ chmod 777 /var/lib/ganglia-web/dwoo/cache/
$ chmod 777 /var/lib/ganglia-web/dwoo/compiled/
至此ganglia-web安装完成,修改conf_default.php修改文件,指定ganglia-web的目录及rrds的数据目录,修改如下两行:
36 # Where gmetad stores the rrd archives.
37 $conf['gmetad_root'] = "/var/www/html/ganglia"; ## 改为web程序的安装目录
38 $conf['rrds'] = "/var/lib/ganglia/rrds";        ## 指定rrd数据存放的路径
创建rrd数据存放目录并授权
$ mkdir /var/lib/ganglia/rrds -p
$ chown nobody:nobody /var/lib/ganglia/rrds/ -R
到这里,hadoop1上的ganglia的所有安装工作就完成了,接下来就是要在其他所有节点上安装ganglia的gmond客户端。
其他节点安装上gmond
也是要先安装依赖,然后在安装gmond,所有节点安装都是一样的,所以这里写个脚本
$ vim install_ganglia.sh

#!/bin/sh

#安装依赖  这是是我已经知道我缺少哪些依赖,所以只安装这些,具体按照你的环境来列出需要安装哪些
yum install -y apr-devel expat-devel rrdtool rrdtool-devel

mkdir /opt/soft;cd /opt/soft
tar -xvf /home/hadoop/confuse-2.7.tar.gz
cd confuse-2.7
./configure CFLAGS=-fPIC --disable-nls
make && make install
cd /opt/soft
#安装 ganglia gmond
tar -xvf /home/hadoop/ganglia-3.6.0.tar.gz
cd ganglia-3.6.0/
./configure --prefix=/usr/local/ganglia --with-libpcre=no --enable-gexec --enable-status --sysconfdir=/etc/ganglia
make && make install
cp gmond/gmond.init /etc/init.d/gmond
cp /usr/local/ganglia/sbin/gmond /usr/sbin/
gmond --default_config>/etc/ganglia/gmond.conf
chkconfig --add gmond
将这个脚本复制到所有节点执行
2.3 配置ganglia
分为服务端和客户端的配置,服务端的配置文件为gmetad.conf,客户端的配置文件为gmond.conf
首先配置hadoop1上的gmetad.conf,这个文件只有hadoop1上有
$ vi  /etc/ganglia/gmetad.conf
## 定义数据源的名字及监听地址,gmond会将收集的数据发送到数据源监听机器上的rrd数据目录中
## hadoop cluster 为自己定义
data_source "hadoop cluster" 192.168.0.101:8649
接着配置 gmond.conf
$ head -n 80 /etc/ganglia/gmond.conf

/* This configuration is as close to 2.5.x default behavior as possible
   The values closely match ./gmond/metric.h definitions in 2.5.x */
globals {
  daemonize = yes        ## 以守护进程运行
  setuid = yes
  user = nobody          ## 运行gmond的用户
  debug_level = 0        ## 改为1会在启动时打印debug信息
  max_udp_msg_len = 1472
  mute = no              ## 哑巴,本节点将不会再广播任何自己收集到的数据到网络上
  deaf = no              ## 聋子,本节点将不再接收任何其他节点广播的数据包
  allow_extra_data = yes
  host_dmax = 86400 /*secs. Expires (removes from web interface) hosts in 1 day */
  host_tmax = 20 /*secs */
  cleanup_threshold = 300 /*secs */
  gexec = no
  # By default gmond will use reverse DNS resolution when displaying your hostname
  # Uncommeting following value will override that value.
  # override_hostname = "mywebserver.domain.com"
  # If you are not using multicast this value should be set to something other than 0.
  # Otherwise if you restart aggregator gmond you will get empty graphs. 60 seconds is reasonable
  send_metadata_interval = 0 /*secs */

}

/*
 * The cluster attributes specified will be used as part of the <CLUSTER>
 * tag that will wrap all hosts collected by this instance.
 */
cluster {
  name = "hadoop cluster"    ## 指定集群的名字
  owner = "nobody"           ## 集群的所有者
  latlong = "unspecified"
  url = "unspecified"
}

/* The host section describes attributes of the host, like the location */
host {
  location = "unspecified"
}

/* Feel free to specify as many udp_send_channels as you like.  Gmond
   used to only support having a single channel */
udp_send_channel {
  #bind_hostname = yes # Highly recommended, soon to be default.
                       # This option tells gmond to use a source address
                       # that resolves to the machine's hostname.  Without
                       # this, the metrics may appear to come from any
                       # interface and the DNS names associated with
                       # those IPs will be used to create the RRDs.
#  mcast_join = 239.2.11.71    ## 单播模式要注释调这行
  host = 192.168.0.101    ## 单播模式,指定接受数据的主机
  port = 8649             ## 监听端口
  ttl = 1
}

/* You can specify as many udp_recv_channels as you like as well. */
udp_recv_channel {
  #mcast_join = 239.2.11.71    ## 单播模式要注释调这行
  port = 8649
  #bind = 239.2.11.71          ## 单播模式要注释调这行
  retry_bind = true
  # Size of the UDP buffer. If you are handling lots of metrics you really
  # should bump it up to e.g. 10MB or even higher.
  # buffer = 10485760
}

/* You can specify as many tcp_accept_channels as you like to share
   an xml description of the state of the cluster */
tcp_accept_channel {
  port = 8649
  # If you want to gzip XML output
  gzip_output = no
}

/* Channel to receive sFlow datagrams */
#udp_recv_channel {
#  port = 6343
#}

/* Optional sFlow settings */
好了,hadoop1上的gmetad.conf和gmond.conf配置文件已经修改完成,这时,直接将hadoop1上的gmond.conf文件scp到其他节点上相同的路径下覆盖原来的gmond.conf即可。
2.4 启动 ganglia
所有节点启动 gmond 服务
/etc/init.d/gmond start
hadoop1 节点启动 gmetad httpd 服务
/etc/init.d/gmetad start
/etc/init.d/httpd start
2.5 在浏览器中访问hadoop1:8080/ganglia,就会出现下面的页面

配置完成
三 配置hadoop
此时,ganglia只是监控了各主机基本的性能,并没有监控到hadoop,接下来需要配置hadoop配置文件,这里以hadoop1上的配置文件为例,其他节点对应的配置文件应从hadoop1上拷贝,首先需要修改的是hadoop配置目录下的hadoop-metrics2.properties
$ cd /usr/local/hadoop-2.6.0/etc/hadoop/
$ vim hadoop-metrics2.properties
# for Ganglia 3.1 support
 *.sink.ganglia.class=org.apache.hadoop.metrics2.sink.ganglia.GangliaSink31

 *.sink.ganglia.period=10

# default for supportsparse is false
 *.sink.ganglia.supportsparse=true

*.sink.ganglia.slope=jvm.metrics.gcCount=zero,jvm.metrics.memHeapUsedM=both
*.sink.ganglia.dmax=jvm.metrics.threadsBlocked=70,jvm.metrics.memHeapUsedM=40

# Tag values to use for the ganglia prefix. If not defined no tags are used.
# If '*' all tags are used. If specifiying multiple tags separate them with
# commas. Note that the last segment of the property name is the context name.
#
#*.sink.ganglia.tagsForPrefix.jvm=ProcesName
#*.sink.ganglia.tagsForPrefix.dfs=
#*.sink.ganglia.tagsForPrefix.rpc=
#*.sink.ganglia.tagsForPrefix.mapred=

namenode.sink.ganglia.servers=192.168.0.101:8649
datanode.sink.ganglia.servers=192.168.0.101:8649
resourcemanager.sink.ganglia.servers=192.168.0.101:8649
nodemanager.sink.ganglia.servers=192.168.0.101:8649
mrappmaster.sink.ganglia.servers=192.168.0.101:8649
jobhistoryserver.sink.ganglia.serve=192.168.0.101:8649
复制到所有节点,重启hadoop集群
此时在监控中已经可以看到关于hadoop指标的监控了
四 nagios 安装
4.1 hadoop1 机器
新建nagios用户
# useradd -s /sbin/nologin nagios
# mkdir /usr/local/nagios
# chown -R nagios.nagios /usr/local/nagios
4.1.1 编译安装nagios
$ cd /opt/soft
$ tar zxvf nagios-3.4.3.tar.gz
$ cd nagios-3.4.3
$ ./configure --prefix=/usr/local/nagios
$ make al
$ make install
$ make install-init
$ make install-config
$ make install-commandmode
$ make install-webconf
切换目录到安装路径(这里是/usr/local/nagios),看是否存在etc、bin、sbin、share、var 这五个目录,如果存在则可以表明程序被正确的安装到系统了
4.1.2 编译安装 nagios-plugs
$ cd /opt/soft
$ tar zxvf nagios-plugins-1.4.16.tar.gz
$ cd nagios-plugins-1.4.16
$ mkdir /user/local/nagios
$ ./configure --prefix=/usr/local/nagios
$ make && make install
4.1.3 安装 check_nrpe 插件
$ cd /opt/soft/
$ tar -xvf /home/hadoop/nrpe-2.15.tar.gz
$ cd nrpe-2.15/
$ ./configure
$ make all
$ make install-plugin
4.2 datanode 节点
datanode只要安装nagios-plugs 与 nrpe.
因为所有节点是一样的,这里写个脚本
#!/bin/sh

adduser nagios

cd /opt/soft
tar xvf /home/hadoop/nagios-plugins-2.1.1.tar.gz
cd nagios-plugins-2.1.1
mkdir /usr/local/nagios
./configure --prefix=/usr/local/nagios
make && make install

chown nagios.nagios /usr/local/nagios
chown -R nagios.nagios /usr/local/nagios/libexec

#安装xinetd.看你的机器是否有xinetd,如果没有就安装,有的话就不用了
yum install xinetd -y

cd ../
tar xvf /home/hadoop/nrpe-2.15.tar.gz
cd nrpe-2.15
./configure
make all
make install-daemon
make install-daemon-config
make install-xinetd
安装完成后
修改nrpe.cfg
$ vim /usr/local/nagios/etc/nrpe.cfg
log_facility=daemon
pid_file=/var/run/nrpe.pid
## nagios的监听端口
server_port=5666
nrpe_user=nagios
nrpe_group=nagios
## nagios服务器主机地址
allowed_hosts=xx.xxx.x.xx
dont_blame_nrpe=0
allow_bash_command_substitution=0
debug=0
command_timeout=60
connection_timeout=300

## 监控负载
command[check_load]=/usr/local/nagios/libexec/check_load -w 15,10,5 -c 30,25,20
## 当前系统用户数
command[check_users]=/usr/local/nagios/libexec/check_users -w 5 -c 10
## 根分区空闲容量
command[check_sda2]=/usr/local/nagios/libexec/check_disk -w 20% -c 10% -p /dev/sda2
## mysql状态
command[check_mysql]=/usr/local/nagios/libexec/check_mysql -H localhost -P 3306 -d kora -u kora -p upbjsxt
## 主机是否存活
command[check_ping]=/usr/local/nagios/libexec/check_ping -H localhost -w  100.0,20% -c  500.0,60%
## 当前系统的进程总数
command[check_total_procs]=/usr/local/nagios/libexec/check_procs -w 150 -c 200
## swap使用情况
command[check_swap]=/usr/local/nagios/libexec/check_swap -w 20 -c 10
只有在被监控机器的这个配置文件中定义的命令,在监控机器(也就是hadoop1)上才能通过nrpe插件获取.也就是想监控机器的什么指标必须现在此处定义
同步到其他所有datanode节点
可以看到创建了这个文件/etc/xinetd.d/nrpe。
编辑这个脚本(图用的其他文章的图,版本号跟配置不一样,意思到就行了):

在only_from 后增加监控主机的IP地址。
编辑/etc/services 文件,增加NRPE服务
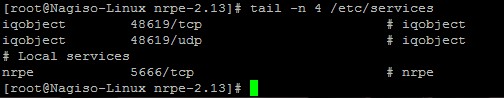
重启xinted 服务
# service xinetd restart
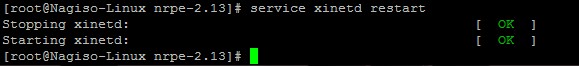
查看NRPE 是否已经启动

可以看到5666端口已经在监听了。
4.3 配置
在hadoop1上
要想让nagios与ganglia整合起来,就需要在hadoop1上把ganglia安装包中的ganglia的插件放到nagios的插件目录下
$ /opt/soft/ganglia-3.6.0
$ cp contrib/check_ganglia.py /usr/local/nagios/libexec/
默认的check_ganglia.py 插件中只有监控项的实际值大于critical阀值的情况,这里需要增加监控项的实际值小于critical阀值的情况,即最后添加的一段代码
$ vim  /usr/local/nagios/libexec/check_ganglia.py

 88   if critical > warning:
 89     if value >= critical:
 90       print "CHECKGANGLIA CRITICAL: %s is %.2f" % (metric, value)
 91       sys.exit(2)
 92     elif value >= warning:
 93       print "CHECKGANGLIA WARNING: %s is %.2f" % (metric, value)
 94       sys.exit(1)
 95     else:
 96       print "CHECKGANGLIA OK: %s is %.2f" % (metric, value)
 97       sys.exit(0)
 98   else:
 99     if critical >=value:
100       print "CHECKGANGLIA CRITICAL: %s is %.2f" % (metric, value)
101       sys.exit(2)
102     elif warning >=value:
103       print "CHECKGANGLIA WARNING: %s is %.2f" % (metric, value)
104       sys.exit(1)
105     else:
106       print "CHECKGANGLIA OK: %s is %.2f" % (metric, value)
107       sys.exit(0)
最后改成上面这样
hadoop1上配置各个主机及对应的监控项
没配置前,现在目录结构是这样的
$ cd /usr/local/nagios/etc/objects/
$ ll
total 48
-rw-rw-r-- 1 nagios nagios  8010 9月  11 14:59 commands.cfg
-rw-rw-r-- 1 nagios nagios  2138 9月  11 11:35 contacts.cfg
-rw-rw-r-- 1 nagios nagios  5375 9月  11 11:35 localhost.cfg
-rw-rw-r-- 1 nagios nagios  3096 9月  11 11:35 printer.cfg
-rw-rw-r-- 1 nagios nagios  3265 9月  11 11:35 switch.cfg
-rw-rw-r-- 1 nagios nagios 10621 9月  11 11:35 templates.cfg
-rw-rw-r-- 1 nagios nagios  3180 9月  11 11:35 timeperiods.cfg
-rw-rw-r-- 1 nagios nagios  3991 9月  11 11:35 windows.cfg
注意:cfg的文件跟在配置后面的说明注释一定要用逗号,而不是#号.我就是因为一开始用了#号,结果一直出问题找不到是什么原因
修改 commands.cfg
在文件最后加上如下内容
# 'check_ganglia' command definition
define command{
        command_name    check_ganglia
        command_line    $USER1$/check_ganglia.py -h $HOSTADDRESS$ -m $ARG1$ -w $ARG2$ -c $ARG3$
        }

# 'check_nrpe' command definition
define command{
        command_name    check_nrpe
        command_line    $USER1$/check_nrpe -H $HOSTADDRESS$ -c $ARG1$
        }
修改templates.cfg
我有18台datanode机器,这里篇幅原因只截取5个,后面依次再加就行了
define service {
        use generic-service
        name ganglia-service1     ;这里的配置在service1.cfg中用到
        hostgroup_name a01    ;这里的配置在hadoop1.cfg中用到
        service_groups ganglia-metrics1    ;这里的配置在service1.cfg中用到
        register        0
}

define service {
        use generic-service
        name ganglia-service2    ;这里的配置在service2.cfg中用到
        hostgroup_name a02    ;这里的配置在hadoop2.cfg中用到
        service_groups ganglia-metrics2    ;这里的配置在service2.cfg中用到
        register        0
}
define service {
        use generic-service
        name ganglia-service3    ;这里的配置在service3.cfg中用到
        hostgroup_name a03    ;这里的配置在hadoop3.cfg中用到
        service_groups ganglia-metrics3    ;这里的配置在service3.cfg中用到
        register        0
}
define service {
        use generic-service
        name ganglia-service4    ;这里的配置在service4.cfg中用到
        hostgroup_name a04    ;这里的配置在hadoop4.cfg中用到
        service_groups ganglia-metrics4    ;这里的配置在service4.cfg中用到
        register        0
}
define service {
        use generic-service
        name ganglia-service5    ;这里的配置在service5.cfg中用到
        hostgroup_name a05    ;这里的配置在hadoop5.cfg中用到
        service_groups ganglia-metrics5    ;这里的配置在service5.cfg中用到
        register        0
}
hadoop1.cfg 配置
这个默认是没有,用localhost.cfg 拷贝来
$cp localhost.cfg hadoop1.cfg
# vim hadoop1.cfg
define host{
        use                     linux-server
        host_name               a01
        alias                   a01
        address                a01
        }

define hostgroup {
        hostgroup_name  a01
        alias  a01
        members a01
        }
define service{
        use                             local-service
        host_name                       a01
        service_description             PING
        check_command                   check_ping!100,20%!500,60%
        }

define service{
        use                             local-service
        host_name                      a01
        service_description             根分区
        check_command                   check_local_disk!20%!10%!/
#       contact_groups                  admins
        }

define service{
        use                             local-service
        host_name                       a01
        service_description             用户数量
        check_command                   check_local_users!20!50
        }

define service{
        use                             local-service
        host_name                       a01
        service_description             进程数
        check_command                   check_local_procs!550!650!RSZDT
        }

define service{
        use                             local-service
        host_name                       a01
        service_description             系统负载
        check_command                   check_local_load!5.0,4.0,3.0!10.0,6.0,4.0
}
service1.cfg 配置
默认没有service1.cfg,新建一个
$ vim service1.cfg

define servicegroup {
        servicegroup_name ganglia-metrics1
        alias Ganglia Metrics1
}
## 这里的check_ganglia为commonds.cfg中声明的check_ganglia命令
define service{
        use                             ganglia-service1
        service_description             内存空闲
        check_command                   check_ganglia!mem_free!200!50
}

define service{
        use                             ganglia-service1
        service_description             NameNode同步
        check_command                   check_ganglia!dfs.namenode.SyncsAvgTime!10!50
}
hadoop2.cfg 配置
需要注意使用check_nrpe插件的监控项必须要在hadoop2上的nrpe.cfg中声明
也就是每个service里的check_command必须在这台机器的 nrpe.cfg 中声明了才有用,比且要保证名称一样
$ cp localhost.cfg hadoop2.cfg
$ vim hadoop2.cfg
define host{
        use                     linux-server            ; Name of host template to use
                                                        ; This host definition will inherit all variables that are defined
                                                        ; in (or inherited by) the linux-server host template definition.
        host_name               a02
        alias                   a02
        address                 a02
        }

# Define an optional hostgroup for Linux machines

define hostgroup{
        hostgroup_name  a02; The name of the hostgroup
        alias           a02 ; Long name of the group
        members         a02    ; Comma separated list of hosts that belong to this group
        }

# Define a service to "ping" the local machine

define service{
        use                             local-service         ; Name of service template to use
        host_name                       a02
        service_description             PING
        check_command                   check_nrpe!check_ping
        }


# Define a service to check the disk space of the root partition
# on the local machine.  Warning if < 20% free, critical if
# < 10% free space on partition.

define service{
        use                             local-service         ; Name of service template to use
        host_name                       a02
        service_description             Root Partition
        check_command                   check_nrpe!check_sda2
        }


# Define a service to check the number of currently logged in
# users on the local machine.  Warning if > 20 users, critical
# if > 50 users.

define service{
        use                             local-service         ; Name of service template to use
        host_name                       a02
        service_description             Current Users
        check_command                   check_nrpe!check_users
        }


# Define a service to check the number of currently running procs
# on the local machine.  Warning if > 250 processes, critical if
# > 400 users.

define service{
        use                             local-service         ; Name of service template to use
        host_name                       a02
        service_description             Total Processes
        check_command                   check_nrpe!check_total_procs
        }

define service{
        use                             local-service         ; Name of service template to use
        host_name                       a02
        service_description             Current Load
        check_command                   check_nrpe!check_load
        }


# Define a service to check the swap usage the local machine.
# Critical if less than 10% of swap is free, warning if less than 20% is free

define service{
        use                             local-service         ; Name of service template to use
        host_name                       a02
        service_description             Swap Usage
        check_command                   check_nrpe!check_swap
        }
hadoop2的设置完,拷贝16份,因为datanode配置基本一样,就是hostname有点小区别
$ for i in {3..18};do cp hadoop2.cfg hadoop$i.cfg;done
将剩下里面hostname改下就行,后面就不说了
service2.cfg 配置
新建文件并配置
$ vim service2.cfg
define servicegroup {
        servicegroup_name ganglia-metrics2
        alias Ganglia Metrics2
}

define service{
        use     ganglia-service2
        service_description     内存空闲
        check_command   check_ganglia!mem_free!200!50
}

define service{
        use     ganglia-service2
        service_description     RegionServer_Get
        check_command   check_ganglia!yarn.NodeManagerMetrics.AvailableVCores!7!7
}

define service{
        use     ganglia-service2
        service_description     DateNode_Heartbeat
        check_command   check_ganglia!dfs.datanode.HeartbeatsAvgTime!15!40
service2的设置完,拷贝16份,因为datanode配置基本一样,就是servicegroup_name,use有点小区别
$ for i in {3..18};do scp service2.cfg service$i.cfg;done
改成对应的编号
修改 nagios.cfg
$ vim  ../nagios.cfg
cfg_file=/usr/local/nagios/etc/objects/commands.cfg
cfg_file=/usr/local/nagios/etc/objects/contacts.cfg
cfg_file=/usr/local/nagios/etc/objects/timeperiods.cfg
cfg_file=/usr/local/nagios/etc/objects/templates.cfg

#引进host文件
cfg_file=/usr/local/nagios/etc/objects/hadoop1.cfg
cfg_file=/usr/local/nagios/etc/objects/hadoop2.cfg
cfg_file=/usr/local/nagios/etc/objects/hadoop3.cfg
cfg_file=/usr/local/nagios/etc/objects/hadoop4.cfg
cfg_file=/usr/local/nagios/etc/objects/hadoop5.cfg
cfg_file=/usr/local/nagios/etc/objects/hadoop6.cfg
cfg_file=/usr/local/nagios/etc/objects/hadoop7.cfg
cfg_file=/usr/local/nagios/etc/objects/hadoop8.cfg
cfg_file=/usr/local/nagios/etc/objects/hadoop9.cfg
cfg_file=/usr/local/nagios/etc/objects/hadoop10.cfg
cfg_file=/usr/local/nagios/etc/objects/hadoop11.cfg
cfg_file=/usr/local/nagios/etc/objects/hadoop12.cfg
cfg_file=/usr/local/nagios/etc/objects/hadoop13.cfg
cfg_file=/usr/local/nagios/etc/objects/hadoop14.cfg
cfg_file=/usr/local/nagios/etc/objects/hadoop15.cfg
cfg_file=/usr/local/nagios/etc/objects/hadoop16.cfg
cfg_file=/usr/local/nagios/etc/objects/hadoop17.cfg
cfg_file=/usr/local/nagios/etc/objects/hadoop18.cfg

#引进监控项的文件
cfg_file=/usr/local/nagios/etc/objects/service1.cfg
cfg_file=/usr/local/nagios/etc/objects/service2.cfg
cfg_file=/usr/local/nagios/etc/objects/service3.cfg
cfg_file=/usr/local/nagios/etc/objects/service4.cfg
cfg_file=/usr/local/nagios/etc/objects/service5.cfg
cfg_file=/usr/local/nagios/etc/objects/service6.cfg
cfg_file=/usr/local/nagios/etc/objects/service7.cfg
cfg_file=/usr/local/nagios/etc/objects/service8.cfg
cfg_file=/usr/local/nagios/etc/objects/service9.cfg
cfg_file=/usr/local/nagios/etc/objects/service10.cfg
cfg_file=/usr/local/nagios/etc/objects/service11.cfg
cfg_file=/usr/local/nagios/etc/objects/service12.cfg
cfg_file=/usr/local/nagios/etc/objects/service13.cfg
cfg_file=/usr/local/nagios/etc/objects/service14.cfg
cfg_file=/usr/local/nagios/etc/objects/service15.cfg
cfg_file=/usr/local/nagios/etc/objects/service16.cfg
cfg_file=/usr/local/nagios/etc/objects/service17.cfg
cfg_file=/usr/local/nagios/etc/objects/service18.cfg
验证配置是否正确
$ pwd
/usr/local/nagios/etc

$ ../bin/nagios -v nagios.cfg

Nagios Core 4.1.1
Copyright (c) 2009-present Nagios Core Development Team and Community Contributors
Copyright (c) 1999-2009 Ethan Galstad
Last Modified: 08-19-2015
License: GPL

Website: https://www.nagios.org
Reading configuration data...
   Read main config file okay...
   Read object config files okay...

Running pre-flight check on configuration data...

Checking objects...
    Checked 161 services.
    Checked 18 hosts.
    Checked 18 host groups.
    Checked 18 service groups.
    Checked 1 contacts.
    Checked 1 contact groups.
    Checked 26 commands.
    Checked 5 time periods.
    Checked 0 host escalations.
    Checked 0 service escalations.
Checking for circular paths...
    Checked 18 hosts
    Checked 0 service dependencies
    Checked 0 host dependencies
    Checked 5 timeperiods
Checking global event handlers...
Checking obsessive compulsive processor commands...
Checking misc settings...

Total Warnings: 0
Total Errors:   0

Things look okay - No serious problems were detected during the pre-flight check
没有错误,这时就可以启动hadoop1上的nagios服务
$ /etc/init.d/nagios start
Starting nagios: done.
因为之前datanode上的nrpe已经启动了
测试hadoop1与datanode上nrpe通信是否正常
]$ for i in {10..28};do /usr/local/nagios/libexec/check_nrpe -H xx.xxx.x.$i;done
NRPE v2.15
NRPE v2.15
NRPE v2.15
NRPE v2.15
NRPE v2.15
NRPE v2.15
NRPE v2.15
NRPE v2.15
NRPE v2.15
NRPE v2.15
NRPE v2.15
NRPE v2.15
NRPE v2.15
NRPE v2.15
NRPE v2.15
NRPE v2.15
ok,通信正常,验证check_ganglia.py插件是否工作正常
$ /usr/local/nagios/libexec/check_ganglia.py -h a01 -m mem_free -w 200 -c 50
CHECKGANGLIA OK: mem_free is 61840868.00
工作正常,现在我们可以nagios的web页面,看是否监控成功。
localhost:8080/nagios

4.4 邮件报警配置
先检查服务器是否安装sendmail
$ rpm -q sendmail
$ yum install sendmail  #如果没有就安装sendmail
$ service sendmail restart  #重启sendmail
因为给外部发邮件,需要服务器自己有邮件服务器,这很麻烦并且非常占资源.这里我们配置一下,使用现有的STMP服务器
配置地址 /etc/mail.rc
$ vim /etc/mail.rc

set from=systeminformation@xxx.com
set smtp=mail.xxx.com smtp-auth-user=systeminformation smtp-auth-password=111111 smtp-auth=login
配置完毕之后,就可以先命令行测试一下,是否可以发邮件了
$ echo "hello world" |mail -s "test" pingjie@xxx.com
如果看你的邮件已经收到邮件了,说明sendmail已经没有问题.
下面配置nagios的邮件告警配置
$ vim /usr/local/nagios/etc/objects/contacts.cfg
define contact{
        contact_name                    nagiosadmin             ; Short name of user
        use                             generic-contact         ; Inherit default values from generic-contact template (defined above)
        alias                           Nagios Admin            ; Full name of user
        ## 告警时间段
        service_notification_period     24x7
        host_notification_period        24x7
        ## 告警信息格式
        service_notification_options    w,u,c,r,f,s
        host_notification_options       d,u,r,f,s
        ## 告警方式为邮件
        service_notification_commands   notify-service-by-email
        host_notification_commands      notify-host-by-email
        email                           pingjie@xxx.com       ; <<***** CHANGE THIS TO YOUR EMAIL ADDRESS ******
        }


# We only have one contact in this simple configuration file, so there is
# no need to create more than one contact group.

define contactgroup{
        contactgroup_name       admins
        alias                   Nagios Administrators
        members                 nagiosadmin
        }
至此配置全部完成
脚本监控hadoop进程
1.监控datanode的脚本
就是用python 读取HDFS页面,再正则匹配到Live Nodes这部分
 1 #!/usr/bin/env python
 2
 3 import commands
 4 import sys
 5 from optparse import OptionParser
 6 import urllib
 7 import re
 8
 9 def get_value():
10     urlItem = urllib.urlopen("http://namenode:50070/dfshealth.jsp")
11     html = urlItem.read()
12     urlItem.close()
13     return float(re.findall('.+Live Nodes</a> <td id="col2"> :<td id="col3">\\s+(\d+)\\s+\\(Decommissioned: \d+\\)<tr class="rowNormal">.+', html)[0])
14
15 if __name__ == '__main__':
16
17     parser = OptionParser(usage="%prog [-w] [-c]", version="%prog 1.0")
18     parser.add_option("-w", "--warning", type="int", dest="w", default=16)
19     parser.add_option("-c", "--critical", type="int", dest="c", default=15)
20     (options, args) = parser.parse_args()
21
22     if(options.c >= options.w):
23         print '-w must greater then -c'
24         sys.exit(1)
25
26     value = get_value()
27
28     if(value <= options.c ) :
29         print 'CRITICAL - Live Nodes %d' %(value)
30         sys.exit(2)
31     elif(value <= options.w):
32         print 'WARNING - Live Nodes %d' %(value)
33         sys.exit(1)
34     else:
35         print 'OK - Live Nodes %d' %(value)
36         sys.exit(0)
2.监控dfs空间:
#!/usr/bin/env python

import commands
import sys
from optparse import OptionParser
import urllib
import re

def get_dfs_free_percent():
    urlItem = urllib.urlopen("http://namenode:50070/dfshealth.jsp")
    html = urlItem.read()
    urlItem.close()
    return float(re.findall('.+<td id="col1"> DFS Remaining%<td id="col2"> :<td id="col3">\\s+(\d+\\.\d+)%<tr class="rowAlt">.+', html)[0])

if __name__ == '__main__':

    parser = OptionParser(usage="%prog [-w] [-c]", version="%prog 1.0")
    parser.add_option("-w", "--warning", type="int", dest="w", default=30, help="total dfs used percent")
    parser.add_option("-c", "--critical", type="int", dest="c", default=20, help="total dfs used percent")
    (options, args) = parser.parse_args()

    if(options.c >= options.w):
        print '-w must greater then -c'
        sys.exit(1)

    dfs_free_percent = get_dfs_free_percent()

    if(dfs_free_percent <= options.c ) :
        print 'CRITICAL - DFS free %d%%' %(dfs_free_percent)
        sys.exit(2)
    elif(dfs_free_percent <= options.w):
        print 'WARNING - DFS free %d%%' %(dfs_free_percent)
        sys.exit(1)
    else:
        print 'OK - DFS free %d%%' %(dfs_free_percent)
        sys.exit(0)
如果脚本出错,就进python命令行,根据html的结果调试一下正则部分即可
拷贝这2个脚本到/usr/local/nagios/etc/objects/
这2个脚本单独在命令行使用 ./check_hadoop_datanode.py 这种方式执行一下试试,如果报这个错
: No such file or directory
vim打开文件后,命令模式执行 :set ff=unix , 然后保存就行了
3. 修改nagios配置
commands.cfg 增加如下2个command
$ vim /usr/local/nagios/etc/objects/commands.cfg
define command{
        command_name    check_datanode
        command_line    $USER1$/check_hadoop_datanode.py -w $ARG1$ -c $ARG2$
        }

define command{
        command_name    check_dfs
        command_line    $USER1$/check_hadoop_dfs.py -w $ARG1$ -c $ARG2$
        }
修改server1.cfg,增加如下2个service
$ vim service1.cfg
define service{
        use     ganglia-service1
        service_description     datanode存活个数
        check_command   check_datanode!16!15
}


define service{
        use     ganglia-service1
        service_description     dfs剩余空间
        check_command   check_dfs!30!20
}
完成
五问题记录
5.1 ganglia监控的指标有问题
问题描述:为了测试nagios报警功能,然后我就kill了一个节点的datanode,但是看nagios上一直显示这个datanode是正常的.因为nagios这些指标是从ganglia来的,于是就找到ganglia上,发现也是正常的.这个问题就很奇怪了,为啥datanode已经kill了还一直发心跳
解决方案:没有,有知道的请赐教。曲线救国,nagios使用脚本方式监控进程

 浙公网安备 33010602011771号