图神经网络GNN:创建图和展示图
'''
摘自https://docs.dgl.ai/en/0.6.x/guide_cn/graph-graphs-nodes-edges.html
'''
import dgl
import torch as th
import networkx as nx
import matplotlib.pyplot as plt
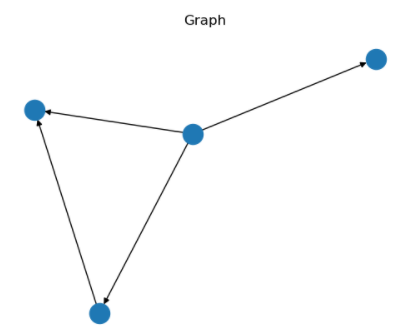
# 边 0->1, 0->2, 0->3, 1->3
u, v = th.tensor([0, 0, 0, 1]), th.tensor([1, 2, 3, 3])
graph = dgl.graph((u, v))
fig, ax = plt.subplots()
nx.draw(graph.to_networkx(), ax=ax) # 将图转为networkx形式
ax.set_title('Graph')
plt.show()
结果:

 浙公网安备 33010602011771号