pytorch lstm 预测航空旅客数目
airflights passengers dataset下载地址https://raw.githubusercontent.com/jbrownlee/Datasets/master/airline-passengers.csv
这个dataset包含从1949年到1960年每个月的航空旅客数目,共12*12=144个数字。
下面的程序中,我们以1949-1952的数据预测1953的数据,以1950-1953的数据预测1954的数据,以此类推,训练模型。
import numpy as np
import matplotlib.pyplot as plt
import pandas as pd
import torch
import torch.nn as nn
from sklearn.preprocessing import MinMaxScaler
import os
# super parameters
EPOCH = 400
learning_rate = 0.01
seq_length = 4 # 序列长度
n_feature = 12 # 序列中每个元素的特征数目。本程序采用的序列元素为一年的旅客,一年12个月,即12维特征。
# data
data = pd.read_csv('airline-passengers.csv') # 共 "12年*12个月=144" 个数据
data = data.iloc[:, 1:5].values # dataFrame, shape (144,1)
data = np.array(data).astype(np.float32)
sc = MinMaxScaler()
data = sc.fit_transform(data) # 归一化
data = data.reshape(-1, n_feature) # shape (12, 12)
trainData_x = []
trainData_y = []
for i in range(data.shape[0]-seq_length):
tmp_x = data[i:i+seq_length, :]
tmp_y = data[i+seq_length, :]
trainData_x.append(tmp_x)
trainData_y.append(tmp_y)
# model
class Net(nn.Module):
def __init__(self, in_dim=12, hidden_dim=10, output_dim=12, n_layer=1):
super(Net, self).__init__()
self.in_dim = in_dim
self.hidden_dim = hidden_dim
self.output_dim = output_dim
self.n_layer = n_layer
self.lstm = nn.LSTM(input_size=in_dim, hidden_size=hidden_dim, num_layers=n_layer, batch_first=True)
self.linear = nn.Linear(hidden_dim, output_dim)
def forward(self, x):
_, (h_out, _) = self.lstm(x) # h_out是序列最后一个元素的hidden state
# h_out's shape (batchsize, n_layer*n_direction, hidden_dim), i.e. (1, 1, 10)
# n_direction根据是“否为双向”取值为1或2
h_out = h_out.view(h_out.shape[0], -1) # h_out's shape (batchsize, n_layer * n_direction * hidden_dim), i.e. (1, 10)
h_out = self.linear(h_out) # h_out's shape (batchsize, output_dim), (1, 12)
return h_out
train = True
if train:
model = Net()
loss_func = torch.nn.MSELoss()
optimizer = torch.optim.Adam(model.parameters(), lr=learning_rate)
# train
for epoch in range(EPOCH):
total_loss = 0
for iteration, X in enumerate(trainData_x): # X's shape (seq_length, n_feature)
X = torch.tensor(X).float()
X = torch.unsqueeze(X, 0) # X's shape (1, seq_length, n_feature), 1 is batchsize
output = model(X) # output's shape (1,12)
output = torch.squeeze(output)
loss = loss_func(output, torch.tensor(trainData_y[iteration]))
optimizer.zero_grad() # clear gradients for this training iteration
loss.backward() # computing gradients
optimizer.step() # update weights
total_loss += loss
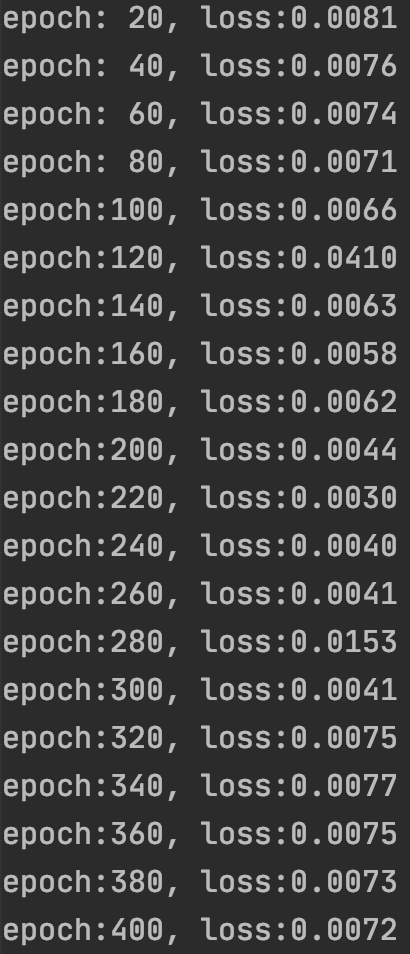
if (epoch+1) % 20 == 0:
print('epoch:{:3d}, loss:{:6.4f}'.format(epoch+1, total_loss.data.numpy()))
# torch.save(model, 'flight_model.pkl') # 这样保存会弹出UserWarning,建议采用下面的保存方法,详情可参考https://zhuanlan.zhihu.com/p/129948825
torch.save({'state_dict': model.state_dict()}, 'checkpoint.pth.tar')
else:
# model = torch.load('flight_model.pth')
model = Net()
checkpoint = torch.load('checkpoint.pth.tar')
model.load_state_dict(checkpoint['state_dict'])
# predict
model.eval()
predict = []
for X in trainData_x: # X's shape (seq_length, n_feature)
X = torch.tensor(X).float()
X = torch.unsqueeze(X, 0) # X's shape (1, seq_length, n_feature), 1 is batchsize
output = model(X) # output's shape (1,12)
output = torch.squeeze(output)
predict.append(output.data.numpy())
# plot
plt.figure()
predict = np.array(predict)
predict = predict.reshape(-1, 1).squeeze()
x_tick = np.arange(len(predict)) + (seq_length*n_feature)
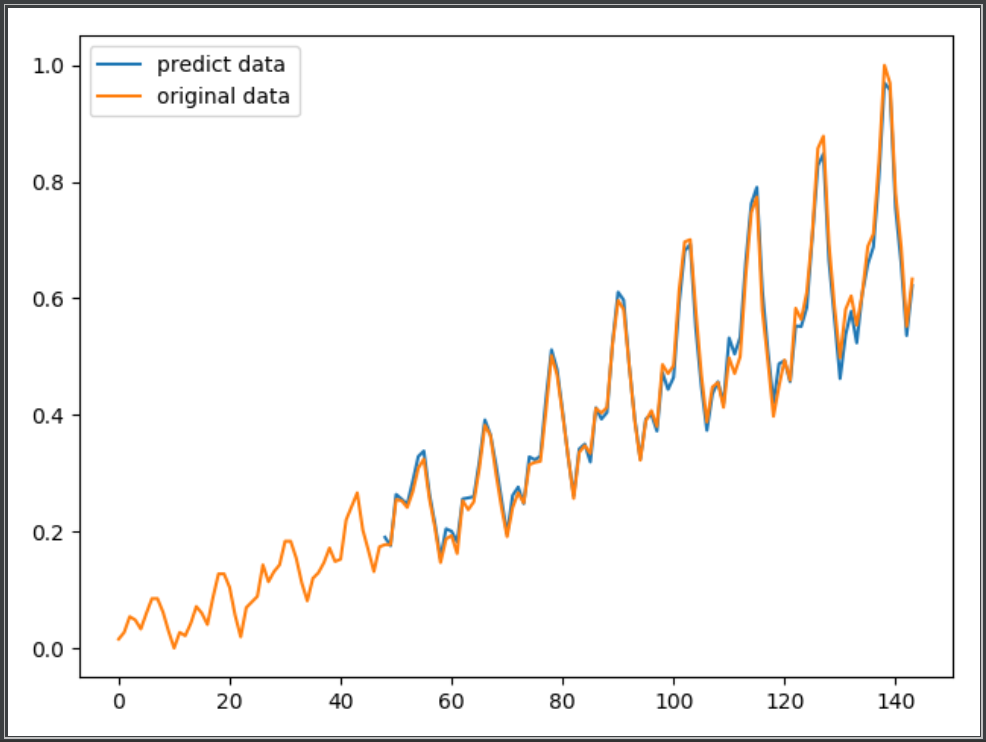
plt.plot(list(x_tick), predict, label='predict data')
data_original = data.reshape(-1, 1).squeeze()
plt.plot(range(len(data_original)), data_original, label='original data')
plt.legend(loc='best')
plt.show()
运行结果:

 浙公网安备 33010602011771号