
Matlab regression
% linear regression
% least squares fitting a straight line
load LinearRegressData.mat
plot(x,y,'.')
X=[ones(size(x)),x];
a=X\y
a =
5.2745
0.9950
clear
load jump.mat
plot(x,y,'.')
X=[ones(size(x)),x];
a=X\y
a =
-0.0095
0.7465
Y=-0.0095 + 0.7465*x;
plot(x,Y,'.')
x1=x;
x2=x.^2;
x3=x.^3;
X=[ones(size(x)),x1,x2,x3];
a=X\y
a =
-0.0226
1.3906
0.0389
-1.0536
yp=X*a;
plot(x,y,'o',x,yp,'-')
% weighted factors in linear regression
hold on
indx=find(x>0);
X(indx,:)=X(indx,:)/10;
yw=y;
yw(indx)=yw(indx)/10;
aw=X\yw;
ypw=aw(1)+aw(2)*x;
plot(x,ypw,'g-')
clear
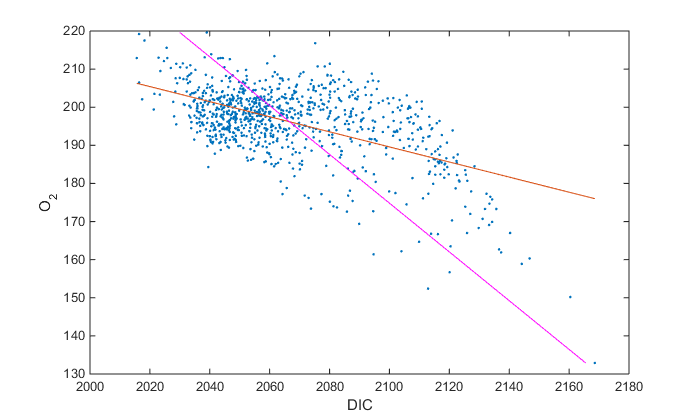
load DIC_O2.mat
x=DIC;
y=O2;
plot(x,y,'.')
xlabel('DIC')
ylabel('O_2')
X=[ones(size(x)),x];
a=X\y;
hold on
yp=X*a;
plot(x,yp,'-')
X=[ones(size(x)),x];
Y=[ones(size(x)),y];
b=Y\x;
xp=Y*b;
plot(xp,y,'m-')
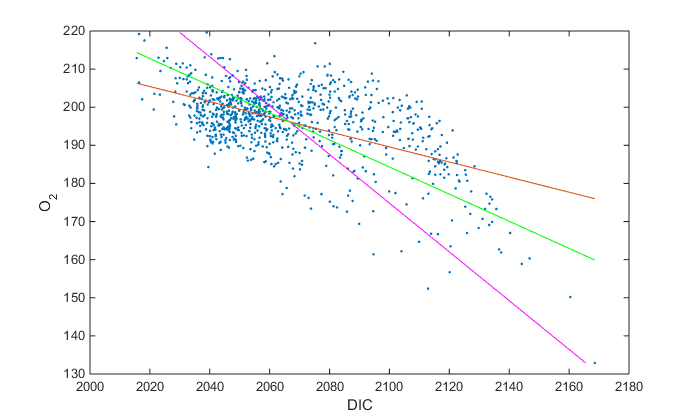
>> % type 2 regression
>> c(2)=sqrt(a(2)/b(2))
c =
0 0.3559
>> c(2)=-c(2)
c =
0 -0.3559
>> c(1)=mean(y)-c(2)*mean(x)
c =
931.6370 -0.3559
>> yII=c(1)+c(2)*x;
>> plot(x,yII,'g-')
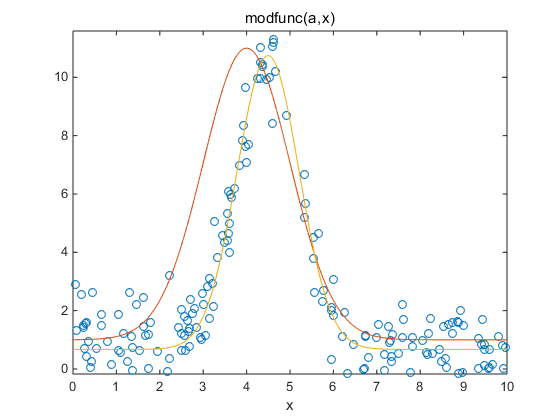
% multidimensional regression
function y=modfunc(a,x)
y=a(1)+a(2)*exp(-(x-a(3)).^2./(2.*a(4).^2));
>> load gauss_data.mat
>> plot(x,y,'o')
>> a0=[1,10,4,1];
>> hold on
>> ezplot(@(x)modfunc(a0,x),[0,10])
>> a=nlinfit(x,y,@modfunc,a0)

a =

    0.6731   10.0709    4.4948    0.7142

>> ezplot(@(x)modfunc(a,x),[0,10])
>> [a,R,J,CovB]=nlinfit(x,y,@modfunc,a0);
>> err=sqrt(diag(CovB))
err =
0.0828
0.2318
0.0216
0.0202

 浙公网安备 33010602011771号