matplotlib直方图
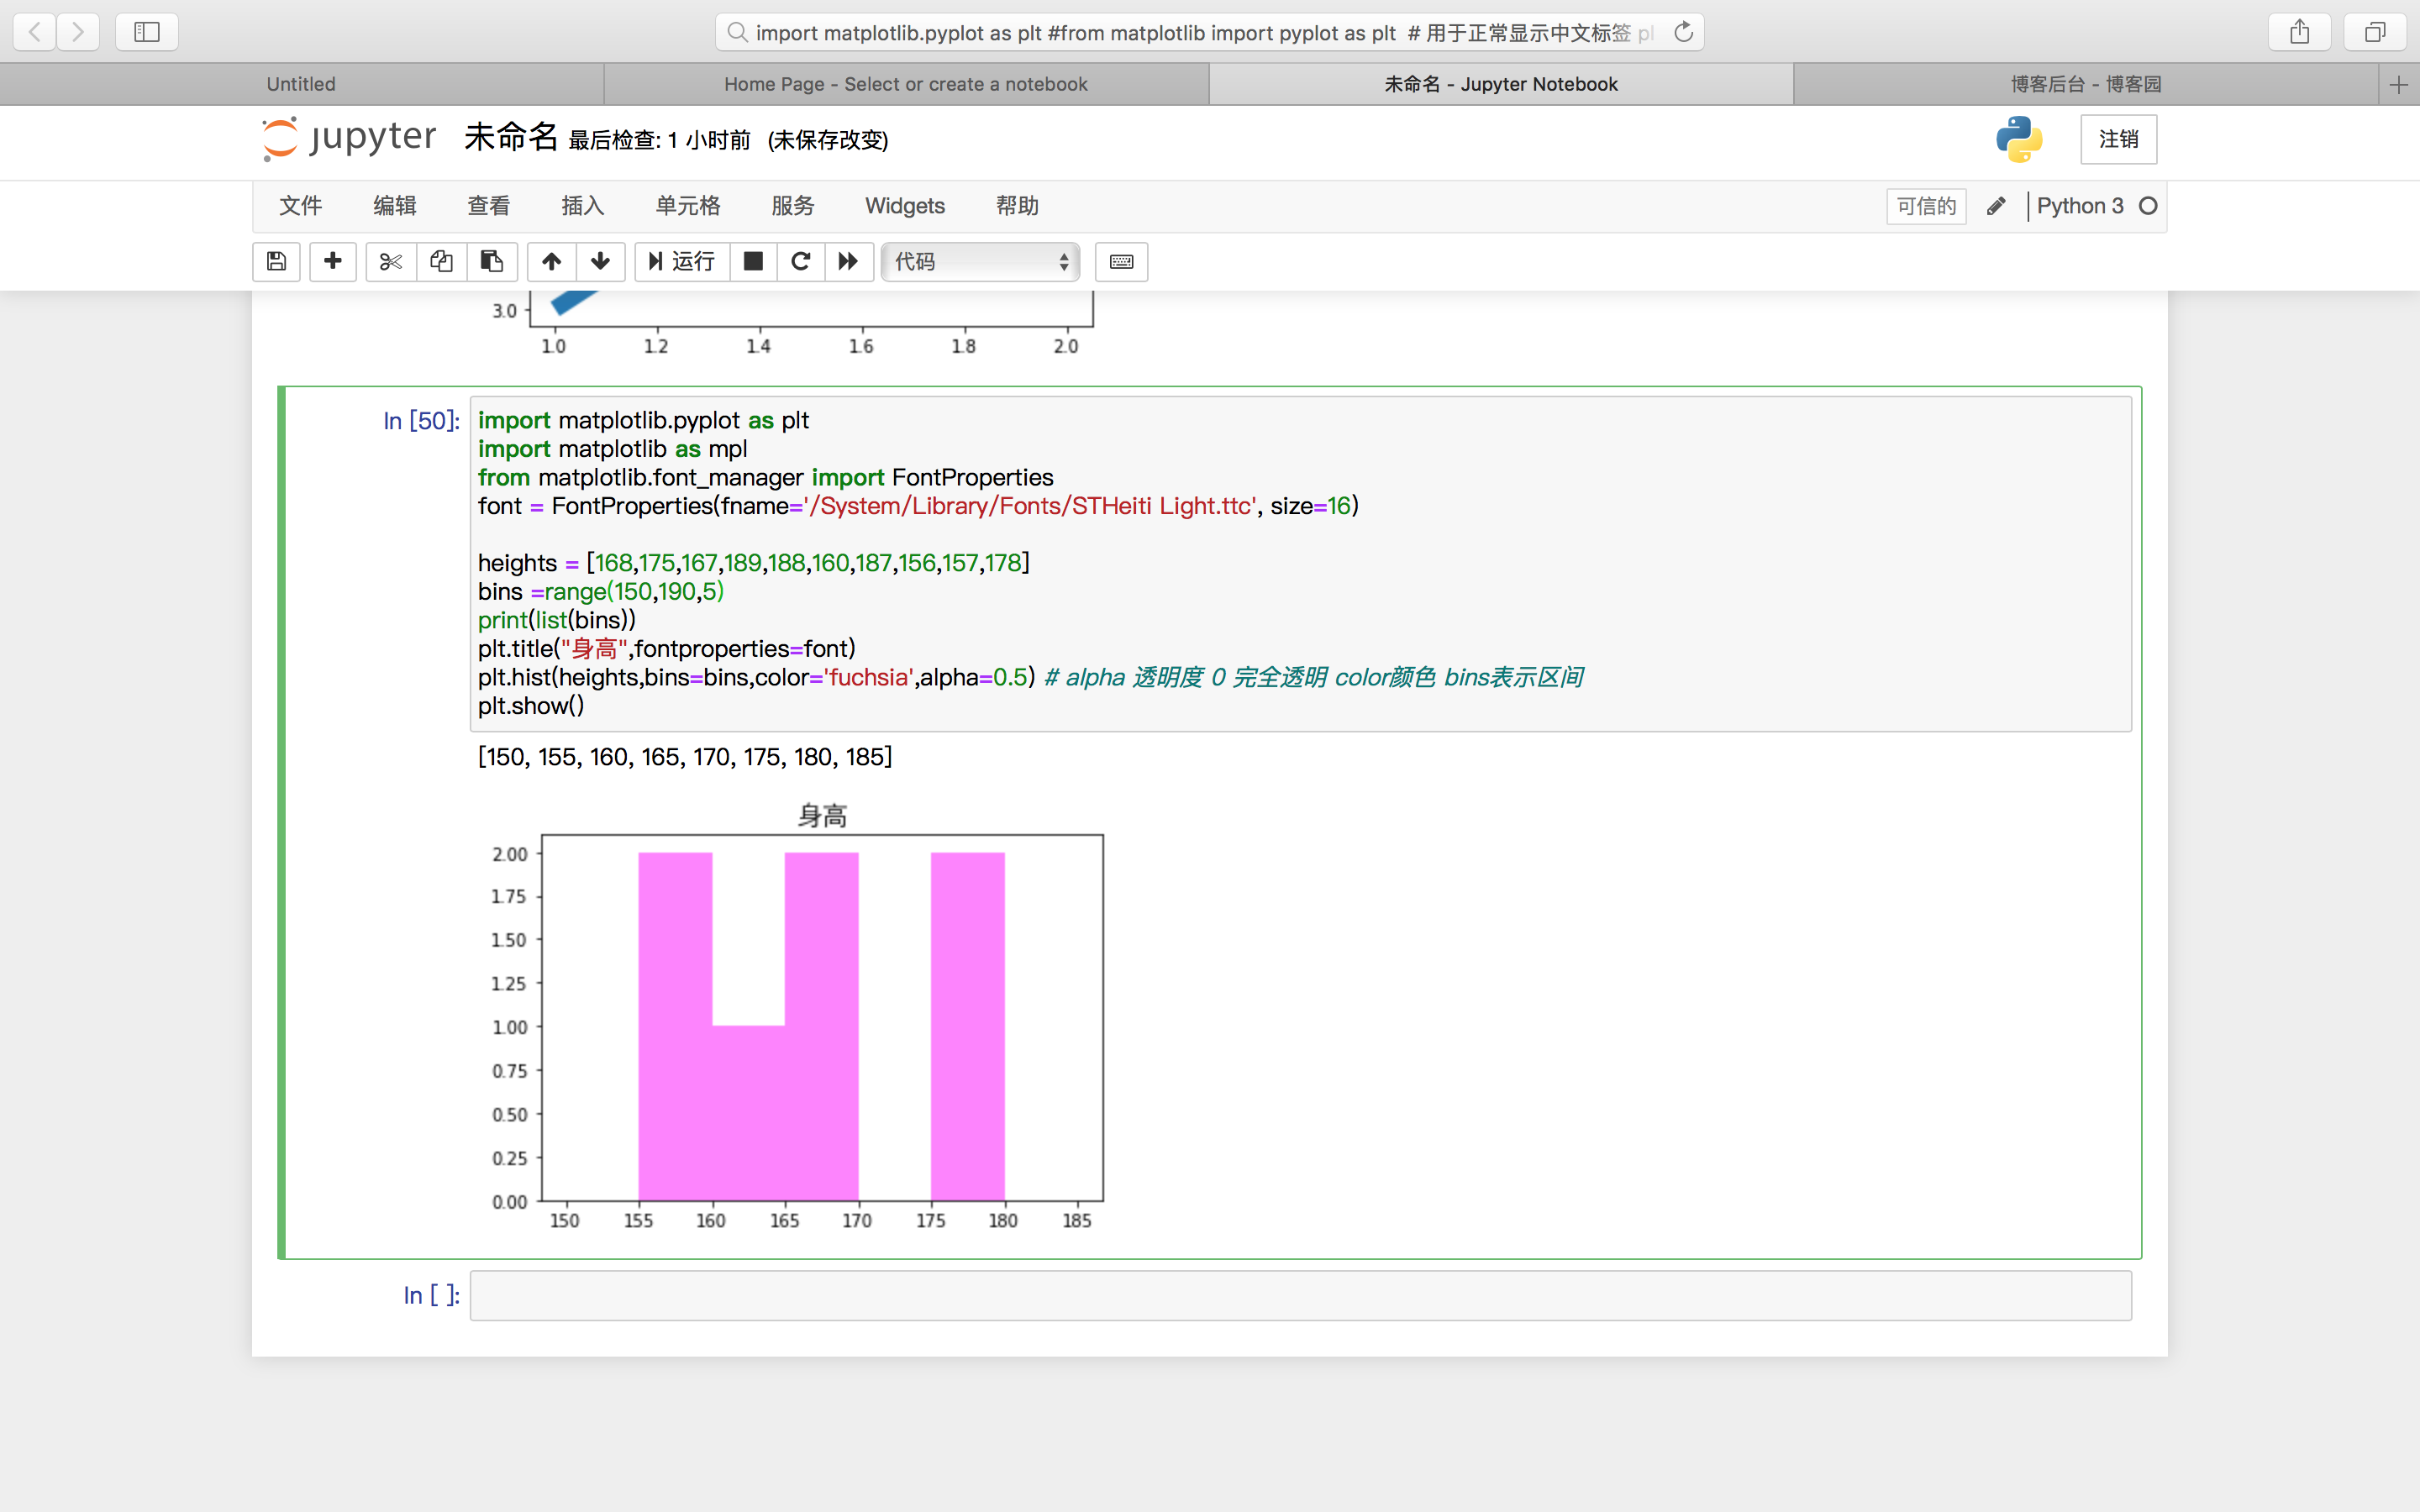
import matplotlib.pyplot as plt
import matplotlib as mpl
from matplotlib.font_manager import FontProperties
font = FontProperties(fname='/System/Library/Fonts/STHeiti Light.ttc', size=16)

heights = [168,175,167,189,188,160,187,156,157,178]
bins =range(150,190,5)
print(list(bins))
plt.title("身高",fontproperties=font)
plt.hist(heights,bins=bins,color='fuchsia',alpha=0.5) # alpha 透明度 0 完全透明 color颜色 bins表示区间
plt.show()

 浙公网安备 33010602011771号