SRE deep dive into Linux Page Cache
来源:https://biriukov.dev/docs/page-cache/0-linux-page-cache-for-sre/
In this series of articles, I would like to talk about Linux Page Cache. I believe that the following knowledge of the theory and tools is essential and crucial for every SRE. This understanding can help both in usual and routine everyday DevOps-like tasks and in emergency debugging and firefighting. Page Cache is often left unattended, and its better understanding leads to the following:
- more precise capacity planning and container limit calculations;
- better debugging and investigation skills for memory and disk intensive applications such as database management system and file sharing storages;
- building safe and predictable runtimes for memory and/or IO-bound ad-hoc tasks (for instance: backups and restore scripts, rsync one-liners, etc.).
I’ll display what utils you should keep in mind when you’re dealing with Page Cache related tasks and problems, how to use them properly to understand real memory usage, and how to reveal issues with them. I will try to give you some examples of using these tools that are close to real life situations. Here are some of these tools I’m talking about below: vmtouch, perf, cgtouch, strace , sar and page-type.
Also, as the title says, “deep dive”, the internals of these utils will be shown with an emphasis on the Page Cache stats, events, syscalls and kernel interfaces. Here are some examples of what I’m touching on in the following post:
- procfs files: /proc/PID/smaps, /proc/pid/pagemap, /proc/kpageflags, /proc/kpagecgroup and sysfs file: /sys/kernel/mm/page_idle;
- system calls: mincore(), mmap(), fsync(), msync(), posix_fadvise(), madvise() and others;
- different open and advise flags O_SYNC, FADV_DONTNEED, POSIX_FADV_RANDOM, MADV_DONTNEED, etc.
I’ll try to be as verbose as possible with simple (almost all the way) code examples in Python, Go and a tiny bit of C.
And finally, any conversations about modern GNU/Linux systems can’t be fully conducted without touching the cgroup (v2 in our case) and the systemd topics. I’ll show you how to leverage them to get the most out of the systems, build reliable, well-observed, controlled services, and sleep well at night while on-call.
Readers should be confident if they have middle GNU/Linux knowledge and basic programming skills.
All code examples larger than 5 lines can be found on github: https://github.com/brk0v/sre-page-cache-article.
Prepare environment for experiments
Before starting, I want to be on the same page with the reader so that any example or code snippet can be executed, compiled, and checked. Therefore we need a modern GNU/Linux installation to play with code and kernel.
If you are using Windows or Mac OS, I would suggest installing Vagrant with Virtual Box. For the GNU/Linux distributive, I’d like to use Arch Linux. Arch is a good example of an actual modern version of the GNU/Linux system (BTW, I use Arch Linux). It supports the latest kernels, systemd and cgroup v2.
If you’re already on Linux, you know what to do 😉.
Can I use docker?
Unfortunately, no. We need a system where we can go nuts and play around with cgroup limits, debug programs with low-level tools and run code as a root user without any limitations.
So below, I’m showing all you need to install on Arch.
Arch Linux provisioning #
When you get your Arch running, please update it and install the following packages:
$ pacman -Sy git, base-devel, go
We need to install yay (https://github.com/Jguer/yay) in order to be able to setup software from community-driven repositories:
$ cd ~
$ git clone https://aur.archlinux.org/yay.git
$ cd yay
$ makepkg -si
Install vmtouch tool from aur:
$ yay -Sy vmtouch
We will need page-type tool from the kernel repo, so the easiest way to install it is to download the linux kernel release and make it manually:
$ mkdir kernel
$ cd kernel
$ wget https://git.kernel.org/pub/scm/linux/kernel/git/torvalds/linux.git/snapshot/linux-5.14.tar.gz
$ tar -xzf linux-5.14.tar.gz
$ cd linux-5.14/tools/vm
$ make
$ sudo make install
Now we are almost ready. We need to generate a test data file, which will be used in our experiments with Page Cache:
$ dd if=/dev/random of=/var/tmp/file1.db count=128 bs=1M
And the final step is dropping all linux caches in order to get a clean box:
$ sync; echo 3 | sudo tee /proc/sys/vm/drop_caches
Essential Page Cache theory
First of all, let’s start with a bunch of reasonable questions about Page Cache:
- What is the Linux Page Cache?
- What problems does it solve?
- Why do we call it «Page» Cache ?
In essence, the Page Cache is a part of the Virtual File System (VFS) whose primary purpose, as you can guess, is improving the IO latency of read and write operations. A write-back cache algorithm is a core building block of the Page Cache.
NOTE
If you’re curious about the write-back algorithm (and you should be), it’s well described on Wikipedia, and I encourage you to read it or at least look at the figure with a flow chart and its main operations.
“Page” in the Page Cache means that linux kernel works with memory units called pages. It would be cumbersome and hard to track and manage bites or even bits of information. So instead, Linux’s approach (and not only Linux’s, by the way) is to use pages (usually 4K in length) in almost all structures and operations. Hence the minimal unit of storage in Page Cache is a page, and it doesn’t matter how much data you want to read or write. All file IO requests are aligned to some number of pages.
The above leads to the important fact that if your write is smaller than the page size, the kernel will read the entire page before your write can be finished.
The following figure shows a bird’s-eye view of the essential Page Cache operations. I broke them down into reads and writes.
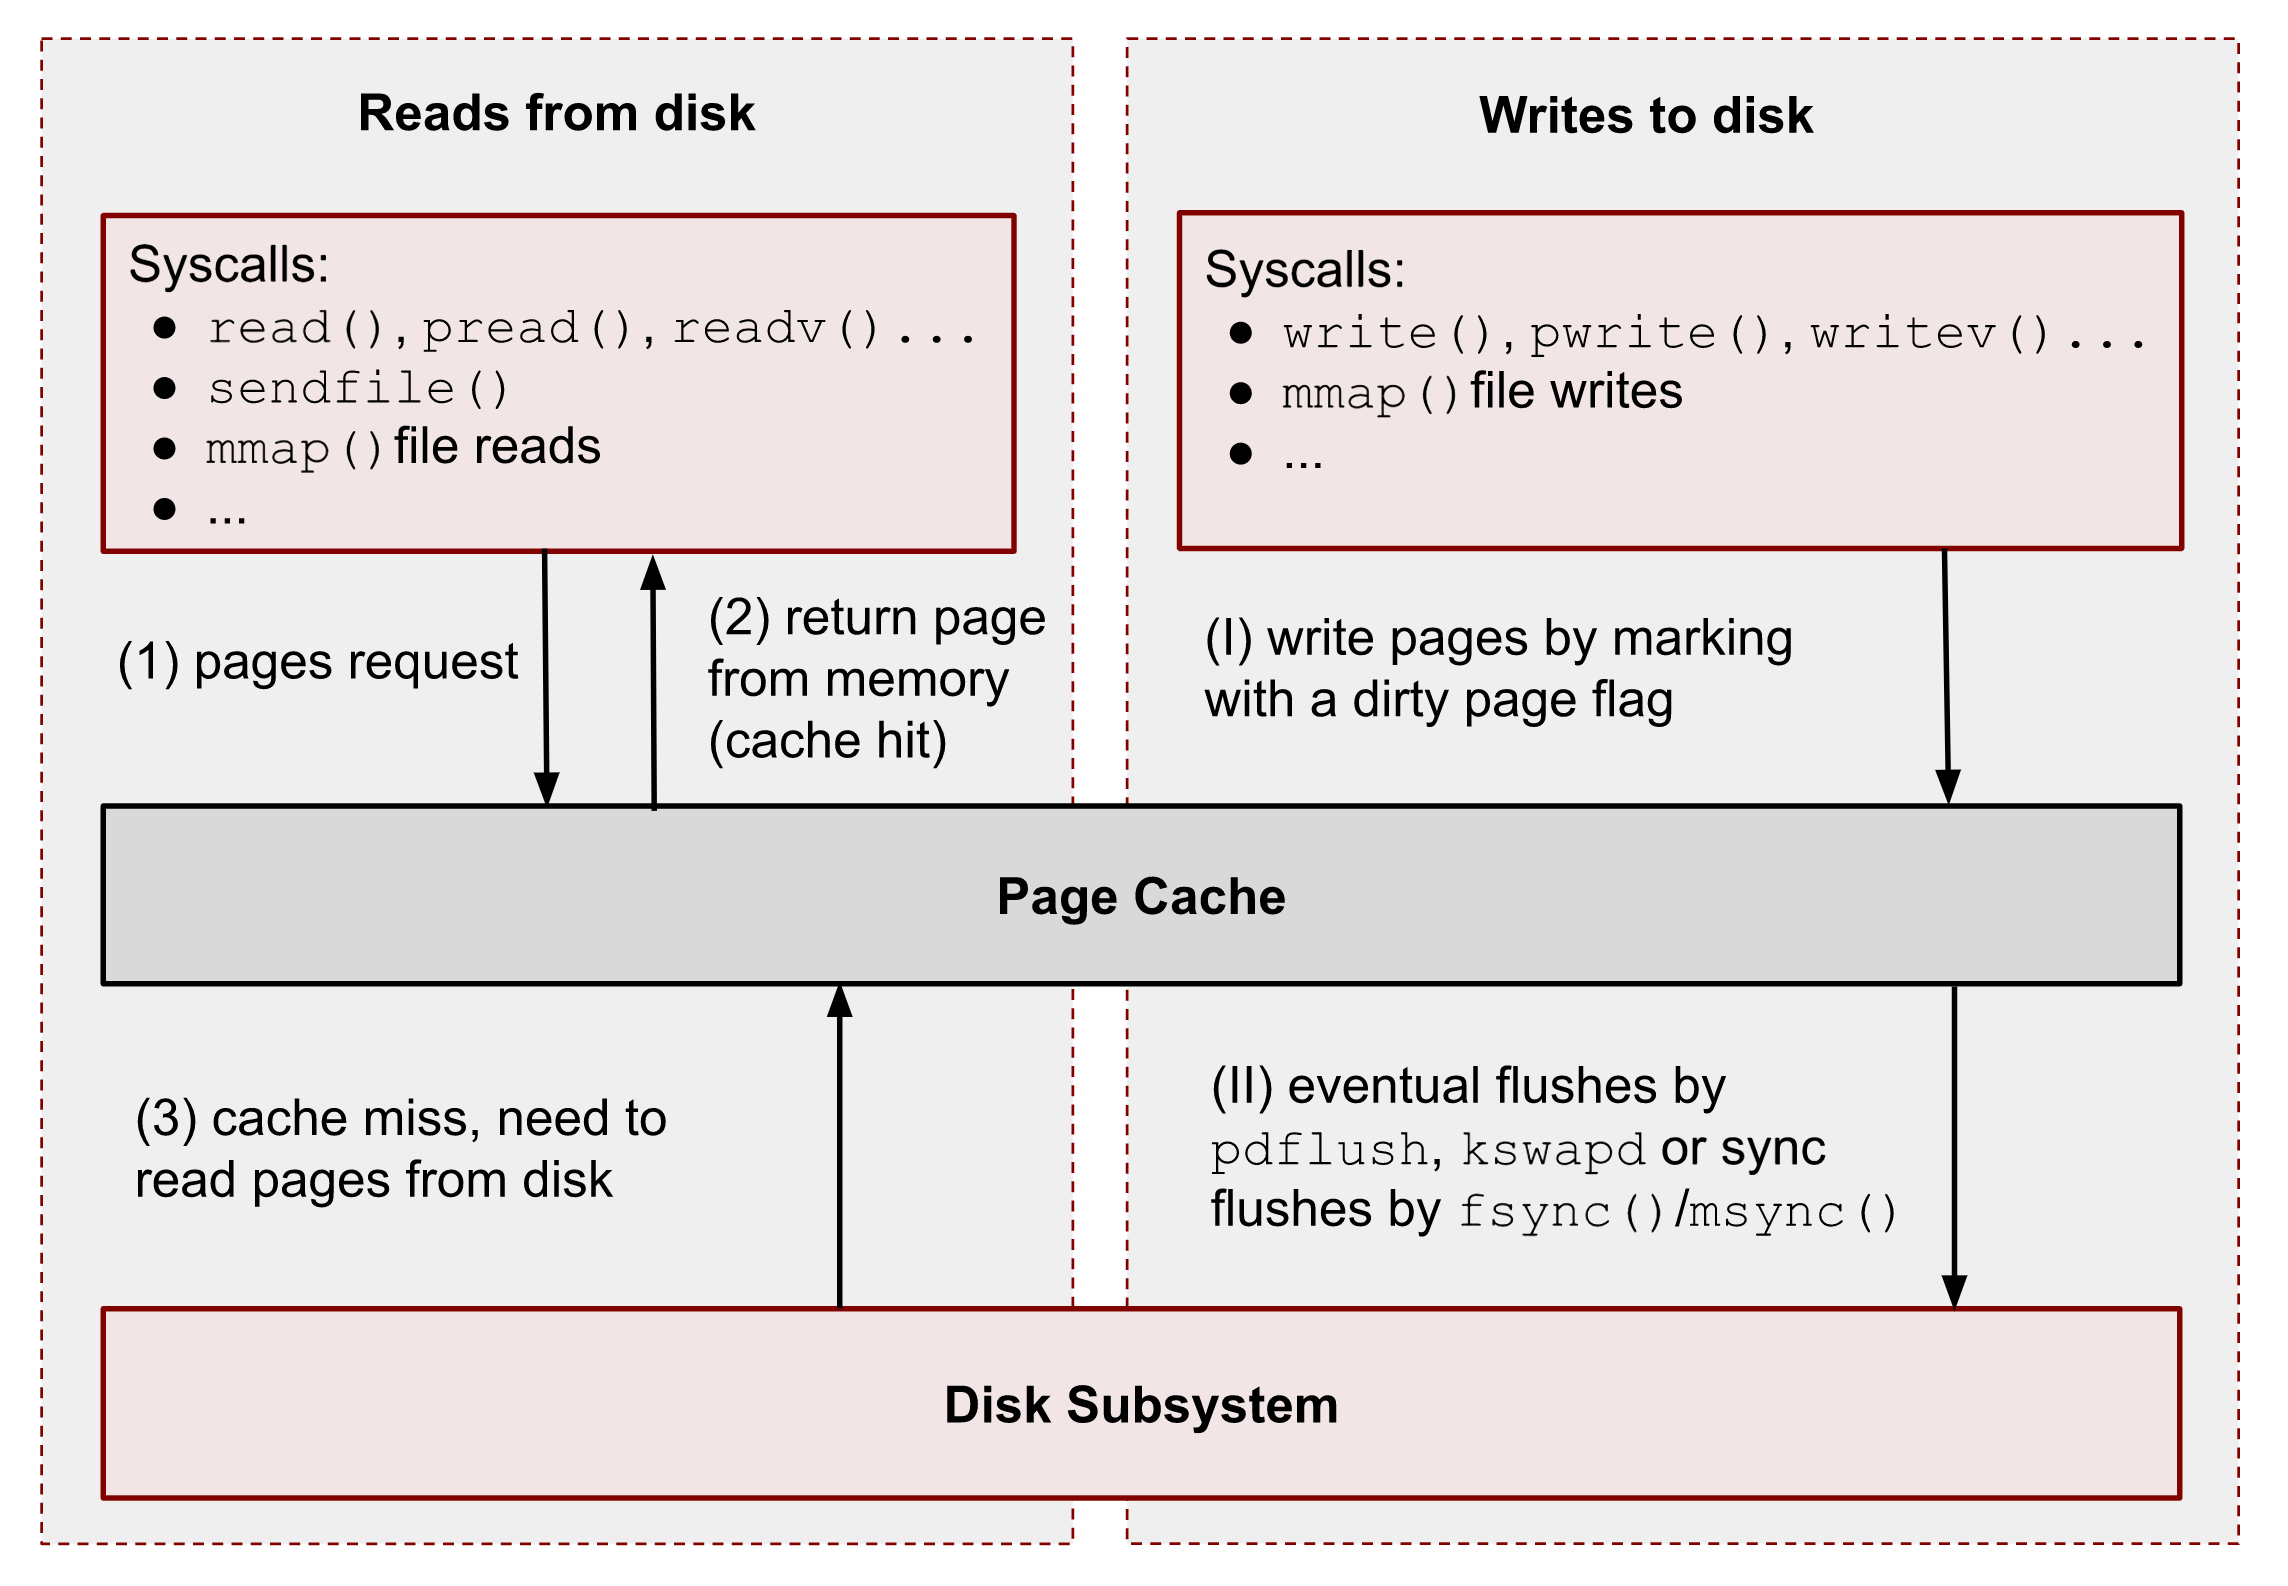
As you can see, all data reads and writes go through Page Cache. However, there are some exceptions for Direct IO (DIO), and I’m talking about it at the end of the series. For now, we should ignore them.
NOTE
In the following chapters, I’m talking about read(), write(), mmap() and other syscalls. And I need to say, that some programming languages (for example, Python) have file functions with the same names. However, these functions don’t map exactly to the corresponding system calls. Such functions usually perform buffered IO. Please, keep this in mind.
Read requests
Generally speaking, reads are handled by the kernel in the following way:
① – When a user-space application wants to read data from disks, it asks the kernel for data using special system calls such as read(), pread(), vread(), mmap(), sendfile(), etc.
② – Linux kernel, in turn, checks whether the pages are present in Page Cache and immediately returns them to the caller if so. As you can see kernel has made 0 disk operations in this case.
③ – If there are no such pages in Page Cache, the kernel must load them from disks. In order to do that, it has to find a place in Page Cache for the requested pages. A memory reclaim process must be performed if there is no free memory (in the caller’s cgroup or system). Afterward, kernel schedules a read disk IO operation, stores the target pages in the memory, and finally returns the requested data from Page Cache to the target process. Starting from this moment, any future requests to read this part of the file (no matter from which process or cgroup) will be handled by Page Cache without any disk IOP until these pages have not been evicted.
Write requests
Let’s repeat a step-by-step process for writes:
(Ⅰ) – When a user-space program wants to write some data to disks, it also uses a bunch of syscalls, for instance: write(), pwrite(), writev(), mmap(), etc. The one big difference from the reads is that writes are usually faster because real disk IO operations are not performed immediately. However, this is correct only if the system or a cgroup doesn’t have memory pressure issues and there are enough free pages (we will talk about the eviction process later). So usually, the kernel just updates pages in Page Cache. it makes the write pipeline asynchronous in nature. The caller doesn’t know when the actual page flush occurs, but it does know that the subsequent reads will return the latest data. Page Cache protects data consistency across all processes and cgroups. Such pages, that contain un-flushed data have a special name: dirty pages.
(II) – If a process’ data is not critical, it can lean on the kernel and its flush process, which eventually persists data to a physical disk. But if you develop a database management system (for instance, for money transactions), you need write guarantees in order to protect your records from a sudden blackout. For such situations, Linux provides fsync(), fdatasync() and msync() syscalls which block until all dirty pages of the file get committed to disks. There are also open() flags: O_SYNC and O_DSYNC, which you also can use in order to make all file write operations durable by default. I’m showing some examples of this logic later.
Page Cache and basic file operations
Now it’s time to roll up our sleeves and get started with some practical examples. By the end of this chapter, you will know how to interact with Page Cache and which tools you can use.
Utils needed for this section:
- sync (man 1 sync) – a tool to flush all dirty pages to persistent storage;
- /proc/sys/vm/drop_caches (man 5 proc) – the kernel procfs file to trigger Page Cache clearance;
- vmtouch – a tool for getting Page Cache info about a particular file by its path.
NOTE For now, we ignore how vmtouch works. I’m showing how to write an alternative with almost all its features later.
File reads
Reading files with read() syscall #
I start with a simple program that reads the first 2 bytes from our test file /var/tmp/file1.db.
with open("/var/tmp/file1.db", "br") as f:
    print(f.read(2))
Usually, these kinds of read requests are translated into the read() syscall. Let’s run the script with strace (man 1 strace) to make sure that f.read() uses read() syscall:
$ strace -s0 python3 ./read_2_bytes.py
The output should look something like this:
...
openat(AT_FDCWD, "./file1.db", O_RDONLY|O_CLOEXEC) = 3
...
read(3, "%B\353\276\0053\356\346Nfy2\354[&\357\300\260%D6$b?'\31\237_fXD\234"..., 4096) = 4096
...
NOTE
The read() syscall returned 4096 bytes (one page) even though the script asked only for 2 bytes. It’s an example of python optimizations and internal buffered IO. Although this is beyond the scope of this post, but in some cases it is important to keep this in mind.
Now let’s check how much data the kernel’s cached. In order to get this info, we use vmtouch:
$ vmtouch /var/tmp/file1.db

           Files: 1       LOOK HERE
     Directories: 0          ⬇
  Resident Pages: 20/32768  80K/128M  0.061%
         Elapsed: 0.001188 seconds
From the output, we can see that instead of 2B of data that Python’s asked for, the kernel has cached 80KiB or 20 pages.
By design, the kernel can’t load anything less than 4KiB or one page into Page Cache, but what about the other 19 pages? It is a excellent example of the kernel’s read ahead logic and preference to perform sequential IO operations over random ones. The basic idea is to predict the subsequent reads and minimize the number of disks seeks. Syscalls can control this behavior: posix_fadvise() (man 2 posix_fadvise) and readahead() (man 2 readahead).
NOTE
Usually, it doesn’t make a big difference for database management systems and storages to tune the default read-ahead parameters in a production environment. If DBMS doesn’t need data that were cached by the read-ahead, the kernel memory reclaim policy should eventually evict these pages from Page Cache. And usually, the sequential IO is not expensive for kernel and hardware. Disabling read-ahead at all might even lead to some performance degradations due to increased number of disk IO operations in the kernel queues, more context switches and more time for kernel memory management subsystem to recognize the working set. We will talk about memory reclaiming policy, memory pressure, and cache writeback later in this series.
Let’s now use posix_fadvise() to notify the kernel that we are reading the file randomly, and thus we don’t want to have any read ahead features:
import os

with open("/var/tmp/file1.db", "br") as f:
    fd = f.fileno()
    os.posix_fadvise(fd, 0, os.fstat(fd).st_size, os.POSIX_FADV_RANDOM)
    print(f.read(2))
Before running the script, we need to drop all caches:
$ echo 3 | sudo tee /proc/sys/vm/drop_caches && python3 ./read_2_random.py
And now, if you check the vmtouch output, you can see that there is only one page as expected:
$ vmtouch /var/tmp/file1.db

           Files: 1     LOOK HERE
     Directories: 0        ⬇
  Resident Pages: 1/32768  4K/128M  0.00305%
         Elapsed: 0.001034 seconds
Reading files with mmap() syscall
For reading data from files we can also use mmap() syscall (man 2 mmap). mmap() is a “magic” tool and can be used to solve a wide range of tasks. But for our tests, we need only one of its features – an ability to map a file into a process memory in order to access the file as a flat array. I’m talking about mmap() in more detail later. But at the moment, if you are not familiar with it, mmap() API should be clear from the following example:
import mmap

with open("/var/tmp/file1.db", "r") as f:
    with mmap.mmap(f.fileno(), 0, prot=mmap.PROT_READ) as mm:
        print(mm[:2])
The above code does the same as we’ve just done with read() syscall. It reads the first 2 bytes of the file.
Also, for test purposes, we need to flush all caches before the script should be executed:
$ echo 3 | sudo tee /proc/sys/vm/drop_caches && python3 ./read_2_mmap.py
And checking the Page Cache content:
$ vmtouch /var/tmp/file1.db

           Files: 1.       LOOK HERE
     Directories: 0           ⬇
  Resident Pages: 1024/32768  4M/128M  3.12%
         Elapsed: 0.000627 seconds
As you can see, mmap() has performed an even more aggressive readahead.
Let’s change the readahead with madvise() syscall like we did with fadvise().
import mmap

with open("/var/tmp/file1.db", "r") as f:
    with mmap.mmap(f.fileno(), 0, prot=mmap.PROT_READ) as mm:
        mm.madvise(mmap.MADV_RANDOM)
        print(mm[:2])
Run it:
$ echo 3 | sudo tee /proc/sys/vm/drop_caches && python3 ./read_2_mmap_random.py
and Page Cache content:
$ vmtouch /var/tmp/file1.db

           Files: 1     LOOK HERE
     Directories: 0        ⬇
  Resident Pages: 1/32768  4K/128M  0.00305%
         Elapsed: 0.001077 seconds
As you can see from the above output, with the MADV_RANDOM flag, we managed to achieve exactly one page read from disk and thus one page in Page Cache.
File writes
Now let’s play with writes.
Writing to files with write() syscall #
Let’s continue working with our experimental file and try to update the first 2 bytes instead:
with open("/var/tmp/file1.db", "br+") as f:
    print(f.write(b"ab"))
NOTE
Be careful, and don’t open a file with w mode. It will rewrite your file with 2 bytes. We need r+ mode.
Drop all caches and run the above script:
sync; echo 3 | sudo tee /proc/sys/vm/drop_caches && python3 ./write_2_bytes.py
Now let’s check the content of the Page Cache.
$ vmtouch /var/tmp/file1.db
           Files: 1     LOOK HERE
     Directories: 0        ⬇
  Resident Pages: 1/32768  4K/128M  0.00305%
         Elapsed: 0.000674 seconds
As you can see, we have 1 page cached after only 2B write. It’s an important observation because if your writes are smaller than a page size, you will have 4KiB reads before your writes in order to populate Page Cache.
Also, we can check dirty pages by reading the current cgroup memory stat file.
Get a current terminal cgroup:
$ cat /proc/self/cgroup
0::/user.slice/user-1000.slice/session-4.scope

$ grep dirty /sys/fs/cgroup/user.slice/user-1000.slice/session-3.scope/memory.stat
file_dirty 4096
If you see 0, run the script one more time, you apparently get lucky, and the dirty pages have already been written to disk.
File writes with mmap() syscall #
Let’s now replicate the write with mmap():
import mmap

with open("/var/tmp/file1.db", "r+b") as f:
    with mmap.mmap(f.fileno(), 0) as mm:
        mm[:2] = b"ab"
You can repeat the above commands with vmtouch and cgroup grep to get dirty pages, and you should get the same output. The only exception is the read ahead policy. By default, mmap() loads much more data in Page Cache, even for write requests.
Dirty pages
As we saw earlier, a process generates dirty pages by writing to files through Page Cache.
Linux provides several options to get the number of dirty pages. The first and oldest one is to read /proc/memstat:
$ cat /proc/meminfo | grep Dirty
Dirty:                 4 kB
The full system information is often hard to interpret and use because we can’t determine which process and file has these dirty pages.
That’s why the best option in order to get dirty page info is to use cgroup:
$ cat /sys/fs/cgroup/user.slice/user-1000.slice/session-3.scope/memory.stat  | grep dirt
file_dirty 4096
If your program uses mmap() to write to files, you have one more option to get dirty pages stats with a per-process granularity. procfs has the /proc/PID/smaps file. It contains memory counters for the process broken down by virtual memory areas (VMA). We can get dirty pages by finding:
- Private_Dirty – the amount of dirty data this process generated;
- Shared_Dirty – and the amount other processes wrote. This metric shows data only for referenced pages. It means the process should access pages and keep them in its page table (more details later).
$ cat /proc/578097/smaps | grep file1.db -A 12 | grep Dirty
Shared_Dirty:          0 kB
Private_Dirty:       736 kB
But what if we want to get the dirty page stats for a file? To answer this question linux kernel provides 2 files in procfs: /proc/PID/pagemap and /proc/kpageflags. I’m showing how to write our own tool with them later in the series, but for now we can use the debug tool from the linux kernel repo to get per file page info: page-types.
$ sudo page-types -f /var/tmp/file1.db -b dirty

             flags      page-count       MB  symbolic-flags                     long-symbolic-flags
0x0000000000000838             267        1  ___UDl_____M________________________________       uptodate,dirty,lru,mmap
0x000000000000083c              20        0  __RUDl_____M________________________________       referenced,uptodate,dirty,lru,mmap
             total             287        1
I filtered out all pages of our file /var/tmp/file1.db by the dirty flag. In the output, you can see that the file has 287 dirty pages or 1 MiB of dirty data, which will be persisted to storage eventually. page-type aggregates pages by flags, so that you can see 2 sets in the output. Both have the dirty flag D, and the difference between them is the presence of the referenced flag R (which I’m briefly touching on in the Page Cache eviction section later).
Synchronize file changes with fsync(), fdatasync() and msync()
We already used sync (man 1 sync) to flush all dirty pages to disks before every test to get a fresh system without any interference. But what if we want to write a database management system, and we need to be sure that all writes will get to disks before a power outage or other hardware errors occur? For such cases, Linux provides several methods to force the kernel to run a sync of pages for the file in Page Cache:
- fsync() – blocks until all dirty pages of the target file and its metadata are synced;
- fdatasync() – the same as the above but excluding metadata;
- msync() – the same as the fsync() but for memory mapped file;
- open a file with O_SYNC or O_DSYNC flags to make all file writes synchronous by default and work as a corresponding fsync() and fdatasync() syscalls accordingly.
NOTE
You still need to care about write barriers and understand how the underlying file system works because the kernel scheduler might reorder write operations. Usually, a file append operation is safe and can’t corrupt the previously written data. Other types of mutate operations may mess with your files (for instance, for ext4, even with the default journal). That’s why almost all database management systems like MongoDB, PostgreSQL, Etcd, Dgraph, etc, have write ahead logs (WAL) which are append-only. There are some exceptions though. If you’re curious more about this topic, this blog post from Dgraph is a good starting point.
There are some exceptions, though. For instance, lmdb (and its clones, bboltdb from etcd) uses a witty and clever idea of keeping two roots of its B+ tree and doing a copy-on-write.
And here is an example of the file sync:
import os

with open("/var/tmp/file1.db", "br+") as f:
    fd = f.fileno()
    os.fsync(fd)
Checking file presence in Page Cache with mincore()
Before we go any further, let’s figure out how vmtouch manages to show us how many pages of a target file Page Cache contains.
The secret is a mincore() syscall (man 2 mincore). mincore() stands for “memory in the core”. Its parameters are a starting virtual memory address, a length of the address space and a resulting vector. mincore() works with memory (not files), so it can be used for checking if anonymous memory was swapped out.
man 2 mincore
mincore() returns a vector that indicates whether pages of the calling process’s virtual memory are resident in core (RAM), and so will not cause a disk access (pagefault) if referenced. The kernel returns residency information about the pages starting at the address addr, and continuing for length bytes.
So to replicate vmtouch we need to map a file into the virtual memory of the process, even though we are not going to make neither reads nor writes. We just want to have it in the process memory area (more about this later in mmap() section).
Now we have all we need to write our own simple vmtouch in order to show cached pages by file path. I’m using go here because, unfortunately, Python doesn’t have an easy way to call mincore() syscall:
package main

import (
	"fmt"
	"log"
	"os"
	"syscall"
	"unsafe"
)

var (
	pageSize = int64(syscall.Getpagesize())
	mode     = os.FileMode(0600)
)

func main() {
	path := "/var/tmp/file1.db"

	file, err := os.OpenFile(path, os.O_RDONLY|syscall.O_NOFOLLOW|syscall.O_NOATIME, mode)
	if err != nil {
		log.Fatal(err)
	}
	defer file.Close()

	stat, err := os.Lstat(path)
	if err != nil {
		log.Fatal(err)
	}
	size := stat.Size()
	pages := size / pageSize

	mm, err := syscall.Mmap(int(file.Fd()), 0, int(size), syscall.PROT_READ, syscall.MAP_SHARED)
	defer syscall.Munmap(mm)

	mmPtr := uintptr(unsafe.Pointer(&mm[0]))
	cached := make([]byte, pages)

	sizePtr := uintptr(size)
	cachedPtr := uintptr(unsafe.Pointer(&cached[0]))

	ret, _, err := syscall.Syscall(syscall.SYS_MINCORE, mmPtr, sizePtr, cachedPtr)
	if ret != 0 {
		log.Fatal("syscall SYS_MINCORE failed: %v", err)
	}

	n := 0
	for _, p := range cached {
		// the least significant bit of each byte will be set if the corresponding page
		// is currently resident in memory, and be clear otherwise.
		if p%2 == 1 {
			n++
		}
	}

	fmt.Printf("Resident Pages: %d/%d  %d/%d\n", n, pages, n*int(pageSize), size)
}
And if we run it:
$ go run ./main.go

Resident Pages: 1024/32768  4194304/134217728
And comparing it with vmtouch output:
$ vmtouch /var/tmp/file1.db
           Files: 1         LOOK HERE
     Directories: 0            ⬇
  Resident Pages: 1024/32768  4M/128M  3.12%
         Elapsed: 0.000804 seconds
Page Cache eviction and page reclaim
So far, we have talked about adding data to Page Cache by reading and writing files, checking the existence of files in the cache, and flushing the cache content manually. But the most crucial part of any cache system is its eviction policy, or regarding Linux Page Cache, it’s also the memory page reclaim policy. Like any other cache, Linux Page Cache continuously monitors the last used pages and makes decisions about which pages should be deleted and which should be kept in the cache.
The primary approach to control and tune Page Cache is the cgroup subsystem. You can divide the server’s memory into several smaller caches (cgroups) and thus control and protect applications and services. In addition, the cgroup memory and IO controllers provide a lot of statistics that are useful for tuning your software and understanding the internals of the cache.
Theory
Linux Page Cache is closely tightened with Linux Memory Management, cgroup and virtual file system (VFS). So, in order to understand how eviction works, we need to start with some basic internals of the memory reclaim policy. Its core building block is a per cgroup pair of active and inactive lists:
- the first pair for anonymous memory (for instance, allocated with malloc() or not file backended mmap());
- the second pair for Page Cache file memory (all file operations including read(), write, filemmap() accesses, etc.).
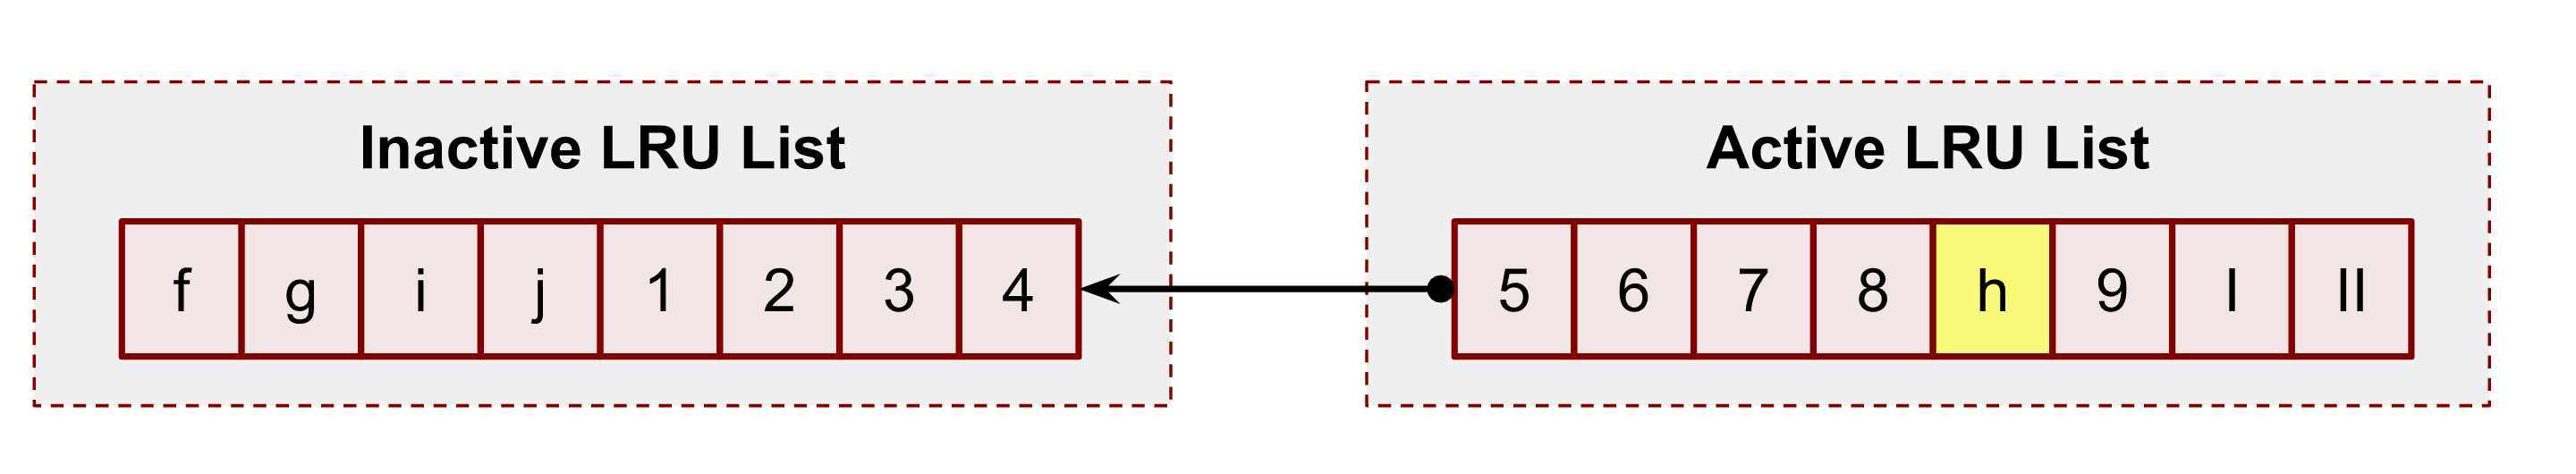
The former is exactly what we are interested in. This pair is what linux uses for Page Cache evection process. The least recently used algorithm LRU is the core of each list. In turn, these 2 lists form a double clock data structure. In general, Linux should choose pages that have not been used recently (inactive) based on the fact that the pages that have not been used recently will not be used frequently in a short period of time. It is the basic idea of the LRU algorithm. Both the active and the inactive lists adopt the form of FIFO (First In First Out) for their entries. New elements are added to the head of the linked list, and the elements in between gradually move toward the end. When memory reclamation is needed, the kernel always selects the page at the end of the inactive list for releasing. The following figure shows the simplified concept of the idea:
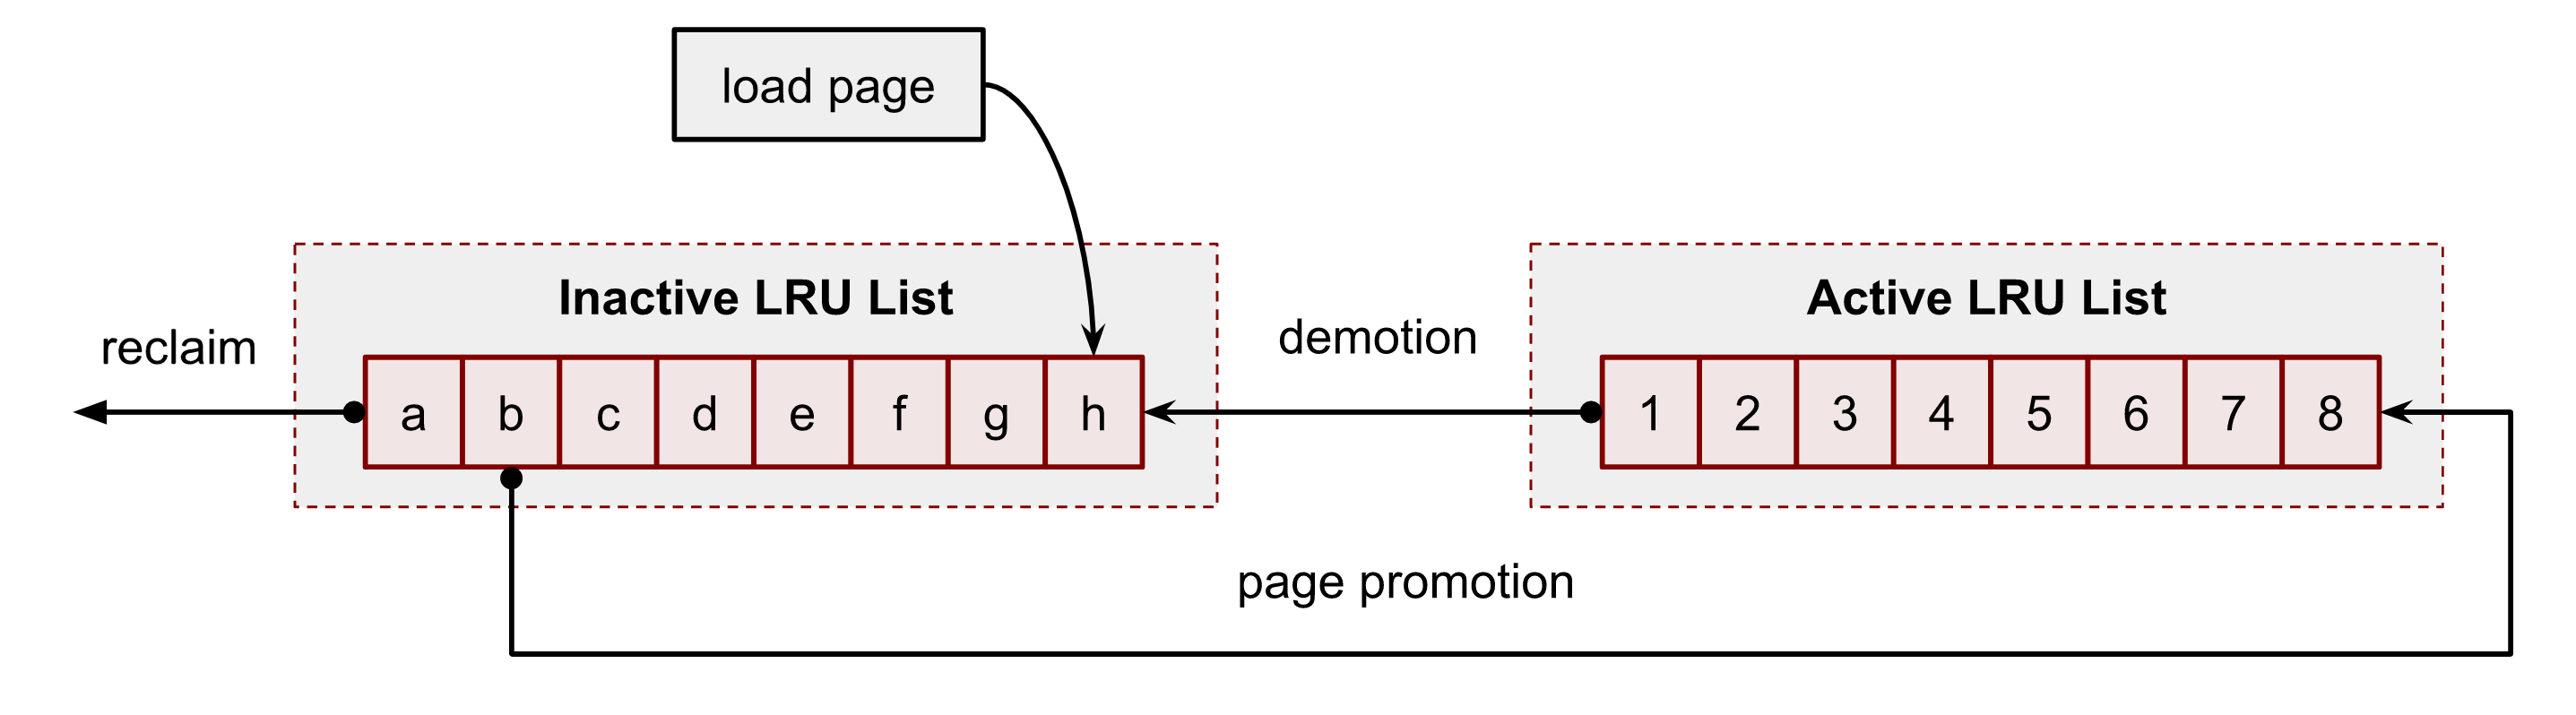
For example, the system starts with the following content of the lists. A user process has just read some data from disks. This action triggered the kernel to load data to the cache. It was the first time when the kernel had to access the file. Hence it added a page h to the head of the inactive list of the process’s cgroup:
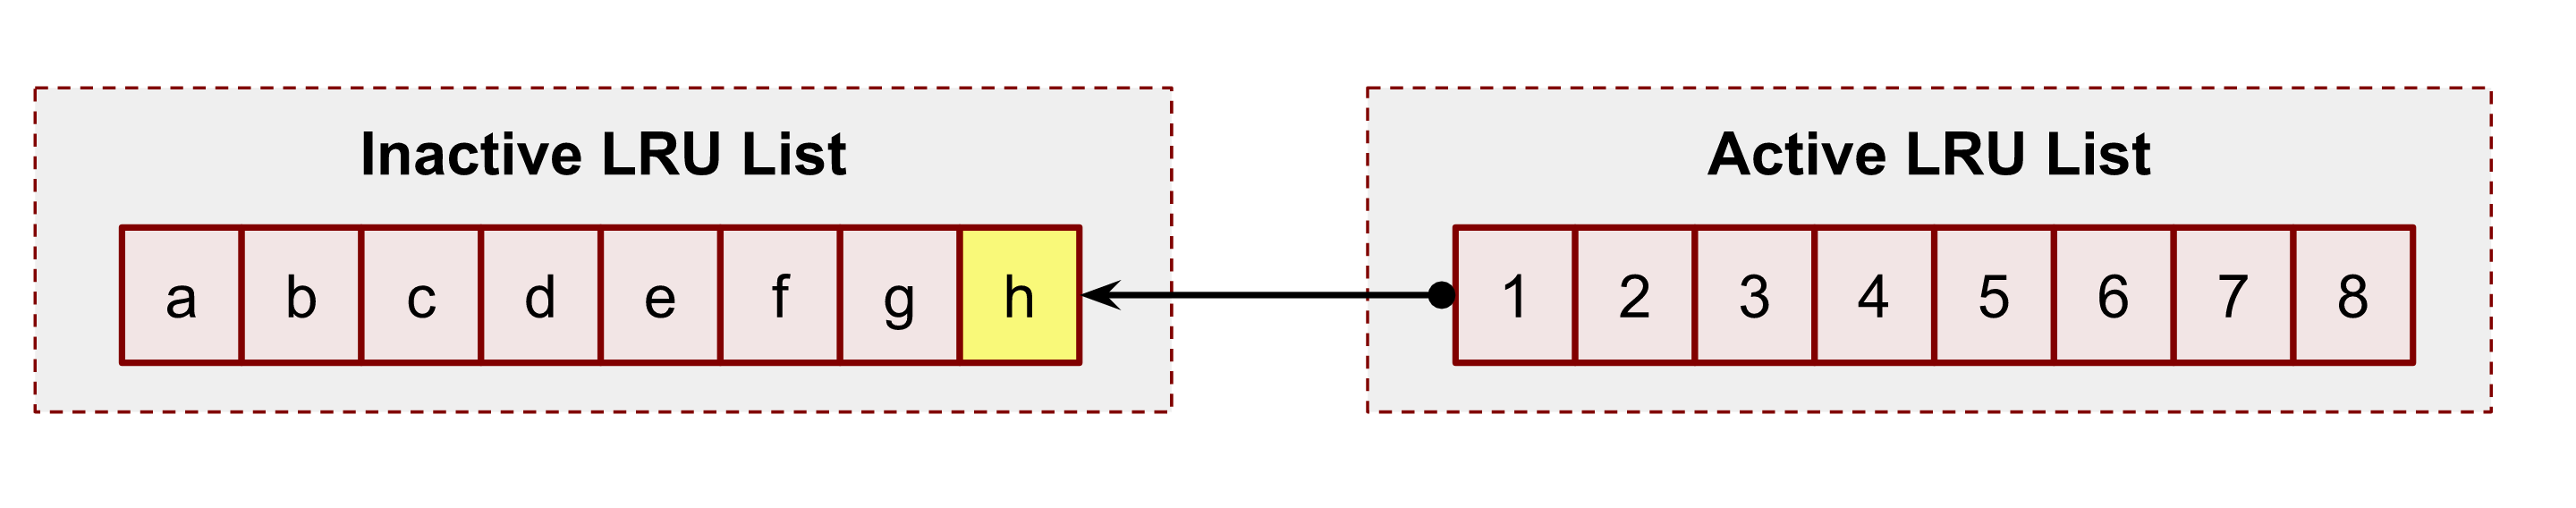
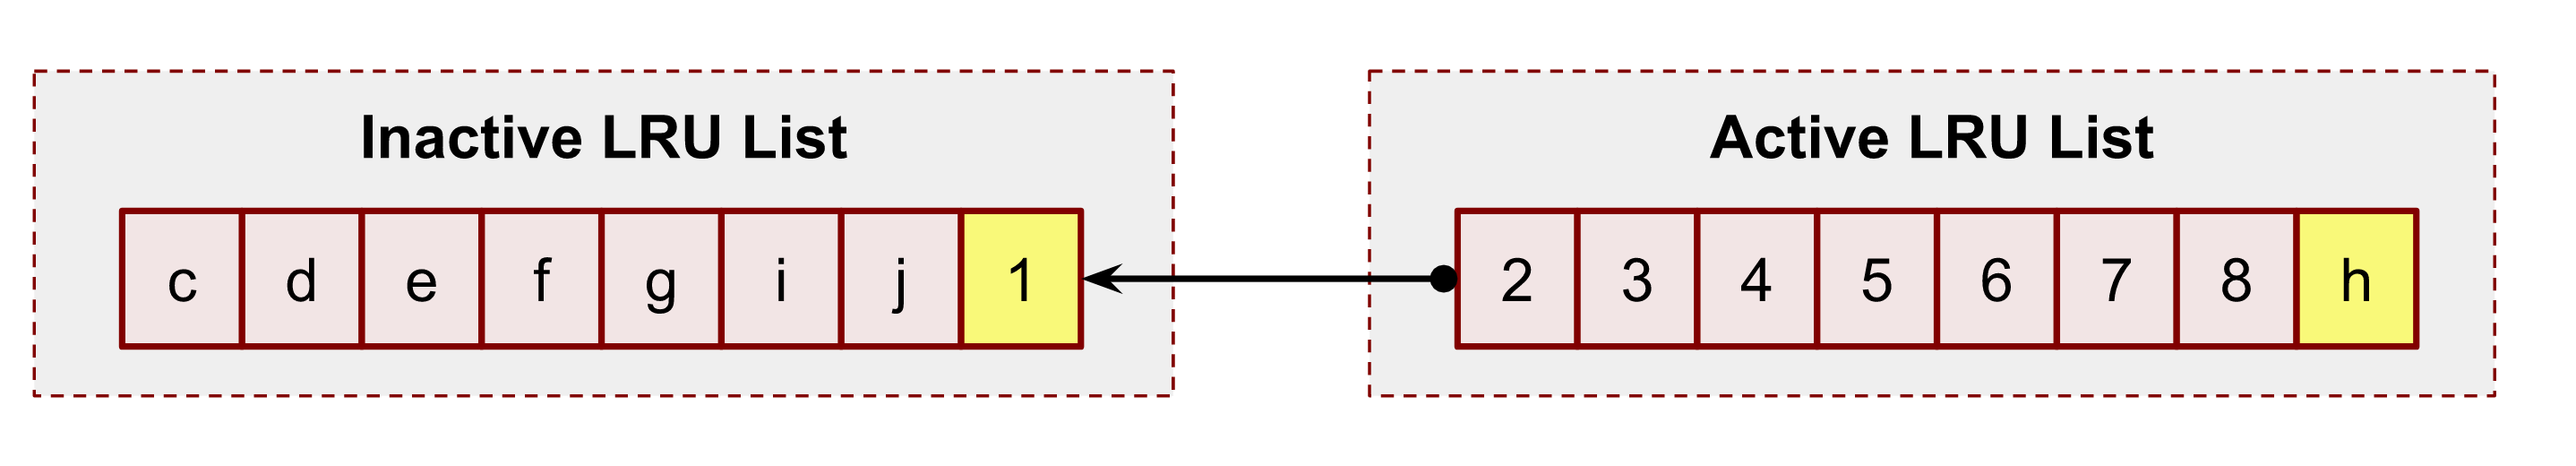
Some time has passed, and the system loads 2 more pages: i and j to the inactive list and accordingly has to evict pages a and b from it. This action also shifts all pages toward the tail of the inactive LRU list, including our page h:

Now, a new file operation to the page h promotes the page to the active LRU list by putting it at the head. This action also ousts the page 1 to the head of the inactive LRU list and shifts all other members.
As time flies, page h looses its head position in the active LRU list.
But a new file access to the h’s position in the file returns h back to the head of the active LRU list.
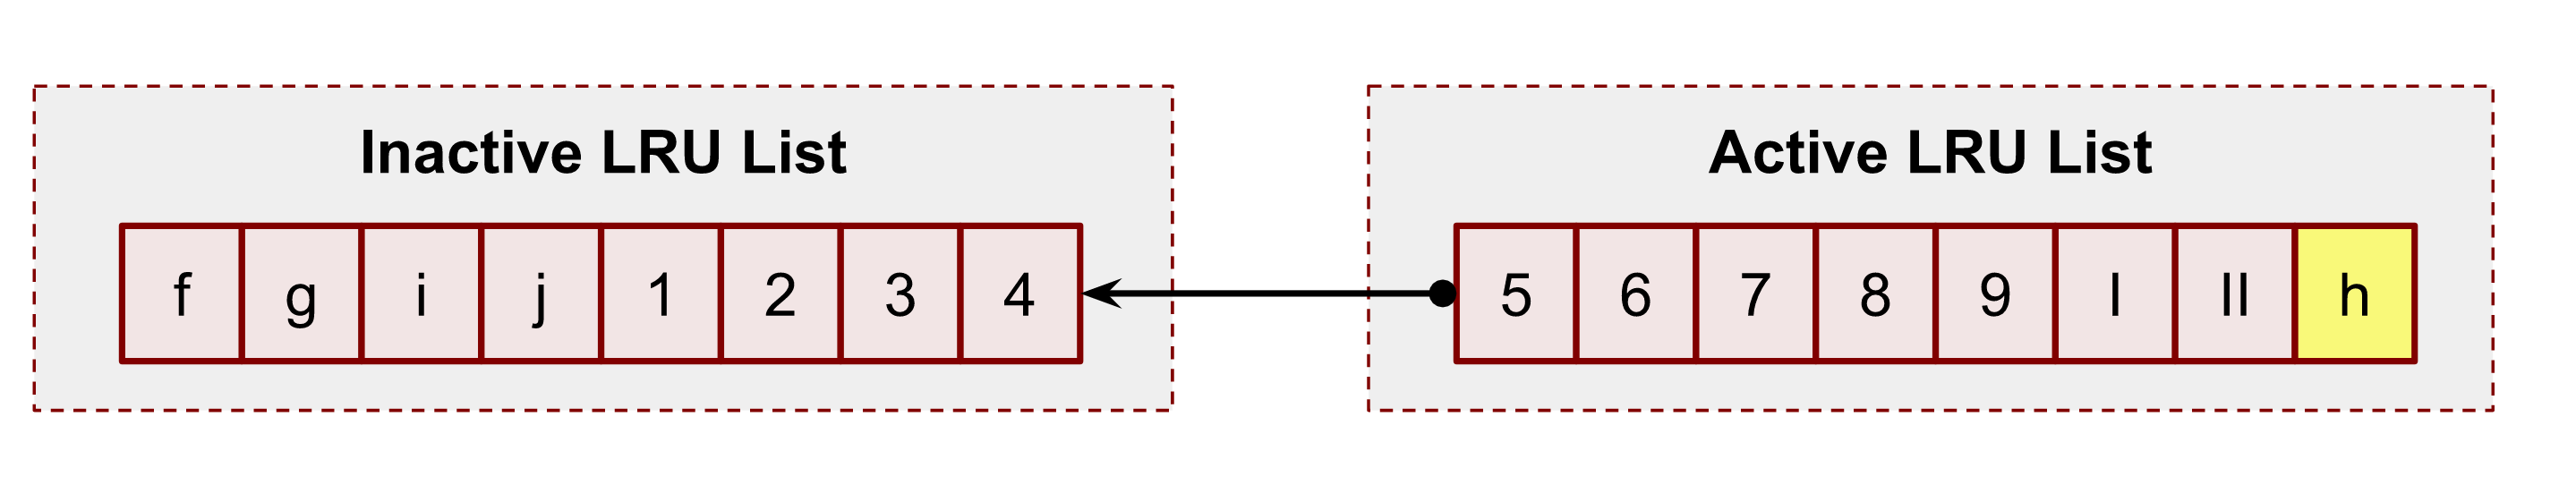
The above figures show the simplified version of the algorithm.
But it’s worth mentioning that the real process of pages promotion and demotion is much more complicated and sophisticated.
First of all, if a system has NUMA hardware nodes (man 8 numastat), it has twice more LRU lists. The reason is that the kernel tries to store memory information in the NUMA nodes in order to have fewer lock contentions.
In addition, Linux Page Cache also has special shadow and referenced flag logic for promotion, demotion and re-promotion pages.
Shadow entries help to mitigate the memory thrashing problem. This issue happens when the programs’ working set size is close to or greater than the real memory size (maybe cgroup limit or the system RAM limitation). In such a situation, the reading pattern may evict pages from the inactive list before the subsequent second read request has appeared. The full idea is described in the mm/workingset.c and includes calculating refault distance. This distance is used to judge whether to put the page from the shadow entries immediately to the active LRU list.
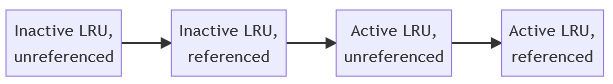
Another simplification I made was about PG_referenced page flag. In reality, the page promotion and demotion use this flag as an additional input parameter in the decision algorithm. A more correct flow of the page promotion:
Manual pages eviction with POSIX_FADV_DONTNEED
I’ve already shown how to drop all Page Cache entries using /proc/sys/vm/drop_caches file. But what if we want for some reason to clear the cache for a file?
EXAMPLE
It could sometimes be useful to evict a file from the cache in a real life situation. Assume we want to test how fast our MongoDB gets back to optimal condition after a system reboot. You can stop a replica, clean all its files from Page Cache and start it back.
vmtouch already can do that. Its -e flag commands the kernel to evict all pages of the requested file from Page Cache:
For example:
$ vmtouch /var/tmp/file1.db -e
           Files: 1
     Directories: 0
   Evicted Pages: 32768 (128M)
         Elapsed: 0.000704 seconds

$ vmtouch /var/tmp/file1.db
           Files: 1.    LOOK HERE
     Directories: 0        ⬇
  Resident Pages: 0/32768  0/128M  0%

         Elapsed: 0.000566 seconds
Let’s look under the hood and figure out how it works. In order to write our own tool we need to use the already seen posix_fadvise syscall with the POSIX_FADV_DONTNEED option.
Code:
import os

with open("/var/tmp/file1.db", "br") as f:
    fd = f.fileno()
    os.posix_fadvise(fd, 0, os.fstat(fd).st_size, os.POSIX_FADV_DONTNEED)
For testing, I read the entire test file into Page Cache with dd:
$ dd if=/var/tmp/file1.db of=/dev/null
262144+0 records in
262144+0 records out
134217728 bytes (134 MB, 128 MiB) copied, 0.652248 s, 206 MB/s

$ vmtouch /var/tmp/file1.db
           Files: 1         LOOK HERE
     Directories: 0             ⬇
  Resident Pages: 32768/32768  128M/128M  100%
         Elapsed: 0.002719 seconds
And now, after running our script, we should see 0 pages in Page Cache:
$ python3 ./evict_full_file.py

$ vmtouch /var/tmp/file1.db
           Files: 1     LOOK HERE
     Directories: 0        ⬇
  Resident Pages: 0/32768  0/128M  0%
         Elapsed: 0.000818 seconds
Make your memory unevictable
But what if you want to force the kernel to keep your file memory in Page Cache, no matter what. It is called making the file memory unevictable .
EXAMPLE
Sometimes you have to force the kernel to give you a 100% guarantee that your files will not be evicted from the memory. You can want it even with modern linux kernels and properly configured cgroup limits, which should keep the working data set in Page Cache. For example, due to issues with other processes on the system where you share disk and network IO. Or, for instance, because of an outage of a network attached storage.
Kernel provides a bunch of syscalls for doing that: mlock(), mlock2() and mlockall(). As with the mincore(), you must map the file first.
mlock2() is a preferable syscall for Page Cache routines because it has the handy flag MLOCK_ONFAULT:
Lock pages that are currently resident and mark the entire range so that the remaining nonresident pages are locked when they are populated by a page fault.
And don’t forget about limits (man 5 limits.conf). You likely need to increased it:
$ ulimit -l
64
And finally, to get the amount of unevictable memory, please, check the cgroup memory controller stats for your cgroup:
$ grep unevictable /sys/fs/cgroup/user.slice/user-1000.slice/session-3.scope/memory.stat
unevictable 0
Page Cache, vm.swappiness and modern kernels
Now that we understand the basic reclaiming theory with 4 LRU lists (for anon and file memory) and evictable/unevictable types of memory, we can talk about the sources to refill the system free memory. The kernel constantly maintains lists of free pages for itself and user-space needs. If such lists get below the threshold, the linux kernel starts to scan LRU lists in order to find pages to reclaim. It allows the kernel to keep memory in some equilibrium state.
The Page Cache memory is usually evictable memory (with some rare mlock() exceptions). And thus, it maybe look obvious, that Page Cache should be the first and the only option for the memory eviction and reclaiming. Since disks already have all that data, right? But fortunately or unfortunately, in real production situations, this is not always the best choice.
If the system has swap (and it should have it with modern kernels), the kernel has one more option. It can swap out the anonymous (not file-backed) pages. It may seem counterintuitive, but the reality is that sometimes user-space daemons can load tons of initialization code and never use it afterward. Some programs, especially statically built, for example, could have a lot of functionality in their binaries that may be used only several times in some edge cases. In all such situations, there is not much sense in keeping them in valuable memory.
So, in order to control which inactive LRU list to prefer for scans, the kernel has the sysctl vm.swappiness knob.
$ sudo sysctl -a | grep swap
vm.swappiness = 60
There are a lot of blog posts, stories and forum threads about this magic setting. On top of that, the legacy cgroup v1 memory subsystem has its own per cgroup swappiness knob. All this makes information about the current vm.swappiness meaning hard to understand and change. But let me try to explain some recent changes and give you fresh links.
First of all, by default vm.swappiness is set 60, the min is 0 and the max is 200:
/*
 * From 0 .. 200.  Higher means more swappy.
 */
int vm_swappiness = 60;
The 100 value means that the kernel considers anonymous and Page Cache pages equally in terms of reclamation.
Secondly, the cgroup v2 memory controller doesn’t have the swappiness knob at all:
#ifdef CONFIG_MEMCG
static inline int mem_cgroup_swappiness(struct mem_cgroup *memcg)
{
	/* Cgroup2 doesn't have per-cgroup swappiness */
	if (cgroup_subsys_on_dfl(memory_cgrp_subsys))
		return vm_swappiness;

	/* root ? */
	if (mem_cgroup_disabled() || mem_cgroup_is_root(memcg))
		return vm_swappiness;

	return memcg->swappiness;
Instead, the kernel developers decided to change the swappiness logic significantly. You can check it if you run git blame on mm/vmscan.c and search for the get_scan_count() function.
For example, at the time of writing, the anonymous memory will not be touched regardless of vm.swappiness if the inactive LRU Page Cache list has a decent amount of pages:
	/*
	 * If there is enough inactive page cache, we do not reclaim
	 * anything from the anonymous working right now.
	 */
	if (sc->cache_trim_mode) {
		scan_balance = SCAN_FILE;
		goto out;
	}
The full logic of making decisions about what and from which LRU to reclaim, you can find in the get_scan_count()function in mm/vmscan.c.
Also, please take a look at the memory.swap.high and the memory.swap.max cgroup v2 settings. You can control them if you want to correct the vm.swappiness logic for your cgroup and load pattern.
Another interesting topic, which you should keep in mind when dealing with the swap and Page Cache, is the IO load during the swapping in/out processes. If you have IO pressure, you can easily hit your IO limits and, for example, degrade your Page Cache writeback performance.
Understanding memory reclaim process with /proc/pid/pagemap
Now it’s time for low level troubleshooting technics.
There is a /proc/PID/pagemap file that contains the page table information of the PID. The page table, basically speaking, is an internal kernel map between page frames (real physical memory pages stored in RAM) and virtual pages of the process. Each process in the linux system has its own virtual memory address space which is completely independent form other processes and physical memory addresses.
The full /proc/PID/pagemap and related file documentation, including data formats and ways to read, it can be found in the kernel documentation folder. I strongly recommend that you read it before proceeding to the sections below.
page-types kernel page tool
page-types is the Swiss knife of every kernel memory hacker. Its source code comes with the Linux kernel sources tools/vm/page-types.c.
If you didn’t install it in the first chapter:
$ wget https://github.com/torvalds/linux/archive/refs/tags/v5.13.tar.gz
$ tar -xzf ./v5.13.tar.gz
$ cd v5.13/vm/tools
$ make
Now let’s use it in order to understand how many pages of our test file /var/tmp/file1.db the kernel has placed in Active and Inactive LRU lists:
$ sudo ./page-types --raw -Cl -f /var/tmp/file1.db

foffset cgroup  offset  len     flags
/var/tmp/file1.db       Inode: 133367   Size: 134217728 (32768 pages)
Modify: Mon Aug 30 13:14:19 2021 (13892 seconds ago)
Access: Mon Aug 30 13:15:47 2021 (13804 seconds ago)
10689   @1749   21fa    1       ___U_lA_______________________P____f_____F_1

...

18965   @1749   24d37   1       ___U_l________________________P____f_____F_1
18966   @1749   28874   1       ___U_l________________________P____f_____F_1
18967   @1749   10273   1       ___U_l________________________P____f_____F_1
18968   @1749   1f6ad   1       ___U_l________________________P____f_____F_1


             flags      page-count       MB  symbolic-flags                     long-symbolic-flags
0xa000010800000028             105        0  ___U_l________________________P____f_____F_1       uptodate,lru,private,softdirty,file,mmap_exclusive
0xa00001080000002c              16        0  __RU_l________________________P____f_____F_1       referenced,uptodate,lru,private,softdirty,file,mmap_exclusive
0xa000010800000068             820        3  ___U_lA_______________________P____f_____F_1       uptodate,lru,active,private,softdirty,file,mmap_exclusive
0xa001010800000068               1        0  ___U_lA_______________________P____f_I___F_1       uptodate,lru,active,private,softdirty,readahead,file,mmap_exclusive
0xa00001080000006c              16        0  __RU_lA_______________________P____f_____F_1       referenced,uptodate,lru,active,private,softdirty,file,mmap_exclusive
             total             958        3
The output contains 2 sections: the first one provides per-page information, and the second aggregates all pages with the same flags and counts the summary. What we need from the output in order to answer to the LRU question are A and l flags, which, as you can guess, stand for “active” and “inactive” lists.
As you can see, we have:
- 105 + 16 = 121 pages or 121 * 4096 = 484 KiB in inactive LRU list.
- 820 + 1 + 16 = 837 pages or 837 * 4096 = 3.2 MiB in active LRU list.
Writing Page Cache LRU monitor tool
page-types is a really useful tool for low-level debugging and investigations, but its output format is hard to read and aggregate. I promised earlier that we would write our own vmtouch, so now we’re creating it. Our alternative version will provide even more information about pages. It will show not only how many pages are in Page Cache, but also how many of them are in the active and the inactive LRU lists.
To do this, we need 2 kernel files: /proc/PID/pagemap and /proc/kpageflags.
The full code you can find in the github repo, however here, I would like to focus on a few important moments:
    ...
①  err = syscall.Madvise(mm, syscall.MADV_RANDOM)
    ...

②  ret, _, err := syscall.Syscall(syscall.SYS_MINCORE, mmPtr, sizePtr, cachedPtr)

    for i, p := range cached {
③      if p%2 == 1 {
④           _ = *(*int)(unsafe.Pointer(mmPtr + uintptr(pageSize*int64(i))))
        }
    }
   ...

⑤  err = syscall.Madvise(mm, syscall.MADV_SEQUENTIAL)
    ...
- ① – Here, we need to disable the read ahead logic for the target file in order to protect ourselves from loading (charging) unneeded data to Page Cache by our tool;
- ② – Use mincore() syscall to get a vector of the pages in Page Cache;
- ③ – Here, we check whether a page is in Page Cache or not;
- ④ – If Page Cache contains a page, we need to update the corresponding process’s page table entry by referencing this page. Our tool has to do this in order to use the /proc/pid/pagemap. Otherwise the /proc/pid/pagemap file will not contain the target file pages and thus their flags.
- ⑤ – Here, we are turning off the harvesting of reference bits. This is required due to kernel reclaim logic. Our tool read memory and hence influences the kerne LRU lists. By using madvise() with MADV_SEQUENTIAL we notify linux kernel to ignore our operations.
Let’s test our tool. We need 2 terminals. In the first one, start our tool with watch (man 1 watch) to run our tool every 100ms in an infinitive loop:
watch -n 0.1 'sudo go run ./lru.go'
And in the second terminal, we will read the file with the dd (man 1 dd):
dd if=/var/tmp/file1.db of=/dev/null
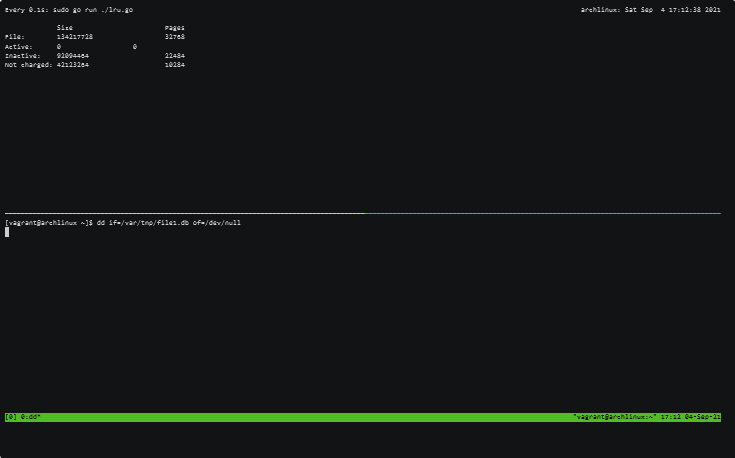
Using the above approach, you can now perform low-level Page Cache investigations.
More about mmap() file access
Before we start the cgroup chapter, where I’m showing how to leverage memory and IO limits in order to control Page Cache eviction and improve the reliability of services, I want to delve a bit deeper into mmap() syscall. We need to understand what is happening under the hood and shed more light on the reading and writing process with mmap().
mmap() overview
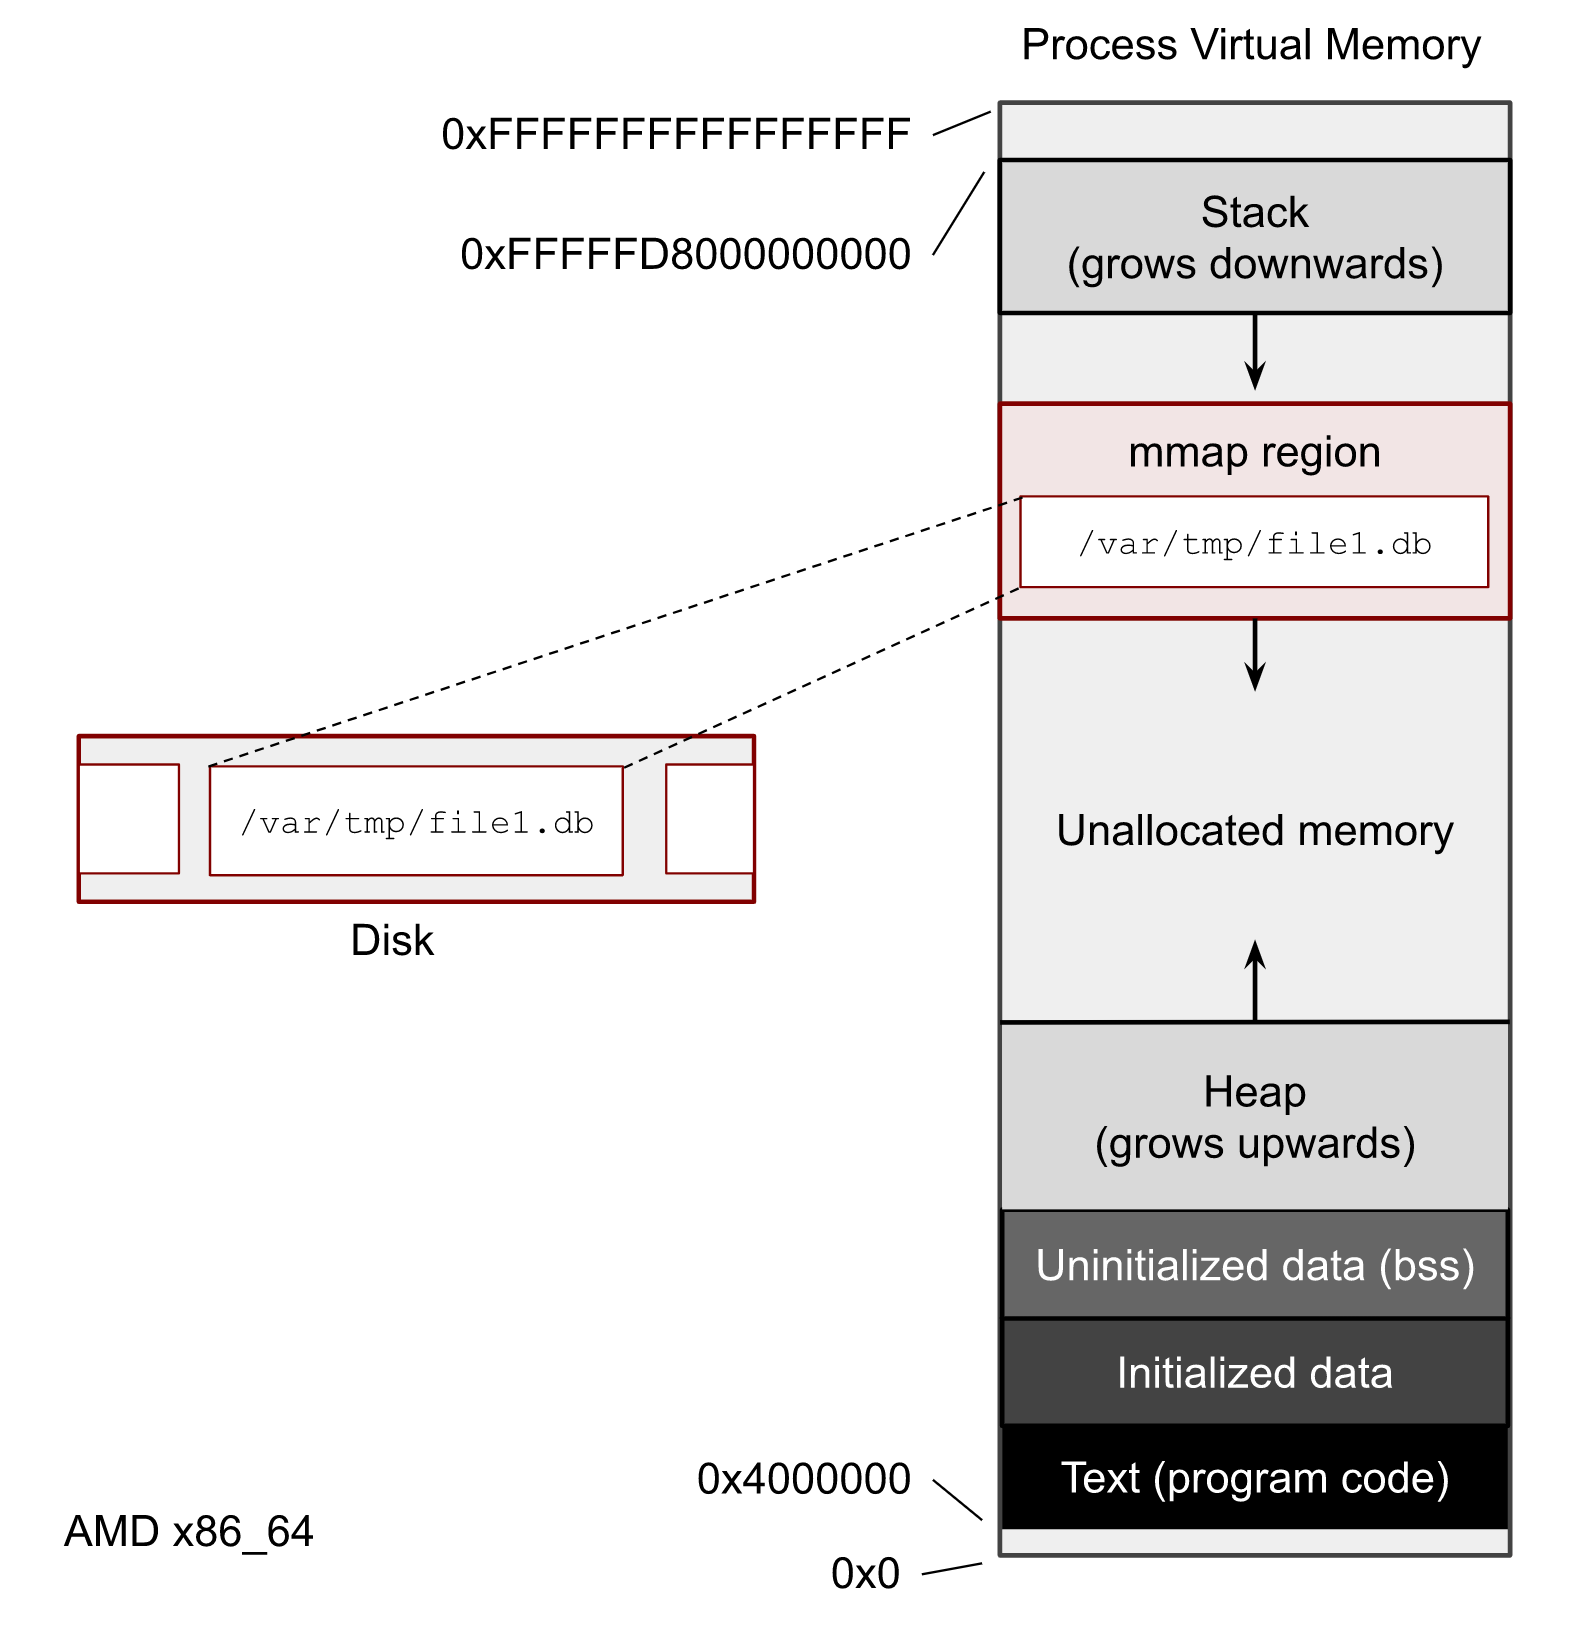
Memory mapping is one of the most interesting features of Linux systems. One of its features is the ability for software developers to work transparently with files whose size exceeds the actual physical memory of the system. In the image below, you can see what the Virtual Memory of a process looks like. Each process has its own region where mmap() maps files.
What I’m not touching here is whether to use mmap() or file syscalls like read() and write() in your software. What is better, faster, or safer to use is beyond the scope of this post. But you definitely need to understand how to get the mmap() stats because almost every Page Cache user-space tool uses it.
Let’s write one more script with mmap(). It prints a PID of the process, maps the test file and sleeps. The sleep time should be enough to play with the process.
import mmap
import os
from time import sleep

print("pid:", os.getpid())

with open("/var/tmp/file1.db", "rb") as f:
    with mmap.mmap(f.fileno(), 0, prot=mmap.PROT_READ) as mm:f
        sleep(10000)
Run it in one terminal window, and in another one, run pmap -x PID with the PID of the script.
pmap -x 369029 | less
where 369029 is my PID.
The output of the pmap shows us all contiguous virtual memory areas (VMA or struct vm_area_struct) of the process. We can determine the virtual addresses of the mmaped test file file1.db. In my case:
Address           Kbytes     RSS   Dirty Mode  Mapping
...
00007f705cc12000  131072       0       0 r--s- file1.db
We can see that we have 0 dirty pages for the file (it only shows the dirty pages of this process). The RSS column equals 0, which tells us how much memory in KiB our process has already referenced. This 0, by the way, doesn’t mean that there are no pages of the file in Page Cache. It means that our process hasn’t accessed any pages yet.
NOTE
pmap can display even more detailed output with -XX. Without -XX, it uses /proc/pid/maps, but for the extended mode it shows stats from /proc/pid/smaps. More info can be found in man 5 proc and kernel documentation filesystems/proc.rst.
So, the most exciting part about mmap() for SRE is how it transparently loads data on accessing and writing. And I’m showing all this in the following chapters.
What is a page fault?
Before we start talking about file tools, we need to understand the concept of page faults. Generally speaking, the page fault is the CPU mechanism for communicating with the Linux Kernel and its memory subsystem. The page fault is a building block of the Virtual Memory concept and demand paging. Briefly speaking, the kernel usually doesn’t allocate physical memory immediately after a memory request is done by mmap() or malloc(). Instead, the kernel creates some records it the process’s page table structure and uses it as a storage for its memory promises. In addition, the page table contains extra info for each page, such as memory permissions and page flags (we’ve already seen some of them: LRUs flags, dirty flag, etc.).
From the examples in chapter 2, you can see that in order to read mmaped file at any position, the code doesn’t need to perform any seeks (man 2 lseek), unlike with file operations. We can just start reading from or writing to any point of the mapped area. For this reason, when an application wants to access a page, the page fault can occur if the target page has not been loaded to Page Cache or there are no connections between the page in the Page Cache and the process’ page table.
There are 2 useful for us types of page faults: minor and major. A minor basically means that there will be no disk access in order to fulfill a process’s memory access. And on the other hand, a major page fault means that there will be a disk IO operation.
For example, if we load half of a file with dd in Page Cache and afterward access this first half from a program with mmap(), we will trigger minor page faults. The kernel doesn’t need to go to disks because these pages were already loaded to Page Cache. The kernel only needs to reference these already loaded pages with the page table entries of the process. But if the process tries to read within the same mmaped area the second half of the file, the kernel will have to go to the disk in order to load the pages, and the system will generate major page faults.
If you want to get more information about demand paging, Linux kernel and system internals, please watch “Introduction to Memory Management in Linux” video from Embedded Linux Conf.
Let’s do an experiment and write a script with an infinitive random read of the file:
import mmap
import os
from random import randint
from time import sleep

with open("/var/tmp/file1.db", "r") as f:
    fd = f.fileno()
    size = os.stat(fd).st_size
    with mmap.mmap(fd, 0, prot=mmap.PROT_READ) as mm:
        try:
            while True:
                pos = randint(0, size-4)
                print(mm[pos:pos+4])
                sleep(0.05)
        except KeyboardInterrupt:
            pass
Now we need 3 terminal windows. In the first one:
$ sar -B 1
which shows the system memory statistics per second including page faults.
And in the second one, perf trace:
$ sudo perf trace -F maj --no-syscalls
which shows major page faults and corresponding file paths.
Finally, in the 3rd terminal window, start the above python script:
$ python3 ./mmap_random_read.py
The output should be something closer to the following:
$ sar -B 1

....                                  LOOK HERE
                                      ⬇      ⬇
05:45:55 PM  pgpgin/s pgpgout/s   fault/s  majflt/s  pgfree/s pgscank/s pgscand/s pgsteal/s    %vmeff
05:45:56 PM   8164.00      0.00     39.00      4.00      5.00      0.00      0.00      0.00      0.00
05:45:57 PM   2604.00      0.00     20.00      1.00      1.00      0.00      0.00      0.00      0.00
05:45:59 PM   5600.00      0.00     22.00      3.00      2.00      0.00      0.00      0.00      0.00
...
Take a look at the fault/s and majflt/s fields. They show what I’ve just explained.
And from the perf trace, we can get insides about the file where we have major page faults:
$ sudo perf trace -F maj --no-syscalls

...
SCROLL ➡                                                                                     LOOK HERE
                                                                                                 ⬇
5278.737 ( 0.000 ms): python3/64915 majfault [__memmove_avx_unaligned_erms+0xab] => /var/tmp/file1.db@0x2aeffb6 (d.)
5329.946 ( 0.000 ms): python3/64915 majfault [__memmove_avx_unaligned_erms+0xab] => /var/tmp/file1.db@0x539b6d9 (d.)
5383.701 ( 0.000 ms): python3/64915 majfault [__memmove_avx_unaligned_erms+0xab] => /var/tmp/file1.db@0xb3dbc7 (d.)
5434.786 ( 0.000 ms): python3/64915 majfault [__memmove_avx_unaligned_erms+0xab] => /var/tmp/file1.db@0x18f7c4f (d.)
...
The cgroup also has per cgroup stats regarding page faults:
$ grep fault /sys/fs/cgroup/user.slice/user-1000.slice/session-3.scope/memory.stat

...
pgfault 53358
pgmajfault 13
...
Subtle MADV_DONT_NEED mmap() feature
Now let’s perform another experiment. Stop all scripts and drop all caches:
$ sync; echo 3 | sudo tee /proc/sys/vm/drop_caches
Restart the script with the infinite read and start monitoring per memory area usage of the process:
watch -n 0.1 "grep 'file1' /proc/$pid/smaps -A 24"
You can now see the mmaped area of the file and its info. The reference field should be growing.
In the other window, try to evict pages with vmtouch:
vmtouch -e /var/tmp/file1.db
And notice that the stats from the smaps output don’t drop entirely. When you run the vmtouch -e command, the smaps should show you some decrease in memory usage. The question is, what happens? Why when we explicitly ask the kernel to evict the file pages by setting the FADVISE_DONT_NEED flag, some of them are still present in Page Cache?
The answer is a little confusing, but very important to understand. If the Linux kernel has no memory pressure issues, why should it drop pages from Page Cache? There is a high probability that the program will need them in the future. But if you, as a software developer, are sure that these pages are useless, there is a madvise() and MADV_DONT_NEED flag for that. It informs the kernel that it can remove these pages from the corresponding page table, and the following vmtouch -e call will successfully be able to expel the file data from Page Cache.
In case of the memory pressure situation, the kernel will start reclaiming memory from inactive LRU lists. Which means eventually it can drop these pages if they are good candidates for reclaiming.
Cgroup v2 and Page Cache
The cgroup subsystem is the way to distribute and limit system resources fairly. It organizes all data in a hierarchy where the leaf nodes depend on their parents and inherit their settings. In addition, the cgroup provides a lot of helpful resource counters and statistics.
The control groups are everywhere. Even though you may not use them explicitly, they are already turned on by default in all modern GNU/Linux distributives and got integrated into systemd. It means that each service in a modern linux system runs under its own cgroup.
Overview
We already touched the cgroup subsystem several times during this series, but let’s take a closer look at the entire picture now. The cgroup plays a critical role in the understanding Page Cache usage. It also helps to debug issues and configure software better by providing detailed stats. As was told earlier, the LRU lists use cgroup memory limits to make eviction decisions and to size the length of the LRU lists.
Another important topic in cgroup v2, which was unachievable with the previous v1, is a proper way of tracking Page Cache IO writebacks. The v1 can’t understand which memory cgroup generates disk IOPS and therefore, it incorrectly tracks and limits disk operations. Fortunately, the new v2 version fixes these issues. It already provides a bunch of new features which can help with Page Cache writeback.
The simplest way to find out all cgroups and their limits are to go to the /sys/fs/cgroup. But you can use more convenient ways to get such info:
- systemd-cgls and systemd-top to understand what cgroups systemd has;
- below a top-like tool for cgroups https://github.com/facebookincubator/below
Memory cgroup files
Now let’s review the most important parts of the cgroup memory controller from the perspective of Page Cache.
memory.current– shows the total amount of memory currently used by the cgroup and its descendants. It, of course, includes Page Cache size.
NOTE
It may be tempting to use this value in order to set your cgroup/container memory limit, but wait a bit for the following chapter.
memory.stat– shows a lot of memory counters, the most important for us can be filtered by file keyword:
$ grep file /sys/fs/cgroup/user.slice/user-1000.slice/session-3.scope/memory.stat
file 19804160                  ❶
file_mapped 0                  ❷
file_dirty 0                   ❸
file_writeback 0               ❹
inactive_file 6160384          ❺
active_file 13643776           ❺
workingset_refault_file 0      ❻
workingset_activate_file 0     ❻
workingset_restore_file 0      ❻
where
- ❶ file – the size of the Page Cache;
- ❷ file_mapped – mapped file memory size with mmap();
- ❸ file_dirty – dirty pages size;
- ❹ file_writeback – how much data is being flushing at the moment;
- ❺ inactive_file and active_file – sizes of the LRU lists;
- ❻ workingset_refault_file, workingset_activate_file and workingset_restore_file – metrics to better understand memory thrashing and refault logic.
-
memory.numa_stat– shows the above stats but for each NUMA node. -
memory.min,memory.low,memory.highandmemory.max– cgroup limits. I don’t want to repeat the cgroup v2 doc and recommend you to go and read it first. But what you need to keep in mind is that using the hard max or min limits is not the best strategy for your applications and systems. The better approach you can choose is to set only low and/or high limits closer to what you think is the working set size of your application. We will talk about measuring and predicting in the next section. -
memory.events– shows how many times the cgroup hit the above limits:
emory.events
low 0
high 0
max 0
oom 0
oom_kill 0
memory.pressure– this file contains Pressure Stall Information (PSI). It shows the general cgroup memory health by measuring the CPU time that was lost due to lack of memory. This file is the key to understanding the reclaiming process in the cgroup and, consequently, Page Cache. Let’s talk about PSI in more detail.
Pressure Stall Information (PSI)
Back before PSI times, it was hard to tell whether a system and/or a cgroup has resource contention or not; whether a cgroup limits are overcommitted or under-provisioned. If the limit for a cgroup can be set lower, then where is its threshold? The PSI feature mitigates these confusions and not only allows us to get this information in real-time but also allows us to set up user-space triggers and get notifications to maximize hardware utilization without service degradation and OOM risks.
The PSI works for memory, CPU and IO controllers. For example, the output for memory:
some avg10=0.00 avg60=0.00 avg300=0.00 total=0
full avg10=0.00 avg60=0.00 avg300=0.00 total=0
where
some– means that at least one task was stalled on memory for some average percentage of wall-time during 10, 60 and 300 seconds. The “total” field shows the absolute value in microseconds in order to reveal any spikes;full– means the same but for all tasks in the cgroup. This metric is a good indication of issues and usually means underprovisioning of the resource or wrong software settings.
EXAMPLE
systemd-oom daemon, which is a part of modern GNU/Linux systems, uses the PSI to be more proactive than kernel’s OOM in recognition of memory scarcity and finding targets for killing.
I also highly recommend reading the original PSI doc.
Writeback and IO
One of the most significant features of the cgroup v2 implementation is the possibility to track, observe and limit Page Cache async writeback for each cgroup. Nowadays, the kernel writeback process can identify which cgroup IO limit to use in order to persist dirty pages to disks.
But what is also important is that it works in another direction too. If a cgroup experiences memory pressure and tries to reclaim some pages by flushing its dirty pages, it will use its own IO limits and won’t harm the other cgroups. Thus the memory pressure translates into the disk IO and if there is a lot of writes, eventually, into the disk pressure for the cgroup. Both controllers have the PSI files, which should be used for proactive management and tuning your software settings.
In order to control dirty pages flush frequency, the linux kernel has several sysctl knobs. If you want, you can make the background writeback process more or less aggressive:
$ sudo sysctl -a | grep dirty
vm.dirty_background_bytes = 0
vm.dirty_background_ratio = 10
vm.dirty_bytes = 0
vm.dirty_expire_centisecs = 3000
vm.dirty_ratio = 20
vm.dirty_writeback_centisecs = 500
vm.dirtytime_expire_seconds = 43200
Some of the above works for cgroups too. The kernel chooses and applies what reaches first for the entire system or for a cgroup.
The cgroup v2 also brings new IO controllers: io.cost and io.latency. They provide 2 different approaches for limiting and guaranteeing disk operations. Please, read the cgroup v2 documentation for more details and distinctions. But I would say that if your setup is not complex, starting with less invasive io.latency makes sense.
As with the memory controller, the kernel also provides a bunch of files to control and observe IO:
io.stat– the stat file with per device data;io.latency– the latency target time in microseconds;io.pressure– the PSI file;io.weight– the target weight if io.cost was chosen;io.cost.qosandio.cost.model– the configuration file of the io.cost cgroup controller.
Memory and IO cgroup ownership
Several processes from multiple cgroups can obviously work with the same files. For example, cgroup1 can open and read the first 10 KiB of the file, and sometime later, another cgroup2 can append 2 KiB to the end of the same file and read the first 4KiB. The question is, whose memory and IO limits will the kernel use?
The logic of memory ownership (therefore and Page Cache) is built based on each page. The ownership of a page is charged on the first access (page fault) and won’t switch to any other cgroup until this page will be completely reclaimed and evicted. The term ownership means that these pages will be used to calculate the cgroup Page Cache usage and will be included in all stats.
For example, cgroup1 is the owner of the first 10KiB, and cgroup2 – is the owner of the last 2KiB. No matter what cgroup1 will do with the file, it can even close it, cgroup1 remains the owner of the first 4KiB (not all 10KiB) as long as cgroup2 works with this first 4KiB of the file. In this situation, kernel keeps the pages in Page Caches and keeps updating LRU lists accordingly.
For the cgroup IO, ownership works per inode. So for our example cgroup2 owns all writeback operations for the file. The inode is assigned to the cgroup on the first writeback, but unlike the memory ownership logic, the IO ownership may migrate to another cgroup if the kernel notices that this other cgroup generates more dirty pages.
In order to troubleshoot memory ownership, we should use the pair of procfs files: /proc/pid/pagemap and /proc/kpagecgroup. The page-type tool supports showing per page cgroup information, but it’s hard to use it for a directory of files and get a well-formatted output. That’s why I wrote my own cgtouch tool in order to troubleshoot cgroup memory ownership.
$ sudo go run ./main.go /var/tmp/ -v

/var/tmp/file1.db
cgroup inode    percent       pages        path
           -      85.9%       28161        not charged
        1781      14.1%        4608        /sys/fs/cgroup/user.slice/user-1000.slice/session-3.scope

--
/var/tmp/ubuntu-21.04-live-server-amd64.iso
cgroup inode    percent       pages        pat
           -       0.0%           0        not charged
        2453     100.0%       38032        /sys/fs/cgroup/user.slice/user-1000.slice/user@1000.service/app.slice/run-u10.service

--
         Files: 2
   Directories: 7
Resident Pages: 42640/70801 166.6M/276.6M 60.2%

cgroup inode    percent       pages        path
           -      39.8%       28161        not charged
        1781       6.5%        4608        /sys/fs/cgroup/user.slice/user-1000.slice/session-3.scope
        2453      53.7%       38032        /sys/fs/cgroup/user.slice/user-1000.slice/user@1000.service/app.slice/run-u10.service
Safe ad-hoc tasks
Let’s assume we need to run the wget command or manually install some packages by calling a configuration management system (e.g. saltstack). Both of these tasks can be unpredictably heavy for disk I/O. In order to run them safely and not interact with any production load, we should not run them in the root cgroup or the current terminal cgroup, because they usually don’t have any limits. So we need a new cgroup with some limits. It would be very tedious and cumbersome to manually create a cgroup for your task and manually configure it for every ad-hoc task. But fortunately, we don’t have to, so all modern GNU/Linux distributives come with the systemd out of the box with cgroup v2. The systemd-run with many other cool features from the systemd makes our life easier and saves a lot of time.
So, for example, wget task can be run in the following manner:
systemd-run --user -P -t -G --wait -p MemoryMax=12M wget http://ubuntu.ipacct.com/releases/21.04/ubuntu-21.04-live-server-amd64.iso
Running as unit: run-u2.service                         ⬅  LOOK HERE
Press ^] three times within 1s to disconnect TTY.
--2021-09-11 19:53:33--  http://ubuntu.ipacct.com/releases/21.04/ubuntu-21.04-live-server-amd64.iso
Resolving ubuntu.ipacct.com (ubuntu.ipacct.com)... 195.85.215.252, 2a01:9e40::252
Connecting to ubuntu.ipacct.com (ubuntu.ipacct.com)|195.85.215.252|:80... connected.
HTTP request sent, awaiting response... 200 OK
Length: 1174243328 (1.1G) [application/octet-stream]
Saving to: ‘ubuntu-21.04-live-server-amd64.iso.5’
...
The run-u2.service is my brand new cgroup with a memory limit. I can get its metrics:
$ find /sys/fs/cgroup/ -name run-u2.service
/sys/fs/cgroup/user.slice/user-1000.slice/user@1000.service/app.slice/run-u2.service

$ cat  /sys/fs/cgroup/user.slice/user-1000.slice/user@1000.service/app.slice/run-u2.service/memory.pressure
some avg10=0.00 avg60=0.00 avg300=0.00 total=70234
full avg10=0.00 avg60=0.00 avg300=0.00 total=69717

$ grep file  /sys/fs/cgroup/user.slice/user-1000.slice/user@1000.service/app.slice/run-u2.service/memory.stat
file 11100160
file_mapped 0
file_dirty 77824
file_writeback 0
file_thp 0
inactive_file 5455872
active_file 5644288
workingset_refault_file 982
workingset_activate_file 0
workingset_restore_file 0
As you can see from the above we have near 12MiB file memory and some refault.
To get all power of systemd and cgroup please read its resource control doc.
How much memory my program uses or the tale of working set size
Currently, in the world of containers, auto-scaling, and on-demand clouds, it’s vital to understand the resource needs of services both in norman regular situations and under pressure near the software limits. But every time someone touches on the topic of memory usage, it becomes almost immediately unclear what and how to measure. RAM is a valuable and often expensive type of hardware. In some cases, its latency is even more important than disk latency. Therefore, the Linux kernel tries as hard as it can to optimize memory utilization, for instance by sharing the same pages among processes. In addition, the Linux Kernel has its Page Cache in order to improve storage IO speed by storing a subset of the disk data in memory. Page Cache not only, by its nature, performs implicit memory sharing, which usually confuses users, but also actively asynchronously works with the storage in the background. Thus, Page Cache brings even more complexity to the table of memory usage estimation.
In this chapter, I’m demonstrating some approaches you can use to determine your initial values for the memory (and thus Page Cache) limits and start your journey from a decent starting point.
It’s all about who counts or the story of unique set size
The 2 most common questions I’ve heard about memory and Linux are:
- Where is all my free memory?
- How much memory does you/my/their application/service/database use?
The first question’s answer should already be obvious to the reader (whispering “Page Cache”). But the second one is much more trickier. Usually, people think that the RSS column from the top or ps output is a good starting point to evaluate memory utilization. Although this statement may be correct in some cases, it can usually lead to misunderstanding of Page Cache importance and its impact on the service performance and reliability.
Let’s take a well-known top (man 1 top) tool as an example in order to investigate its memory consumption. It’s written in C and it does nothing but prints process’ stats in the loop. top doesn’t heavily work with disks and thus Page Cache. It doesn’t touch the network. Its only purpose is to read data from the procfs and to show it to the user in a friendly format. So it should be easy to understand its working set, shouldn’t it?
Let’s start the top process in a new cgroup:
$ systemd-run --user -P -t -G --wait top
And in another terminal let’s start our learning. Begin with the ps:
$ ps axu | grep top
USER         PID %CPU %MEM    VSZ   RSS TTY      STAT START   TIME COMMAND
...
vagrant   611963  0.1  0.2  10836  4132 pts/4    Ss+  11:55   0:00 /usr/bin/top
...                                  ⬆
                                  LOOK HERE
As you can see from the above, the top process uses ~4MiB of memory according to the ps output.
Now let’s get more details from the procfs and its /proc/pid/smaps_rollup file, which is basically a sum of all memory areas from the /proc/pid/smaps. For my PID:
$ cat /proc/628011/smaps_rollup
55df25e91000-7ffdef5f7000 ---p 00000000 00:00 0                          [rollup]
Rss:                3956 kB  ⓵
Pss:                1180 kB  ⓶
Pss_Anon:            668 kB
Pss_File:            512 kB
Pss_Shmem:             0 kB
Shared_Clean:       3048 kB  ⓷
Shared_Dirty:          0 kB  ⓸
Private_Clean:       240 kB
Private_Dirty:       668 kB
Referenced:         3956 kB  ⓹
Anonymous:           668 kB  ⓺
...
Where we mostly care about the following rows:
- ⓵ – A well know RSS metric and what we’ve seen in the ps output.
- ⓶ – PSS stands for the process’ proportional share memory. It’s an artificial memory metric and it should give you some insights about memory sharing:
The “proportional set size” (PSS) of a process is the count of pages it has in memory, where each page is divided by the number of processes sharing it. So if a process has 1000 pages all to itself and 1000 shared with one other process, its PSS will be 1500.
- ⓷ Shared_Clean – is an interesting metric. As we assumed earlier, our process should not use any Page Cache in theory, but it turns out it does use Page Cache. And as you can see, it’s the predominant part of memory usage. If you open a per area file /proc/pid/smaps, you can figure out that the reason is shared libs. All of them were opened with mmap() and are resident in Page Cache.
- ⓸ Shared_Dirty – If our process writes to files with mmap(), this line will show the amount of unsaved dirty Page Cache memory.
- ⓹ Referenced - indicates the amount of memory the process has marked as referenced or accessed so far. We touched on this metric in mmap() section. And if there is no memory pressure, it should be close to RSS.
- ⓺ Anonymous – shows the amount of memory that does not belong to any files.
From the above, we can see that, although top’s RSS is 4MiB, most of its RSS is hidden in Page Cache. And in theory, if these pages become inactive for a while, the kernel can evict them from memory.
Let’s take a look at the cgroup stats as well:
$ cat /proc/628011/cgroup
0::/user.slice/user-1000.slice/user@1000.service/app.slice/run-u2.service

$ cat /sys/fs/cgroup/user.slice/user-1000.slice/user@1000.service/app.slice/run-u2.service/memory.stat
anon 770048
file 0
...
file_mapped 0
file_dirty 0
file_writeback 0
...
inactive_anon 765952
active_anon 4096
inactive_file 0
active_file 0
...
We can not see any file memory in the cgroup. That is another great example of the cgroup memory charging feature. Another cgroup has already accounted these libs.
And to finish and recheck ourselves, let’s use the page-type tool:
$ sudo ./page-types --pid 628011 --raw
             flags      page-count       MB  symbolic-flags                     long-symbolic-flags
0x2000010100000800               1        0  ___________M_______________r_______f_____F__       mmap,reserved,softdirty,file
0xa000010800000868              39        0  ___U_lA____M__________________P____f_____F_1       uptodate,lru,active,mmap,private,softdirty,file,mmap_exclusive
0xa00001080000086c              21        0  __RU_lA____M__________________P____f_____F_1       referenced,uptodate,lru,active,mmap,private,softdirty,file,mmap_exclusive
0x200001080000086c             830        3  __RU_lA____M__________________P____f_____F__       referenced,uptodate,lru,active,mmap,private,softdirty,file
0x8000010000005828             187        0  ___U_l_____Ma_b____________________f_______1       uptodate,lru,mmap,anonymous,swapbacked,softdirty,mmap_exclusive
0x800001000000586c               1        0  __RU_lA____Ma_b____________________f_______1       referenced,uptodate,lru,active,mmap,anonymous,swapbacked,softdirty,mmap_exclusive
             total            1079        4
We can see that the memory of the top process has file mmap() areas and thus uses Page Cache.
Now let’s get a unique memory set size for our top process. The unique memory set size or USS for the process is an amount of memory which only this target process uses. This memory could be sharable but still, be in the USS if no other processes use it.
We can use the page-types with -N flag and some shell magic to calculate the USS of the process:
$ sudo ../vm/page-types --pid 628011 --raw -M -l -N | awk '{print $2}' | grep -E '^1$' | wc -l
248
The above means that 248 pages or 992 KiB is the unique set size (USS) of the top process.
Or we can use our knowledge about /proc/pid/pagemap, /proc/kpagecount and /proc/pid/maps and write our own tool to get the unique set size. The full code of such tool can be found in the github repo.
If we run it, we should get the same output as page-type gave us:
$ sudo go run ./main.go 628011
248
Now that we understand how it can be hard to estimate the memory usage and the importance of Page Cache in such calculations, we are ready to make a giant leap forward and start thinking about software with more active disk activities.
Idle pages and working set size
Readers who have gotten this far may be curious about one more kernel file: /sys/kernel/mm/page_idle.
You can use it to estimate the working set size of a process. The main idea is to mark some pages with the special idle flag and, after some time, check the difference-making assumptions about the working data set size.
You can find great reference tools in Brendan Gregg’s repository.
Let’s run it for our top process:
$ sudo ./wss-v1 628011 60
Watching PID 628011 page references during 60.00 seconds...
Est(s)     Ref(MB)
60.117        2.00
The above means that from the 4MiB of RSS data, the process uses only 2 MiB during the 60-second interval.
For more information, you can also read this LWN article.
The drawbacks of this method are the following:
- it can be slow for a process with a huge memory footprint;
- all measurements happen in the user space and thus consume additional CPU;
- it completely detached from the possible writeback pressure your process can generate.
Although it could be a reasonable starting limit for your containers, I will show you a better approach using cgroup stats and pressure stall information (PSI).
Calculating memory limits with Pressure Stall Information (PSI)
As you can see throughout the series, I emphasize that running all services in their own cgroups with carefully configured limits is very important. It usually leads to better service performance and more uniform and correct use of system resources.
But what is still unclear is where to start. Which value to choose? Is it good to use the memory.current value? Or use the unique set size? Or estimate the working set size with the idle page flag? Though all these ways may be useful in some situations, I would suggest using the following PSI approach for a general case.
One more note about the memory.current before I continue with the PSI. If a cgroup doesn’t have a memory limit and the system has a lot of free memory for the process, the memory.current simply shows all the memory (including Page Cache) that your application has touched up to that point. It can include a lot of garbage your application doesn’t need for its runtime. For example, logs records, unneeded libs, etc. Using the memory.current value as a memory limit would be wasteful for the system and will not help you in capacity planning.
The modern approach to address this hard question is to use PSI in order to understand how a cgroup reacts to new memory allocations and Page Cache evictions. senapi is a simple automated script that collects and parses the PSI info and adjusts the memory.high:
Let’s experiment with my test MongoDB installation. I have 2.6GiB of data:
$ sudo du -hs /var/lib/mongodb/
2.4G    /var/lib/mongodb/
Now I need to generate some random read queries. In mongosh I can run an infinite while loop and read a random record every 500 ms:
while (true) {
    printjson(db.collection.aggregate([{ $sample: { size: 1 } }]));
    sleep(500);
}
In the second terminal window, I start the senpai with the mongodb service cgroup:
sudo python senpai.py /sys/fs/cgroup/system.slice/mongodb.service
2021-09-05 16:39:25 Configuration:
2021-09-05 16:39:25   cgpath = /sys/fs/cgroup/system.slice/mongodb.service
2021-09-05 16:39:25   min_size = 104857600
2021-09-05 16:39:25   max_size = 107374182400
2021-09-05 16:39:25   interval = 6
2021-09-05 16:39:25   pressure = 10000
2021-09-05 16:39:25   max_probe = 0.01
2021-09-05 16:39:25   max_backoff = 1.0
2021-09-05 16:39:25   coeff_probe = 10
2021-09-05 16:39:25   coeff_backoff = 20
2021-09-05 16:39:26 Resetting limit to memory.current.
...
2021-09-05 16:38:15 limit=503.90M pressure=0.030000 time_to_probe= 1 total=1999415 delta=601 integral=3366
2021-09-05 16:38:16 limit=503.90M pressure=0.030000 time_to_probe= 0 total=1999498 delta=83 integral=3449
2021-09-05 16:38:16   adjust: -0.000840646891233154
2021-09-05 16:38:17 limit=503.48M pressure=0.020000 time_to_probe= 5 total=2000010 delta=512 integral=512
2021-09-05 16:38:18 limit=503.48M pressure=0.020000 time_to_probe= 4 total=2001688 delta=1678 integral=2190
2021-09-05 16:38:19 limit=503.48M pressure=0.020000 time_to_probe= 3 total=2004119 delta=2431 integral=4621
2021-09-05 16:38:20 limit=503.48M pressure=0.020000 time_to_probe= 2 total=2006238 delta=2119 integral=6740
2021-09-05 16:38:21 limit=503.48M pressure=0.010000 time_to_probe= 1 total=2006238 delta=0 integral=6740
2021-09-05 16:38:22 limit=503.48M pressure=0.010000 time_to_probe= 0 total=2006405 delta=167 integral=6907
2021-09-05 16:38:22   adjust: -0.00020961438729431614
As you can see, according to the PSI, 503.48M of memory should be enough to support my reading work load without any problems.
This is obviously a preview of the PSI features and for real production services, you probably should think about io.pressure as well.
… and what about writeback?
To be honest, this question is more difficult to answer. As I write this article, I do not know of a good tool for evaluating and predicting writeback and IO usage. However, the rule of thumb is to start with io.latency and then try to use io.cost if needed.
There is also an interesting new project resctl-demo which can help in proper limits identification.
Direct IO (DIO) (NOT READY)
As usual, there is always an exception to any rule. And Page Cache is no different. So let’s talk about file reads and writes, which can ignore Page Cache content.
Why it’s good
Some applications require low-level access to the storage subsystem and the linux kernel gives such a feature by providing O_DIRECT file open flag. This IO is called the Direct IO or DIO. A program, which opens a file with this flag, bypasses the kernel Page Cache completely and directly communicates with the VFS and the underlying filesystem.
The pros are:
- Lower CPU usage and thus higher throughput you can get;
- Linux Async IO (man 7 aio) works only with DIO (io_submit);
- zero-copy Avoiding double buffering () between Page Cache and user-space buffers;
- More control over the writeback.
- …
Why it’s bad and io_uring alternative
- need to align read and writes to the block size;
- not all file systems are the same in implementing DIO;
- DIO without Linux AIO is slow and not useful at all;
- not cross-platform;
- DIO and buffered IO can’t be performed at the same time for the file.
- …
DIO usually makes no sense without AIO, but AIO has a lot of bad design decisions:
So I think this is ridiculously ugly.
AIO is a horrible ad-hoc design, with the main excuse being “other, less gifted people, made that design, and we are implementing it for compatibility because database people - who seldom have any shred of taste - actually use it”.
But AIO was always really really ugly.
Linus Torvalds
Heads-up! With DIO still need to run fsync() on a file!
Let’s write an example with golang and iouring-go library:
TODO
Advanced Page Cache observability and troubleshooting tools
Let’s touch on some advanced tools we can use to perform low-level kernel tracing and debugging.
eBPF tools
First of all, we can use eBPF tools. The [bcc]https://github.com/iovisor/bcc and bpftrace are your friends when you want to get some internal kernel information.
Let’s take a look at some tools which come with it.
Writeback monitor
$ sudo bpftrace ./writeback.bt

Attaching 4 probes...
Tracing writeback... Hit Ctrl-C to end.
TIME      DEVICE   PAGES    REASON           ms
15:01:48  btrfs-1  7355     periodic         0.003
15:01:49  btrfs-1  7355     periodic         0.003
15:01:51  btrfs-1  7355     periodic         0.006
15:01:54  btrfs-1  7355     periodic         0.005
15:01:54  btrfs-1  7355     periodic         0.004
15:01:56  btrfs-1  7355     periodic         0.005
Page Cache Top
19:49:52 Buffers MB: 0 / Cached MB: 610 / Sort: HITS / Order: descending
PID      UID      CMD              HITS     MISSES   DIRTIES  READ_HIT%  WRITE_HIT%
   66229 vagrant  vmtouch             44745    44032        0      50.4%      49.6%
   66229 vagrant  bash                  205        0        0     100.0%       0.0%
   66227 root     cachetop               17        0        0     100.0%       0.0%
     222 dbus     dbus-daemon            16        0        0     100.0%       0.0%
     317 vagrant  tmux: server            4        0        0     100.0%       0.0%
Cache stat
[vagrant@archlinux tools]$ sudo ./cachestat
    HITS   MISSES  DIRTIES HITRATIO   BUFFERS_MB  CACHED_MB
      10        0        0  100.00%            0        610
       4        0        0  100.00%            0        610
       4        0        0  100.00%            0        610
      21        0        0  100.00%            0        610
     624        0        0  100.00%            0        438
       2        0        0  100.00%            0        438
       4        0        0  100.00%            0        438
       0        0        0    0.00%            0        438
      19        0        0  100.00%            0        438
       0      428        0    0.00%            0        546
   28144    16384        0   63.21%            0        610
       0        0        0    0.00%            0        610
       0        0        0    0.00%            0        610
      17        0        0  100.00%            0        610
       0        0        0    0.00%            0        610
bpftrace and kfunc trace
Other than that, eBPF and bpftrace have recently got a new great feature named kfunc. Thus, using it, you can trace some kernel functions without kernel debugging information installed.
It’s still close to experimental functionality, but it looks really promising.
Perf tool
But if you want to go deeper, I have something for you. perf allows you to set up dynamic tracing kernel probes almost at any kernel function. The only issue is the kernel debug information should be installed. Unfortunately, not all distributives provide it and, sometimes, you will need to recompile the kernel manually with some additional flags.
But when you get the debug info, you can perform really crazy investigations. For example, if we want to track the major page faults, we can find the kernel function which is in charge (https://elixir.bootlin.com/linux/latest/source and its search for help) and setup a probe:
perf probe -f "do_read_fault vma->vm_file->f_inode->i_ino"
where do_read_fault is our kernel function and vma->vm_file->f_inode->i_ino is an inode number of the file where the major page fault occurs.
Now you can start recording events:
perf record -e probe:do_read_fault -ag -- sleep 10
And after 10 seconds, we can grep out the inodes with perf script and bash magic:
perf script | grep i_ino | cut -d ' ' -f 1,8| sed 's#i_ino=##g' | sort | uniq -c | s
本文来自博客园,作者:摩斯电码,未经同意,禁止转载
