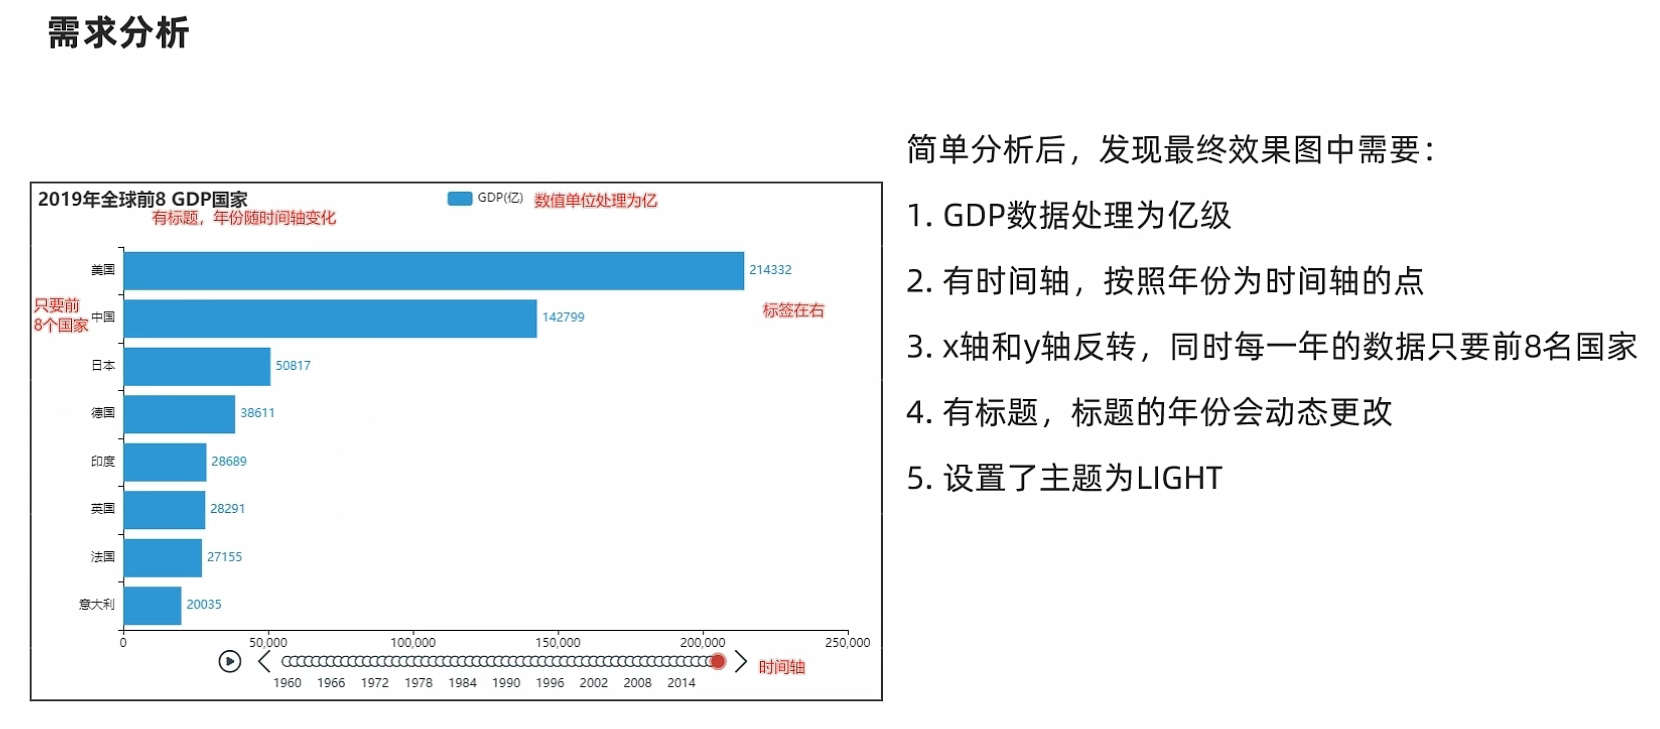
动态GDP柱状图的绘制
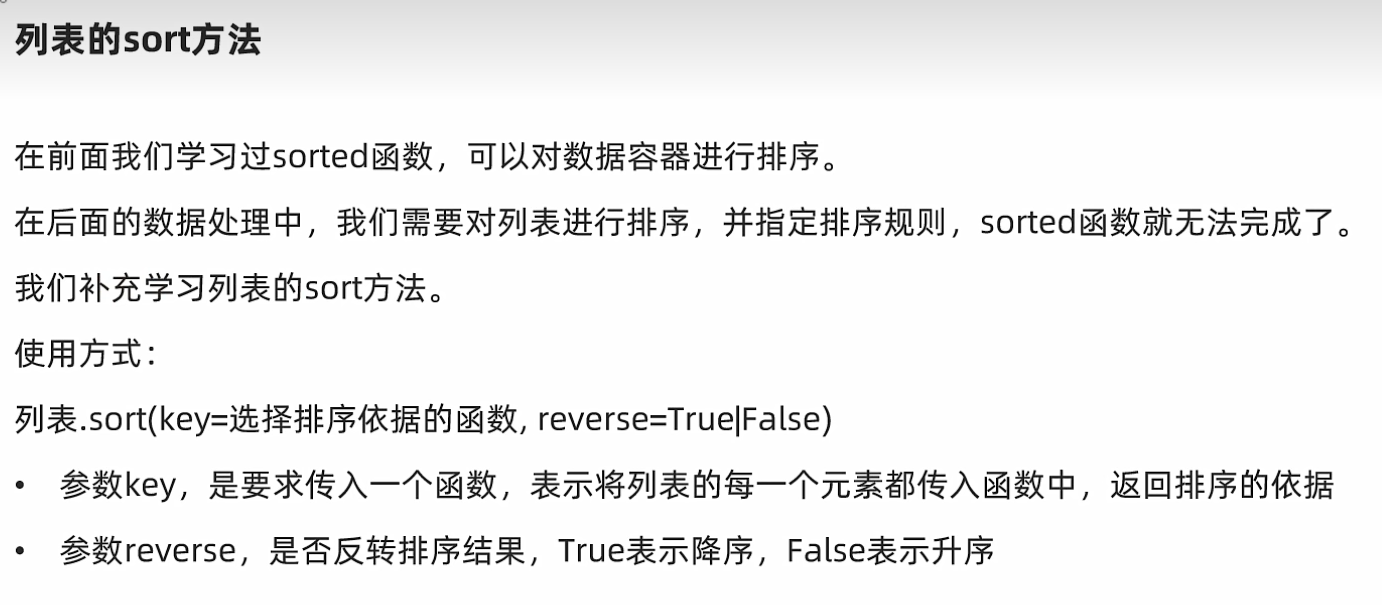
1. 列表的sort方法进行排序

练习:将my_list = [["a", 33], ["b", 55], ["c", 11]]按照每个元素中的数字进行排序!
my_list = [
    ["a", 33],
    ["b", 55],
    ["c", 11]
]

def sort_according(element):
    return element[1]

# 方式一:使用定义的sort_according函数
my_list.sort(key=sort_according)
print(my_list)

# 方式二:使用lambda匿名函数
my_list.sort(key=lambda element: element[1])
print(my_list)
2. 动态GDP柱状图的绘制

from pyecharts.charts import Bar, Timeline
from pyecharts.options import *
from pyecharts.globals import ThemeType

f = open(r"C:\Users\12192\Desktop\1960-2019全球GDP数据.csv", 'r', encoding="GB2312")
data_lines = f.readlines()
data_lines.pop(0)

data_dict = {}
for line in data_lines:
    line.strip()
    year = int(line.split(",")[0])     # 年份
    country = line.split(",")[1]  # 国家
    gdp = float(line.split(",")[2])      # GDP

    # **********依靠异常捕获向字典中添加元素**********
    try:
        data_dict[year]
    except Exception as e:
        data_dict[year] = []
        data_dict[year].append([country, gdp])
    else:
        data_dict[year].append([country, gdp])

timeline = Timeline(InitOpts(theme=ThemeType.LIGHT))

sorted_year_list = sorted(data_dict.keys())
for year in sorted_year_list:
    data_dict[year].sort(key=lambda element: element[1], reverse=True)
    year_data = data_dict[year][0:8]
    x_data = []
    y_data = []
    for country_gdp in year_data:
        x_data.append(country_gdp[0])
        y_data.append(country_gdp[1] / 100000000)

    bar = Bar()
    x_data.reverse()  # *****列表可以使用reverse()方法进行内容的反转*****
    y_data.reverse()  # *****列表可以使用reverse()方法进行内容的反转*****
    bar.add_xaxis(x_data)
    bar.add_yaxis("GDP(亿)", y_data, label_opts=LabelOpts(position="right"))
    bar.reversal_axis()
    bar.set_global_opts(title_opts=TitleOpts(title=f"{year}年全球前8GDP数据"))
    timeline.add(bar, str(year))

timeline.add_schema(play_interval=1000,
                    is_timeline_show=True,
                    is_auto_play=True,
                    is_loop_play=False)

timeline.render("1960-2019全球GDP前8国家.html")
f.close()
代码中的重要点:
(1) 向字典中添加元素,用捕获异常的技巧!
(2) 列表的reverse()方法和sort()方法


 浙公网安备 33010602011771号