三种系统监控工具对比:top vs Htop vs Glances CPU时间
top 命令解析
man top
2b. TASK and CPU States
This portion consists of a minimum of two lines. In an SMP environment, additional lines can reflect individual CPU state percentages.
Line 1 shows total tasks or threads, depending on the state of the Threads-mode toggle. That total is further classified as:
running; sleeping; stopped; zombie
Line 2 shows CPU state percentages based on the interval since the last refresh.
As a default, percentages for these individual categories are displayed. Where two labels are shown below, those for more recent kernel versions are shown first.
us, user : time running un-niced user processes
sy, system : time running kernel processes
ni, nice : time running niced user processes
id, idle : time spent in the kernel idle handler
wa, IO-wait : time waiting for I/O completion
hi : time spent servicing hardware interrupts
si : time spent servicing software interrupts
st : time stolen from this vm by the hypervisor
In the alternate cpu states display modes, beyond the first tasks/threads line, an abbreviated summary is shown consisting of these elements:
a b c d
%Cpu(s): 75.0/25.0 100[ ...
Where: a) is the combined us and ni percentage; b) is the sy percentage; c) is the total; and d) is one of two visual graphs of those representations. See topic 4b. SUMMARY AREA Commands and the `t' command for additional
information on that special 4-way toggle.
2c. MEMORY Usage
This portion consists of two lines which may express values in kibibytes (KiB) through exbibytes (EiB) depending on the scaling factor enforced with the `E' interactive command.
As a default, Line 1 reflects physical memory, classified as:
total, free, used and buff/cache
Line 2 reflects mostly virtual memory, classified as:
total, free, used and avail (which is physical memory)
The avail number on line 2 is an estimation of physical memory available for starting new applications, without swapping. Unlike the free field, it attempts to account for readily reclaimable page cache and memory slabs. It
is available on kernels 3.14, emulated on kernels 2.6.27+, otherwise the same as free.
In the alternate memory display modes, two abbreviated summary lines are shown consisting of these elements:
a b c
GiB Mem : 18.7/15.738 [ ...
GiB Swap: 0.0/7.999 [ ...
Where: a) is the percentage used; b) is the total available; and c) is one of two visual graphs of those representations.
In the case of physical memory, the percentage represents the total minus the estimated avail noted above. The `Mem' graph itself is divided between used and any remaining memory not otherwise accounted for by avail. See
topic 4b. SUMMARY AREA Commands and the `m' command for additional information on that special 4-way toggle.
This table may help in interpreting the scaled values displayed:
KiB = kibibyte = 1024 bytes
MiB = mebibyte = 1024 KiB = 1,048,576 bytes
GiB = gibibyte = 1024 MiB = 1,073,741,824 bytes
TiB = tebibyte = 1024 GiB = 1,099,511,627,776 bytes
PiB = pebibyte = 1024 TiB = 1,125,899,906,842,624 bytes
EiB = exbibyte = 1024 PiB = 1,152,921,504,606,846,976 bytes
3. FIELDS / Columns
3a. DESCRIPTIONS of Fields
Listed below are top's available process fields (columns). They are shown in strict ascii alphabetical order. You may customize their position and whether or not they are displayable with the `f' or `F' (Fields Management)
interactive commands.
Any field is selectable as the sort field, and you control whether they are sorted high-to-low or low-to-high. For additional information on sort provisions see topic 4c. TASK AREA Commands, SORTING.
The fields related to physical memory or virtual memory reference `(KiB)' which is the unsuffixed display mode. Such fields may, however, be scaled from KiB through PiB. That scaling is influenced via the `e' interactive
command or established for startup through a build option.
1. %CPU -- CPU Usage
The task's share of the elapsed CPU time since the last screen update, expressed as a percentage of total CPU time.
In a true SMP environment, if a process is multi-threaded and top is not operating in Threads mode, amounts greater than 100% may be reported. You toggle Threads mode with the `H' interactive command.
Also for multi-processor environments, if Irix mode is Off, top will operate in Solaris mode where a task's cpu usage will be divided by the total number of CPUs. You toggle Irix/Solaris modes with the `I' interactive
command.
2. %MEM -- Memory Usage (RES)
A task's currently used share of available physical memory.
3. CGROUPS -- Control Groups
The names of the control group(s) to which a process belongs, or `-' if not applicable for that process.
Control Groups provide for allocating resources (cpu, memory, network bandwidth, etc.) among installation-defined groups of processes. They enable fine-grained control over allocating, denying, prioritizing, managing and
monitoring those resources.
Many different hierarchies of cgroups can exist simultaneously on a system and each hierarchy is attached to one or more subsystems. A subsystem represents a single resource.
Note: The CGROUPS field, unlike most columns, is not fixed-width. When displayed, it plus any other variable width columns will be allocated all remaining screen width (up to the maximum 512 characters). Even so, such
variable width fields could still suffer truncation. See topic 5c. SCROLLING a Window for additional information on accessing any truncated data.
4. CODE -- Code Size (KiB)
The amount of physical memory devoted to executable code, also known as the Text Resident Set size or TRS.
5. COMMAND -- Command Name or Command Line
Display the command line used to start a task or the name of the associated program. You toggle between command line and name with `c', which is both a command-line option and an interactive command.
When you've chosen to display command lines, processes without a command line (like kernel threads) will be shown with only the program name in brackets, as in this example:
[kthreadd]
This field may also be impacted by the forest view display mode. See the `V' interactive command for additional information regarding that mode.
Note: The COMMAND field, unlike most columns, is not fixed-width. When displayed, it plus any other variable width columns will be allocated all remaining screen width (up to the maximum 512 characters). Even so, such
variable width fields could still suffer truncation. This is especially true for this field when command lines are being displayed (the `c' interactive command.) See topic 5c. SCROLLING a Window for additional informa‐
tion on accessing any truncated data.
6. DATA -- Data + Stack Size (KiB)
The amount of physical memory devoted to other than executable code, also known as the Data Resident Set size or DRS.
7. ENVIRON -- Environment variables
Display all of the environment variables, if any, as seen by the respective processes. These variables will be displayed in their raw native order, not the sorted order you are accustomed to seeing with an unqualified
`set'.
Note: The ENVIRON field, unlike most columns, is not fixed-width. When displayed, it plus any other variable width columns will be allocated all remaining screen width (up to the maximum 512 characters). Even so, such
variable width fields could still suffer truncation. This is especially true for this field. See topic 5c. SCROLLING a Window for additional information on accessing any truncated data.
8. Flags -- Task Flags
This column represents the task's current scheduling flags which are expressed in hexadecimal notation and with zeros suppressed. These flags are officially documented in <linux/sched.h>.
9. GID -- Group Id
The effective group ID.
10. GROUP -- Group Name
The effective group name.
11. NI -- Nice Value
The nice value of the task. A negative nice value means higher priority, whereas a positive nice value means lower priority. Zero in this field simply means priority will not be adjusted in determining a task's dis‐
patch-ability.
12. P -- Last used CPU (SMP)
A number representing the last used processor. In a true SMP environment this will likely change frequently since the kernel intentionally uses weak affinity. Also, the very act of running top may break this weak affin‐
ity and cause more processes to change CPUs more often (because of the extra demand for cpu time).
13. PGRP -- Process Group Id
Every process is member of a unique process group which is used for distribution of signals and by terminals to arbitrate requests for their input and output. When a process is created (forked), it becomes a member of
the process group of its parent. By convention, this value equals the process ID (see PID) of the first member of a process group, called the process group leader.
14. PID -- Process Id
The task's unique process ID, which periodically wraps, though never restarting at zero. In kernel terms, it is a dispatchable entity defined by a task_struct.
This value may also be used as: a process group ID (see PGRP); a session ID for the session leader (see SID); a thread group ID for the thread group leader (see TGID); and a TTY process group ID for the process group
leader (see TPGID).
15. PPID -- Parent Process Id
The process ID (pid) of a task's parent.
16. PR -- Priority
The scheduling priority of the task. If you see `rt' in this field, it means the task is running under real time scheduling priority.
Under linux, real time priority is somewhat misleading since traditionally the operating itself was not preemptible. And while the 2.6 kernel can be made mostly preemptible, it is not always so.
17. RES -- Resident Memory Size (KiB)
The non-swapped physical memory a task is using.
18. RUID -- Real User Id
The real user ID.
19. RUSER -- Real User Name
The real user name.
20. S -- Process Status
The status of the task which can be one of:
D = uninterruptible sleep
R = running
S = sleeping
T = stopped by job control signal
t = stopped by debugger during trace
Z = zombie
Tasks shown as running should be more properly thought of as ready to run -- their task_struct is simply represented on the Linux run-queue. Even without a true SMP machine, you may see numerous tasks in this state
depending on top's delay interval and nice value.
21. SHR -- Shared Memory Size (KiB)
The amount of shared memory available to a task, not all of which is typically resident. It simply reflects memory that could be potentially shared with other processes.
22. SID -- Session Id
A session is a collection of process groups (see PGRP), usually established by the login shell. A newly forked process joins the session of its creator. By convention, this value equals the process ID (see PID) of the
first member of the session, called the session leader, which is usually the login shell.
23. SUID -- Saved User Id
The saved user ID.
24. SUPGIDS -- Supplementary Group IDs
The IDs of any supplementary group(s) established at login or inherited from a task's parent. They are displayed in a comma delimited list.
Note: The SUPGIDS field, unlike most columns, is not fixed-width. When displayed, it plus any other variable width columns will be allocated all remaining screen width (up to the maximum 512 characters). Even so, such
variable width fields could still suffer truncation. See topic 5c. SCROLLING a Window for additional information on accessing any truncated data.
25. SUPGRPS -- Supplementary Group Names
The names of any supplementary group(s) established at login or inherited from a task's parent. They are displayed in a comma delimited list.
Note: The SUPGRPS field, unlike most columns, is not fixed-width. When displayed, it plus any other variable width columns will be allocated all remaining screen width (up to the maximum 512 characters). Even so, such
variable width fields could still suffer truncation. See topic 5c. SCROLLING a Window for additional information on accessing any truncated data.
26. SUSER -- Saved User Name
The saved user name.
27. SWAP -- Swapped Size (KiB)
The non-resident portion of a task's address space.
28. TGID -- Thread Group Id
The ID of the thread group to which a task belongs. It is the PID of the thread group leader. In kernel terms, it represents those tasks that share an mm_struct.
29. TIME -- CPU Time
Total CPU time the task has used since it started. When Cumulative mode is On, each process is listed with the cpu time that it and its dead children have used. You toggle Cumulative mode with `S', which is both a com‐
mand-line option and an interactive command. See the `S' interactive command for additional information regarding this mode.
30. TIME+ -- CPU Time, hundredths
The same as TIME, but reflecting more granularity through hundredths of a second.
31. TPGID -- Tty Process Group Id
The process group ID of the foreground process for the connected tty, or -1 if a process is not connected to a terminal. By convention, this value equals the process ID (see PID) of the process group leader (see PGRP).
32. TTY -- Controlling Tty
The name of the controlling terminal. This is usually the device (serial port, pty, etc.) from which the process was started, and which it uses for input or output. However, a task need not be associated with a termi‐
nal, in which case you'll see `?' displayed.
33. UID -- User Id
The effective user ID of the task's owner.
34. USED -- Memory in Use (KiB)
This field represents the non-swapped physical memory a task has used (RES) plus the non-resident portion of its address space (SWAP).
35. USER -- User Name
The effective user name of the task's owner.
36. VIRT -- Virtual Memory Size (KiB)
The total amount of virtual memory used by the task. It includes all code, data and shared libraries plus pages that have been swapped out and pages that have been mapped but not used.
37. WCHAN -- Sleeping in Function
Depending on the availability of the kernel link map (System.map), this field will show the name or the address of the kernel function in which the task is currently sleeping. Running tasks will display a dash ('-') in
this column.
By displaying this field, top's own working set could be increased by over 700Kb, depending on the kernel version. Should that occur, your only means of reducing that overhead will be to stop and restart top.
38. nDRT -- Dirty Pages Count
The number of pages that have been modified since they were last written to auxiliary storage. Dirty pages must be written to auxiliary storage before the corresponding physical memory location can be used for some other
virtual page.
39. nMaj -- Major Page Fault Count
The number of major page faults that have occurred for a task. A page fault occurs when a process attempts to read from or write to a virtual page that is not currently present in its address space. A major page fault
is when auxiliary storage access is involved in making that page available.
40. nMin -- Minor Page Fault count
The number of minor page faults that have occurred for a task. A page fault occurs when a process attempts to read from or write to a virtual page that is not currently present in its address space. A minor page fault
does not involve auxiliary storage access in making that page available.
41. nTH -- Number of Threads
The number of threads associated with a process.
42. nsIPC -- IPC namespace
The Inode of the namespace used to isolate interprocess communication (IPC) resources such as System V IPC objects and POSIX message queues.
43. nsMNT -- MNT namespace
The Inode of the namespace used to isolate filesystem mount points thus offering different views of the filesystem hierarchy.
44. nsNET -- NET namespace
The Inode of the namespace used to isolate resources such as network devices, IP addresses, IP routing, port numbers, etc.
45. nsPID -- PID namespace
The Inode of the namespace used to isolate process ID numbers meaning they need not remain unique. Thus, each such namespace could have its own `init' (PID #1) to manage various initialization tasks and reap orphaned
child processes.
46. nsUSER -- USER namespace
The Inode of the namespace used to isolate the user and group ID numbers. Thus, a process could have a normal unprivileged user ID outside a user namespace while having a user ID of 0, with full root privileges, inside
that namespace.
47. nsUTS -- UTS namespace
The Inode of the namespace used to isolate hostname and NIS domain name. UTS simply means "UNIX Time-sharing System".
48. vMj -- Major Page Fault Count Delta
The number of major page faults that have occurred since the last update (see nMaj).
49. vMn -- Minor Page Fault Count Delta
The number of minor page faults that have occurred since the last update (see nMin).
首先启用 EPEL Repository:
yum -y install epel-release
启用 EPEL Repository 後, 可以用 yum 直接安裝 Htop:
yum -y install htop
安裝好 Htop 後, 啟動只需執行 “htop” 指令:
htop
https://mp.weixin.qq.com/s/_YdwciFT6qu5_kUIyylR2g
作者 | Mark Litwintschik译者 | ma.yao,小大非在开发软件或监控运行的系统时,遥测和环境监测都很重要。以便了解系统的运行状况,本文介绍了 top、Htop、Glances 三个实用工具,以及一种用于监控分布式系统的简单解决方案。
在开发软件或监控运行的系统时,遥测和环境监测都很重要。在理解了历史情境下什么是正常行为之后,通常两个最紧迫的问题是:(1)什么发生了变化?(2)什么表现出异常?
本文将介绍三个用于临时监控的流行工具,以及一种用于监控分布式系统的简单解决方案。
top
在几乎任何类 UNIX 的现代操作系统中,都可以通过输入 top 来查看一些系统性能指标,这些指标每几秒钟更新一次。
$ top -b -n2 -d5top - 09:43:05 up 1:08, 0 users, load average: 0.52, 0.58, 0.59
Tasks: 4 total, 1 running, 3 sleeping, 0 stopped, 0 zombie
%Cpu0 : 4.1 us, 22.2 sy, 0.0 ni, 72.3 id, 0.0 wa, 1.4 hi, 0.0 si, 0.0 st
%Cpu1 : 4.3 us, 7.1 sy, 0.0 ni, 87.7 id, 0.0 wa, 0.9 hi, 0.0 si, 0.0 st
%Cpu2 : 4.4 us, 9.0 sy, 0.0 ni, 85.3 id, 0.0 wa, 1.2 hi, 0.0 si, 0.0 st
%Cpu3 : 3.6 us, 6.7 sy, 0.0 ni, 88.6 id, 0.0 wa, 1.0 hi, 0.0 si, 0.0 st
KiB Mem: 33431016 total, 9521052 used, 23909964 free, 34032 buffers
KiB Swap: 62455548 total, 27064 used, 62428484 free. 188576 cached Mem
PID USER PR NI VIRT RES SHR S %CPU %MEM TIME+ COMMAND
1 root 20 0 8304 132 104 S 0.0 0.0 0:00.14 /init ro
3 root 20 0 8308 96 56 S 0.0 0.0 0:00.00 /init ro
4 mark 20 0 17856 5308 5192 S 0.0 0.0 0:00.35 -bash
228 mark 20 0 14452 1668 1172 R 0.0 0.0 0:00.01 top -b -n2 -d5其二进制执行过程与 Comcast 公司的 James Warner 编写的 top 版本最相似。这个版本的 top 是全新的,并且是作为由包括 Lockheed Martin and Heidelberg University 在内的各个组织开发人员的合写版本的替代品开发而成的。
top.c 源代码本身相当简单,在撰写本文时,总共有 约 4900 行 C 代码。目前 top 仍然处于开发过程中,其源代码可以在 GitLab 的 procps 仓库(https://gitlab.com/procps-ng/procps)找到。该仓库中还包含其他工具,包括 kill、ps、sysctl、uptime 和 watch。
其默认布局一直没有改变过。但是通过过去几十年与 UNIX 系统打交道,每次在一台新机器上使用 top,我都会习惯性地输入 zc1M。
top 默认采用单色显示模式,使用 z 将切换至指定颜色模式。数字 1 将显示单个 CPU 的状态,并且能够突出显示单个 CPU 核的负载。我喜欢输入 M,以查看基于内存容量使用压力排序后的各进程信息。top 总共提供了 49 个供查看和排序的指标。
默认情况下,命令会截断显示,输入 c 会显示有关其路径和参数的更多扩展信息。 我唯一不满意的是命令和参数被截断了。如果只保留每条命令和参数的开头与结尾,以便区分不同进程,会更加实用。
top 配置的更改只会在当前 session 有效。为了解决这个问题,输入大写的 W 会默认将当前配置保存到~/.toprc 中。我对该文件唯一不满的地方是,它包含了大于 0x7F 的字节值,因而不易在 top 之外对其进行更改。
$ hexdump -C ~/.toprc | head00000000 74 6f 70 27 73 20 43 6f 6e 66 69 67 20 46 69 6c |top's Config Fil|
00000010 65 20 28 4c 69 6e 75 78 20 70 72 6f 63 65 73 73 |e (Linux process|
00000020 65 73 20 77 69 74 68 20 77 69 6e 64 6f 77 73 29 |es with windows)|
00000030 0a 49 64 3a 69 2c 20 4d 6f 64 65 5f 61 6c 74 73 |.Id:i, Mode_alts|
00000040 63 72 3d 30 2c 20 4d 6f 64 65 5f 69 72 69 78 70 |cr=0, Mode_irixp|
00000050 73 3d 31 2c 20 44 65 6c 61 79 5f 74 69 6d 65 3d |s=1, Delay_time=|
00000060 33 2e 30 2c 20 43 75 72 77 69 6e 3d 30 0a 44 65 |3.0, Curwin=0.De|
00000070 66 09 66 69 65 6c 64 73 63 75 72 3d a5 a8 b3 b4 |f.fieldscur=....|
00000080 bb bd c0 c4 b7 ba b9 c5 26 27 29 2a 2b 2c 2d 2e |........&')*+,-.|
00000090 2f 30 31 32 35 36 38 3c 3e 3f 41 42 43 46 47 48 |/012568<>?ABCFGH|Htop
2004 年,Hisham Muhammad 开始致力于创建一个截然不同的系统遥测监控工具。Htop 关注遥测显示的重新布局:使用条形图展示 CPU 和内存的关键指标;使用 F5 快捷键,使进程信息在扁平化列表和层次结构之间切换显示;通过鼠标点击,可以实现属性排序;并且支持 7 种不同的颜色模式。
该软件能够很好地使您停留在应用当中。如果您想要查看一个进程使用的文件,您可以选择该进程,并只需输入 l;如果您想要通过 strace 运行该进程,在以授权用户身份运行 htop 的情况下,只需输入 s。
在 Ubuntu 16.04.2 LTS 上安装和运行 htop:
$ sudo apt install htop
$ htop
1 [ 0.0%] Tasks: 37, 145 thr; 1 running
2 [ 0.0%] Load average: 0.03 0.05 0.07
3 [ 0.0%] Uptime: 01:31:42
4 [ 0.0%]
Mem[|||||||||||||||||||||||||||||||| 1.03G/3.84G]
Swp[ 0K/4.00G]
PID USER PRI NI VIRT RES SHR S CPU% MEM% TIME+ Command
1 root 20 0 37556 5668 4004 S 0.0 0.1 0:03.03 /sbin/init noprompt
27884 clickhous 20 0 3716M 359M 49184 S 0.7 9.1 0:24.93 ├─ /usr/bin/clickhouse-server --config=/etc/cli
29668 clickhous 20 0 3716M 359M 49184 S 0.0 9.1 0:00.10 │ ├─ /usr/bin/clickhouse-server --config=/etc/
29667 clickhous 20 0 3716M 359M 49184 S 0.0 9.1 0:01.02 │ ├─ /usr/bin/clickhouse-server --config=/etc/
29666 clickhous 20 0 3716M 359M 49184 S 0.0 9.1 0:00.08 │ ├─ /usr/bin/clickhouse-server --config=/etc/
29665 clickhous 20 0 3716M 359M 49184 S 0.0 9.1 0:00.48 │ ├─ /usr/bin/clickhouse-server --config=/etc/
29409 clickhous 20 0 3716M 359M 49184 S 0.0 9.1 0:03.48 │ ├─ /usr/bin/clickhouse-server --config=/etc/
29408 clickhous 20 0 3716M 359M 49184 S 0.0 9.1 0:02.15 │ ├─ /usr/bin/clickhouse-server --config=/etc/至于配置方面,使用该软件的过程中,任何配置修改都会默认自动保存至~/.config/htop/htoprc。该文件是个文本文件,但是附有下面的警告:
$ head -n2 ~/.config/htop/htoprc# Beware! This file is rewritten by htop when settings are changed in the interface.
# The parser is also very primitive, and not human-friendly.鉴于其提供的功能比较简单,它的源代码量还是相当小的。在撰写本文时,它总共有约 12000 行 C 代码,同时还包含约 3000 行代码的其他文件。
Glances
Glances (https://nicolargo.github.io/glances/)是一个基于 Python 的系统遥测监控工具。该项目由 Nicolas Hennion 于 2011 年开始创建。Nilcolas 的领英简介显示,他在法国南部的 Thales Alenia Space 卫星控制中心部门担任项目经理。
当启动 Glances 时,除了常见的 CPU、内存和进程列表,还将看到云虚拟机类型以及网络、硬盘、和 Docker 容器活动等等。
$ glancesubuntu (Ubuntu 16.04 64bit / Linux 4.4.0-62-generic) Uptime: 18:55:00
CPU [ 1.7%] CPU - 1.7% nice: 0.0% ctx_sw: 923 MEM - 53.1% SWAP - 0.1% LOAD 4-core
MEM [ 53.1%] user: 0.8% irq: 0.0% inter: 587 total: 3.84G total: 4.00G 1 min: 0.20
SWAP [ 0.1%] system: 0.7% iowait: 0.0% sw_int: 786 used: 2.04G used: 3.27M 5 min: 0.14
idle: 98.4% steal: 0.0% free: 1.80G free: 3.99G 15 min: 0.10
NETWORK Rx/s Tx/s TASKS 203 (349 thr), 1 run, 202 slp, 0 oth sorted automatically by CPU consumption
ens33 152b 3Kb
lo 59Kb 59Kb CPU% MEM% VIRT RES PID USER TIME+ THR NI S R/s W/s Command
2.6 4.5 524M 178M 16470 mark 35:48 1 0 S 0 0 /home/mark/.
DISK I/O R/s W/s 2.3 0.6 372M 24.5M 14672 mark 0:01 1 0 R 0 0 /home/mark/.
fd0 0 0 1.0 23.7 5.42G 931M 21151 root 13:00 71 0 S ? ? java -Xmx1G
loop0 0 0 0.7 9.8 3.71G 385M 27884 clickhous 5:29 46 0 S ? ? /usr/bin/cli
loop1 0 0 0.3 2.8 3.53G 109M 12883 zookeeper 1:36 20 0 S ? ? /usr/bin/jav
loop2 0 0 0.3 0.2 31.4M 6.80M 333 root 0:53 1 0 S ? ? /lib/systemd
loop3 0 0 0.3 0.1 13.8M 2.68M 4353 mark 1:07 1 0 S 0 0 watch ifconf
loop4 0 0 0.0 0.3 186M 9.86M 1447 root 0:35 2 0 S ? ? /usr/bin/vmt
loop5 0 0 0.0 0.2 75.2M 8.11M 1470 root 0:00 1 0 S ? ? /usr/bin/VGA
loop6 0 0 0.0 0.2 90.6M 6.59M 4381 root 0:00 1 0 S ? ? sshd: mark [
loop7 0 0 0.0 0.1 269M 5.75M 595 root 0:13 3 0 S ? ? /usr/lib/acc
sda 0 78K 0.0 0.1 36.7M 5.37M 1 root 0:37 1 0 S ? ? /sbin/init n
sda1 0 78K 0.0 0.1 64.0M 5.31M 4246 root 0:00 1 0 S ? ? /usr/sbin/ss
sda2 0 0 0.0 0.1 44.3M 5.05M 3402 mark 0:00 1 0 S 0 0 /lib/systemd
sda5 0 0 0.0 0.1 21.8M 5.04M 4403 mark 27:23 1 0 S 0 0 -bash
sr0 0 0 0.0 0.1 21.8M 4.93M 21493 mark 0:10 1 0 S 0 0 /bin/bash
sr1 0 0 0.0 0.1 21.7M 4.62M 16114 mark 0:03 1 0 S 0 0 /bin/bash
0.0 0.1 21.7M 4.47M 21119 mark 0:00 1 0 S 0 0 /bin/bash
FILE SYS Used Total 0.0 0.1 90.6M 4.14M 4402 mark 0:08 1 0 S ? ? 0
/ (sda1) 2.48G 15.6G 0.0 0.1 250M 3.97M 588 syslog 0:28 4 0 S ? ? /usr/sbin/rs
0.0 0.1 21.8M 3.87M 3407 mark 0:04 1 0 S 0 0 -bash
SENSORS 0.0 0.1 51.5M 3.76M 21144 root 0:00 1 0 S ? ? sudo nohup /
Physical id 100C 0.0 0.1 41.9M 3.64M 597 messagebu 0:00 1 0 S ? ? /usr/bin/dbu
Core 0 100C 0.0 0.1 43.2M 3.45M 396 root 0:01 1 0 S ? ? /lib/systemd
Core 1 100C 0.0 0.1 64.3M 3.21M 3377 root 0:00 1 0 S ? ? /bin/login -
Core 2 100C 0.0 0.1 28.0M 2.91M 592 root 0:00 1 0 S ? ? /lib/systemd
Core 3 100C 0.0 0.1 26.7M 2.86M 16113 mark 0:06 1 0 S ? ? SCREEN
0.0 0.1 15.7M 2.81M 774 root 0:00 1 0 S ? ? /sbin/dhclieGlances 由约 1 万行 Python 代码和约 2.5 万行 JavaScript 代码写成,并依赖于 psutil (https://github.com/giampaolo/psutil/)软件包以用于遥测数据收集。它还含有大量 插件,包括支持监控 GPU、Kafka、RAID 设置、文件夹监控以及 WiFi 等等。
除了基于 ncurses 的界面,Glances 也能以 Web 应用的形式运行。当在 Windows 10 上通过 cmd.exe 运行 Glances 的时候,将启动一个运行在 TCP 端口为 61209 的 Bottle Web 应用。在浏览器中打开 http://127.0.0.1:61209,会看到一个AngularJS 应用程序的欢迎页面。该页面模仿了 ncurses 界面。
也可以通过调用其暴露的 API 接口,配合其他工具使用:
$ curl http://127.0.0.1:61209/api/3/all \
    | python -mjson.tool \
    | head -n50
{
    "alert": [],
    "amps": [],
    "batpercent": [],
    "cloud": {},
    "core": {
        "log": 4,
        "phys": 4
    },
    "cpu": {
        "cpucore": 4,
        "ctx_switches": 182358,
        "idle": 82.9,
        "interrupts": 113134,
        "soft_interrupts": 0,
        "syscalls": 215848,
        "system": 12.5,
        "time_since_update": 8.532670974731445,
        "total": 9.8,
        "user": 3.1
    },
    "diskio": [
        {
            "disk_name": "PhysicalDrive6",
            "key": "disk_name",
            "read_bytes": 0,
            "read_count": 0,
            "time_since_update": 8.492774963378906,
            "write_bytes": 0,
            "write_count": 0
        },
        {
            "disk_name": "PhysicalDrive2",
            "key": "disk_name",
            "read_bytes": 0,
            "read_count": 0,
            "time_since_update": 8.492774963378906,
            "write_bytes": 0,
            "write_count": 0
        },
...
虽然默认的配置文件(https://github.com/nicolargo/glances/blob/develop/conf/glances.conf)有些冗长,但是用户编辑起来还算方便。
Glances 还支持将遥测数据导出到 16 个以上不同的目标文件中,包括 StatsD、Kafka、RabbitMQ、JSON、SVG、ElasticSearch、CSV 以及自定义 RESTful API。
将 Glances 导入 Kafka
以下将介绍将遥测数据导入 CSV 文件,再导入 Kafka。我认为本地硬盘通常要比网络连接更靠谱。当网络连接出现问题的时候,我们还可以利用本地文件再次回填 Kafka。
以下命令运行在新安装的 Ubuntu 16.04.2 LTS 上:
$ sudo apt update
$ sudo apt install \
    kafkacat \
    python-pip \
    python-virtualenv \
    screen \
    zookeeperd
使用 Apache 镜像上的二进制包,手动安装 Kafka:
$ sudo mkdir -p /opt/kafka
$ wget -c -O kafka.tgz \
    http://www-eu.apache.org/dist/kafka/1.1.1/kafka_2.11-1.1.1.tgz
$ sudo tar xzvf kafka.tgz \
    --directory=/opt/kafka \
    --strip 1
为 Kafka 创建日志文件,其权限使用我的 UNIX 账号:
$ sudo touch /var/log/kafka.log
$ sudo chown mark /var/log/kafka.log
ZooKeeper 支持了 Kafka 的大多数分布式功能,以下命令将启动 ZooKeeper 服务:
$ sudo /etc/init.d/zookeeper start启动完 ZooKeeper,启动 Kafka 服务器进程:
$ sudo nohup /opt/kafka/bin/kafka-server-start.sh \
             /opt/kafka/config/server.properties \
             > /var/log/kafka.log 2>&1 &
创建 Python 虚拟环境,并安装 Glances 以及 CSVKit,以便分析 Glances 的 CSV 文件输出:
$ virtualenv ~/.monitoring
$ source ~/.monitoring/bin/activate
$ pip install \
    csvkit \
    glances
接着,启动 screen 会话和 Glances。它将显示 ncurses 界面,并向~/glances.csv 中写入 215 条数据:
$ screen
$ glances --export csv \
          --export-csv-file ~/glances.csv
一旦运行起来,按 CTRL-A,接着按 CTRL-D,返回到常规的 Shell 界面。
如下所示,这里有大量收集到的遥测数据:
$ csvstat --type ~/glances.csv | tail206. mem_available: Number
207. mem_used: Number
208. mem_cached: Number
209. mem_percent: Number
210. mem_free: Number
211. mem_inactive: Number
212. mem_active: Number
213. mem_shared: Number
214. mem_total: Number
215. mem_buffers: NumberKafkacat 是采用 C 语言写的一个非 JVM 的 Kafka 生产者和消费者。静态链接的包大小要小于 150KB。使用它,将~/glances.csv 中的内容导入 Kafka Topic “glances_log”中,并对内容进行 Snappy 压缩。
$ screen
$ tail -F ~/glances.csv \
    | kafkacat -b localhost:9092 \
               -t glances_log \
               -z snappy
接下来,一旦运行起来,按 CTRL-A,然后按 CTRL-D,返回到常规 Shell 界面。
以上这些运行在 screen 会话中的任何命令,都可以方便地添加到 Supervisord。另外,如果这些进程因为任何原因挂了,都能很好地重启它们。
完成上述操作之后,查看前 100 条记录的前三列数据:
$ /opt/kafka/bin/kafka-console-consumer.sh \
        --topic glances_log \
        --from-beginning \
        --zookeeper localhost:2181 \
    | head -n100 \
    | csvstat --columns 1-3 \
              --no-header-row
以下是基于前 100 条记录,收集到的时间戳、CPU 核数以及一分钟负载均值的统计信息:
1. "a"

      Type of data:          DateTime
      Contains null values:  False
      Unique values:         100
      Smallest value:        2018-10-07 05:53:49
      Largest value:         2018-10-07 05:58:55
      Most common values:    2018-10-07 05:53:49 (1x)
                             2018-10-07 05:53:52 (1x)
                             2018-10-07 05:53:55 (1x)
                             2018-10-07 05:53:58 (1x)
                             2018-10-07 05:54:01 (1x)

2. "b"

      Type of data:          Number
      Contains null values:  False
      Unique values:         1
      Smallest value:        4
      Largest value:         4
      Sum:                   400
      Mean:                  4
      Median:                4
      StDev:                 0
      Most common values:    4 (100x)

3. "c"

      Type of data:          Number
      Contains null values:  False
      Unique values:         18
      Smallest value:        0.02
      Largest value:         0.22
      Sum:                   6.57
      Mean:                  0.066
      Median:                0.05
      StDev:                 0.045
      Most common values:    0.04 (15x)
                             0.02 (14x)
                             0.03 (13x)
                             0.06 (9x)
                             0.05 (9x)
英文原文:http://tech.marksblogg.com/top-htop-glances.html
https://aniyo.iteye.com/blog/1454524
名称:top
使用权限:所有使用者
使用方式:top [-] [d delay] [q] [c] [S] [s] [i] [n] [b]
说明:实时显示 process 的动态
参数:
d : 改变显示的更新速度,或是在交谈式指令列( interactive command)按 s
q : 没有任何延迟的显示速度,如果使用者是有 superuser 的权限,则 top 将会以最高的优先序执行
c : 切换显示模式,共有两种模式,一是只显示执行档的名称,另一种是显示完整的路径与名称S : 累积模式,会将己完成或消失的子行程 ( dead child process ) 的 CPU time 累积起来
s : 安全模式,将交谈式指令取消, 避免潜在的危机
i : 不显示任何闲置 (idle) 或无用 (zombie) 的行程
n : 更新的次数,完成后将会退出 top
b : 批次档模式,搭配 "n" 参数一起使用,可以用来将 top 的结果输出到档案内
范例:
显示更新十次后退出 ;
top -n 10
使用者将不能利用交谈式指令来对行程下命令 :
top -s
将更新显示二次的结果输入到名称为 top.log 的档案里 :
top -n 2 -b < top.log
高效的使用 top 已翻译 100%
对桌面用户来说,监视系统资源使用是一项重要的工作。通过这项工作,我们可以找到系统瓶颈所在,针对性的进行系统优化,识别内存泄露等。问题是,我们应该用什么软件,以及如果针对我们的需求使用它。
在众多备选的监测工具中,多数人使用“top”(procps 包的一部分)。Top 提供了几乎可以说是所有的我们所需要的系统资源使用监测,就在这一个软件中。本文中的所有信息都是基于运行在 Linux 2.6.x 内核上的版本号为3.2.5的 procps 包。
在这里,我们假定 procps 已经安装并运行在你的 Linux 系统中。这里无需你对 top 的使用经验,但如果你尝试去用一下,将更有利。
下面是一些挑战:
A.交互还是批处理模式?
默认情况下,Top 被调用时使用交互模式。在此模式下,Top 无限期运行,并可以通过按键重新定义 Top 的运行方式。但是,有时你需要对 Top 的输出进行后续处理,但这在此模式下难以实现。解决方法?使用批处理模式。
$ top -b
你将获得类似下面的输出: top - 15:22:45 up 4:19, 5 users, load average: 0.00, 0.03, 0.00
Tasks: 60 total, 1 running, 59 sleeping, 0 stopped, 0 zombie
Cpu(s): 3.8% us, 2.9% sy, 0.0% ni, 89.6% id, 3.3% wa, 0.4% hi, 0.0% si
Mem: 515896k total, 495572k used, 20324k free, 13936k buffers
Swap: 909676k total, 4k used, 909672k free, 377608k cached
PID USER PR NI VIRT RES SHR S %CPU %MEM TIME+ COMMAND
1 root 16 0 1544 476 404 S 0.0 0.1 0:01.35 init
2 root 34 19 0 0 0 S 0.0 0.0 0:00.02 ksoftirqd/0
3 root 10 -5 0 0 0 S 0.0 0.0 0:00.11 events/0
哈,等等,它是不断重复运行的,同交互模式一样。不用担心,你可以使用 -n 限制重复数量。所以,如果你希望获得一次性结果,键入: $ top -b -n 1
这一模式的真正优势在于你可以很容易的与 at 或 cron 命令结合。它们的结合,使得 Top 可以在特定时间对资源使用状态进行快照。例如,使用 at ,我们可以设定 top 在一分钟之后运行。
$ cat ./test.at
TERM=linux top -b -n 1 >/tmp/top-report.txt
$ at -f ./test.at now+1minutes
细心的读者可能会问“在创建新任务时,为什么我需要在调用 Top 之前设置环境变量 TERM?”。答案是,Top 运行时需要此变量,但“at”在定时调用时并不会保留它。同上面那样简单的设置可以确保 Top 正常运行。

B.如何监控制定进程?
有时,我们只对几个进程感兴趣,可能只是全部进程中的4个或5个。例如,如果你想要监测进程标识(PID)为4360和4358的进程,你需要键入:
$ top -p 4360,4358
或
$ top -p 4360 -p 4358
看起来很简单,只需要使用 -p 列出所有需要的 PID,并使用逗号间隔或简单的多次使用 -p即可。
另一种可能是监测拥有特定用户标识(UID)的进程。应对此需求,你可以使用 -u 或 -U 选项。假设用户“johndoe”的 UID 为500,键入:
$ top -u johndoe
OR
$ top -u 500
或
$ top -U johndoe
结论是,你既可以纯使用用户名,也可使用数字 UID。“-u,-U?这两者不同?”是的。同多数其它 GNU 工具一样,选项是大小写敏感的。-U 意味着 Top 将会搜索有效的、真实的、被保存的以及文件系统的 UID 进行匹配,而 -u 仅匹配有效的用户id。要知道,每一个 *nix 进程在运行时都是用有效用户标识(effective UID),而其中有些并不等同真实用户标识。多数情况是,对类似文件系统权限或操作系统功能这项的有效用户标识感兴趣的人将会检查它,而不是 UID。
不同于 -p 仅用于命令行选项,-U 和 -u 都可以在交互模式中使用。同你猜测的一样,键入‘U’或‘u’可以依据用户名过滤进程。同样的规则依然适用,‘u’为有效用户标识,‘U’为 真实/有效/保存/文件系统用户名。你将被要求键入用户名或数字 UID。
C.快熟还是缓慢更新?
在回答这个问题之前,让我们先简单介绍一下,Top 是如何运行的。这里,Strace 能够帮助你:
$ strace -o /tmp/trace.txt top -b -n 1
使用你偏爱的文本编辑器打开 /tmp/trace.txt。你怎么想?一次调用有太多的活要做了,反正我是这么想的。Top 在每次遍历中必做的工作之一就是打开很多文件,并解析其内容,可以看看次数:
$ grep open( /tmp/hasil.txt | wc -l
举例而言,我的 Linux 中,这个数量是304.仔细观察就会发现,Top 遍历 /proc 文件夹,以收集进程信息。/proc 本身是一个虚拟文件系统,意味着它并非存在于真实硬盘之中,而是由 Linux 内核凭空创建,保存在内存中的。在文件夹中,如/proc/2097(2097为 PID),Linux 内核将与之关联的信息打印到此文件中,而这里就是 Top 的消息来源。
同时试一下:
$ time top -b -n 1
这样你就能了解到 Top 单轮工作有多快了。在我的系统中,大约为0.5-0.6秒。看“real”字段,不是“user”或“system”字段,因为“real”字段反应了 Top 工作需要的总时间。
所以,有了这个认知之后,使用适度的更新间隔是明智的。基于文件系统访问内存也是需要时间的。经验法则是,对于多数用户来说,1到3秒的间隔就足够了。在命令行中使用-d,或在交互模式下按下“s”以设置。你可以使用类似2.5,4.1这样的小树。
什么时候我们需要快于1秒的更新?
- 时间段内需要更多的样本。应对这点要求,最好使用批处理模式,并将标准输出重定向到文件中,以便更好的分析。
- 你并不在意 Top 消耗的额外CPU负荷。是的,虽然它很小,它依然需要负荷。如果你的 Linux 系统相对比较空闲,随意使用短间隔,如果不是,最好为重要的任务保留你的 CPU 时间。
一个减少 Top 工作的办法是只监测特定的几个 PID。这样,Top 无需遍历 /proc 下所有的子文件夹。用户名过滤呢?并不会变得更好。用户名过滤会给Top带来额外工作量,因此将其与短间隔联合将会增加 CPU 负荷。
当然,当你需要强制更新时,按下 Space 键,Top 将会刷新统计。
D.我们需要的字段
默认时,Top 启动后会显示下面的任务属性:
| 字段 | 描述 |
|---|---|
| PID : | 进程 ID |
| USER : | 有效用户 ID |
| PR : | 动态优先值 |
| NI : | 良好值,也被称为基本优先级 |
| VIRT : | 任务虚拟大小。包括进程的可执行二进制文件大小,数据区大小以及所有已加载的共享库的大小。 |
| RES : | 目前任务内存消耗。存入交换分区的部分并不包含。 |
| SHR : | 一些内存区域可能由两个或多个任务分享,此字段反应这些共享区域。例如共享库以及 Sysv 共享内存。 |
| S : | 任务状态 |
| %CPU : | Top 屏幕更新时专用于运行任务的CPU 时间百分比。 |
| %MEM : | 任务当前内存消耗的百分比 |
| TIME+ : | 在任务启动后消耗的总CPU时间。"+" sign means it is displayed with hundreth of a second granularity. 默认时,TIME/TIME+ 不会计入已经关闭的任务子进程。 |
| COMMAND : | 显示程序名。 |
| 列 | 描述 |
|---|---|
| nFLT ('u'键) |
进程启动以来重大页面错误(page fault)的个数。准确地说,页面错误是由于进程访问它的地址空间内不存在的页面引起的。“重大”的页面错误是指内核需要访问磁盘来使得该页面有效。相反,小型页面错误是指内核只需要在内存中分配页面而不用读磁盘。 例如,假设程序ABC的大小为8KB,页面大小为4KB。当程序读进内存的时候,发生了两次重大的页面错误(2*4KB)。程序本身分配了8KB空间当作临时数据。因此,还会有两次小型页面错误。 nFLT过高可能意味着:
当进程第一次运行时,看到大量重大页面错误很正常。下次运行的时候,由于缓存已经分配好了,你很可能看到"0"次或者很小的 nFLT。但是,如果一个程序频繁地触发重大页面错误,很有可能是你目前安装的内存不够那个程序使用。 |
| nDRT ('v'键) |
上次页面写入磁盘以来,脏页面的数目。 什么是脏页面?先看一点背景知识。大家都知道,Linux使用了缓存系统,所以从磁盘读取的数据也会被缓存到内存中。这样做的优点是,后续的对这个磁盘块的读操作可以直接从内存中取数据,因而速度更快。 但这也是有代价的。如果缓冲区的内容被修改了,那么就需要进行同步。因此,被更改的缓冲区(脏页面)必需写回到磁盘中。同步失败则可能导致磁盘上的数据不一致。 在负载不重的系统中,nDRT 通常小于10(大约估计)或者为0。如果你的系统通常大于10,则有可能:
现在的话,(1) 不太可能出现,因为I/O速度越来越快,需要更少的CPU(DMA技术的出现)。所以 (2) 出现的概率更高。 注意:在 2.6.x 内核中, 不知道为什么,这个列的值总是0。 |
| P ('j'键) |
上次使用的CPU。这个列只在SMP环境中有意义。这里的SMP指超线程,多核或者多CPU架构。如果你只有一个CPU(不是多核,没有超线程),这个列总是显示0。 在SMP系统中,即使这个列有几次改变,也不要吃惊。这意味着,Linux 内核尝试将你的进程移到另一个负载更少的CPU。 |
| CODE ('r'键) 和 DATA ('s'键) |
CODE 只是反映了你程序代码的大小,DATA反映了你数据段(栈,堆,变量,不包含共享库) 的大小。单位都是KB。 DATA可以显示你的程序分配了多少内存。有时,也可以用来协助分析内存泄漏。当然,你需要更好的工具,如使用 valgrind 来查看每次的内存分配。如果DATA不断增长,则很有可能出现了内存泄漏。 注意:DATA, CODE, SHR, SWAP, VIRT, RES 都是使用页面大小(Intel架构上为4KB)来衡量。只读数据段也包含在CODE的大小中,因而有时候CODE比实现的段要大。 |
| SWAP ('p'键) |
已经进行交换的进程内存映像大小。这个列有时很让人疑惑: 逻辑上,你可能期望这个列显示你的程序实际上是完全进行交换,还是部分交换了,交换了多少。但是事实上不是。即使"Swap used" 列显示为0,你仍然可以很吃惊地发现所有进程的SWAP列都大于0。到底是为什么呢? 这是由于 top 命令使用如下的计算公式: VIRT = SWAP + RES or equal
SWAP = VIRT - RES
前面说过,VIRT 包含了进程的地址空间里面的所有东西:内存中的,已经进行交换的,尚未从磁盘读取的。RES 代表了进程占用的全部内存大小。所以,这里的SWAP代表了已经进行交换的全部数据,以及尚未从磁盘读取的数据。不要被SWAP这个名字迷惑了,它代表的不只是已经交换的数据。 |

要显示以上的列,在交互模式下按 'f' 键,然后再按相应的键。按一下显示指定的列,再按一下隐藏该列。要确定当前显示的是哪些列,只需看第一行的字母(在"Current Fields"的右边)。大写字母表示显示了该列,小写表示隐藏。你选好以后,按回车即可。
排序使用了类似的方法。按 'O' (大写),然后再按相应的键。即使记不住那些按键也没关系,top 会显示出来。新的排序键将标上星号,相应的字母会变成大写,很直观。选好以后,记得按回车。
E.多视图比单个视图更好吗?
在不同的情况下,有时候我们想监视不同的系统属性。例如,你想同时监控CPU的百分比和CPU被所有任务消耗的时间。在另一段时间,你想监控常驻内存和所有任务的总页面故障。快速按‘F’键然后切换界面?我想这也太不明智了吧。
为什么不试试多视图窗口模式呢?按‘A’(大写)切换到多窗口界面。默认的,你将会看到4个不同的系列的字段组。每个字段组有默认的标签/名称:
第一字段组: Def
第二字段组: Job
第三字段组: Mem
第四字段组: Usr
第一字段组就是你在单一视图窗口所常见的组,而其余的组会被隐藏。内置多视图窗口模式,所有可用的窗口通过按‘a’或者‘w’循环。注意,切换到其他窗口时会改变活动窗口(也称为当前窗口)。假如你不确定哪一个是活动窗口的话,只需要看一下top展示的第一行(在当前时间字段的左边)。另一个改变活动窗口的方法是通过按‘G’紧跟着输入数字(1到4)。
活动窗口是针对用户输入的,因此在开始干活之前确定选好了你偏好的界面。然后,你可以在单一窗口模式下爱干嘛干嘛。在这种情况你一般想自定义字段展示,那么你只需要按‘f’然后开始自定义。
假如你认为第四字段组太多的话,你只需要切换到字段组然后按‘-’隐藏。请注意,即使你隐藏了当前的字段组,那并不以意味着你同时改变了活动组。再次按‘-’的话,当前组就可见了。
如果你想操作多视图窗口模式,再次按‘A’键。那样也将使得活动组成为了单一视图窗口模式的新的字段组。

F. "我的Linux主机上怎么会只有很少的空闲内存?"
有同样的问题? 不管你在主板上增加多少内存,你都会很快发现空闲内存减少的非常迅速. 空闲内存算错了? 不!
在回答这个之前, 先查看一下top命令顶部显示的内存概要 (有可能你需要按 'm'来显示出来). 在这里,你可以看到两个区域: 缓冲(buffers)和缓存(cached)。 "缓冲(Buffers)" 代表有多少内存用来缓存磁盘块 "缓存(Cached)" 有一点类似 "缓冲(Buffers)", 只是仅仅从文件读取缓存页面. 想透彻了解这部分,建议读一下Linux内核的书比如Robert M.Love写的《Linux Kernel Development》。
这足够了解缓冲(buffers)和缓存(cached)代表系统缓存. 他们会根据linux内核机制动态增加或减少。
除去被缓存的消耗,程序和代码同样要占据RAM. 所以,最终空闲内存显示的是RAM中不被缓存和程序/代码占用的部分 一般来说,你也可以考虑缓存区域为另一部分“空闲”RAM,如果程序需要更多内存它会减少
从进程的角度来看,你可能想知道哪个区域代表真实的内存消耗,VIRT(virtual memory usage )区域? 当然不是! 回顾一下,这个区域代表了进程地址空间里一切,包括相关的库。阅读top命令的源代码和proc.txt (在内核代码树中的Documentation/filesystem 文件夹内), 我的结论是RSS字段是进程内存消耗的最好的描述.我说“最好的”是因为你可以考虑它是近似而不是所有时间100%准确。
G.使用数个保存的配置
希望保存多个不同的配置文件,以便于轻松的切换预配置视图?只需要创建一个 Top 二进制文件的软连接到你喜欢的名字:
# ln -s /usr/bin/top /usr/bin/top-a
然后运行新的“top-a”。调整完毕后键入‘W’保存配置,它将被保存到 ~/.top-arc(格式为你的 Top 别名+rc)。
这样,运行原来的 Top 可以使用之前的视图,而 top-a 则使用第二个,依次类推。
H.总结
有很多窍门使用top会更加高效。关键是知道你真正需要的是什么和可能的对Linux低级别原理的一般理解。统计并不总是正确,但至少有助于总体衡量。所有这些数字收集自 /proc,因此首先确保它已挂载!
参考:
- Understanding The Linux Kernel,第二版。
- 内核源代码树里的/filesystems/proc.txt文档。
- Linux 内核源代码。
top排序
top 运行中可以通过 top 的内部命令对进程的显示方式进行控制。内部命令如下表:
s – 改变画面更新频率
l – 关闭或开启第一部分第一行 top 信息的表示
t – 关闭或开启第一部分第二行 Tasks 和第三行 Cpus 信息的表示
m – 关闭或开启第一部分第四行 Mem 和 第五行 Swap 信息的表示
N – 以 PID 的大小的顺序排列表示进程列表
P – 以 CPU 占用率大小的顺序排列进程列表
M – 以内存占用率大小的顺序排列进程列表
h – 显示帮助
n – 设置在进程列表所显示进程的数量
q – 退出 top
s – 改变画面更新周期
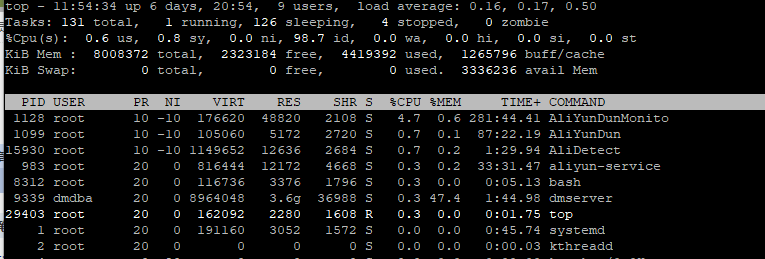
第三部分 — 最下部分的进程列表栏:
以 PID 区分的进程列表将根据所设定的画面更新时间定期的更新。通过 top 内部命令可以控制此处的显示方式。
一般的,我们通过远程监控的方式对服务器进行维护,让服务器本地的终端实时的运行 top ,是在服务器本地监视服务器状态的快捷便利之一。
调整排序的列:在进程信息界面按shift+f,进入可以作为排序的列的列表页面。键入字母即可选择按哪列排序
改变排序方法:默认降序排列。如果需要改成升序,则在进程信息界面按R

 浙公网安备 33010602011771号