DOM leaks DOM泄露
Record heap snapshots - Chrome Developers
https://developer.chrome.com/docs/devtools/memory-problems/heap-snapshots/
Uncover DOM leaks
The heap profiler has the ability to reflect bidirectional dependencies between browser native objects (DOM nodes, CSS rules) and JavaScript objects. This helps to discover otherwise invisible leaks happening due to forgotten detached DOM subtrees floating around.
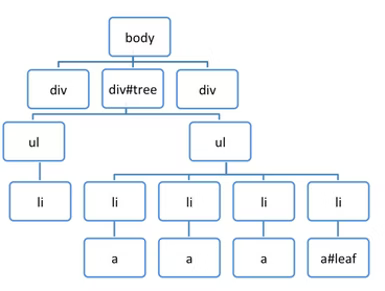
DOM leaks can be bigger than you think. Consider the following sample - when is the #tree GC?
  var select = document.querySelector;
  var treeRef = select("#tree");
  var leafRef = select("#leaf");
  var body = select("body");

  body.removeChild(treeRef);

  //#tree can't be GC yet due to treeRef
  treeRef = null;

  //#tree can't be GC yet due to indirect
  //reference from leafRef

  leafRef = null;
  //#NOW can be #tree GC
#leaf maintains a reference to it's parent (parentNode) and recursively up to #tree, so only when leafRef is nullified is the WHOLE tree under #tree a candidate for GC.

Examples: Try out this example of leaking DOM nodes to understand where DOM nodes can leak and how to detect them. You can follow it up by also looking at this example of DOM leaks being bigger than expected.
To read more about DOM leaks and memory analysis fundamentals checkout Finding and debugging memory leaks with the Chrome DevTools by Gonzalo Ruiz de Villa.
Example: Try this demo to play with detached DOM trees.


 浙公网安备 33010602011771号