Matplotlib vs ggplot2
作者|Dario Radečić
编译|VK
来源|Towards Datas Science
2020年即将结束(终于),数据可视化再重要不过了。呈现一个看起来像5岁小孩的东西已经不再是一个选择,所以数据科学家需要一个有吸引力和简单易用的数据可视化库。
今天我们将比较其中的两个-Matplotlib和ggplot2。

为什么是这两个?Matplotlib是我学习的第一个可视化库。但最近我越来越喜欢R语言的ggplot2了,但是今天我们将在这两个库中重新创建五个相同的图,看看代码和美学方面的进展。
数据呢?我们将使用两个著名的数据集:mtcars和航空乘客。你可以通过导出CSV功能通过RStudio获得第一个,第二个在这里可用:https://raw.githubusercontent.com/jbrownlee/Datasets/master/airline-passengers.csv
以下是R和Python的库导入:
R:
library(ggplot2)

Python:
import pandas as pd
import matplotlib.pyplot as plt
import matplotlib.dates as mdates
mtcars = pd.read_csv('mtcars.csv')
直方图
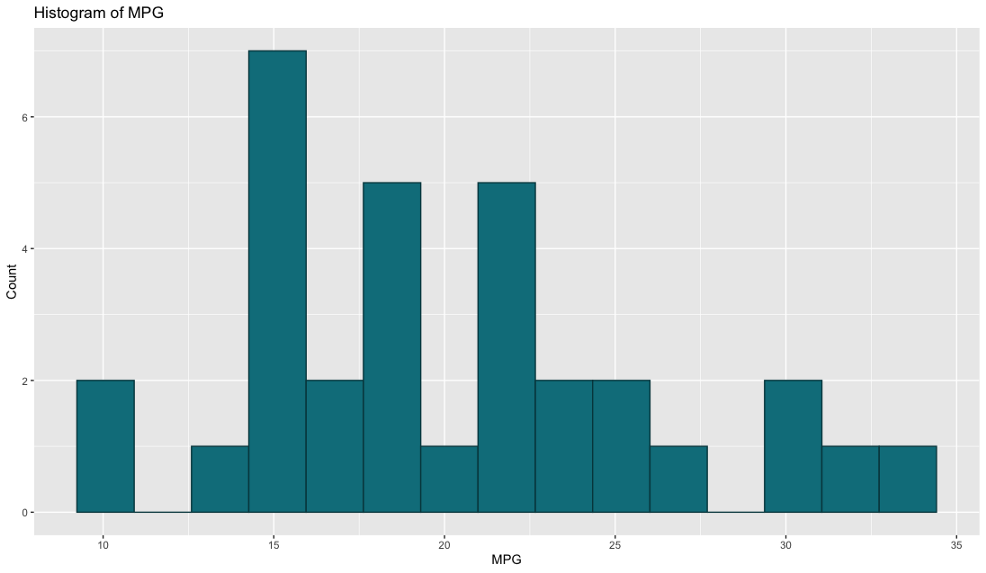
我们使用直方图来可视化给定变量的分布。这正是我们对mtcars数据集所做的——可视化MPG属性的分布。
以下是R的代码和结果:
ggplot(mtcars, aes(x=mpg)) +
  geom_histogram(bins=15, fill='#087E8B', color='#02454d') +
  ggtitle('Histogram of MPG') + xlab('MPG') + ylab('Count')
Python也是这样:
plt.figure(figsize=(12, 7))
plt.hist(mtcars['mpg'], bins=15, color='#087E8B', ec='#02454d')
plt.title('Histogram of MPG')
plt.xlabel('MPG')
plt.ylabel('Count');
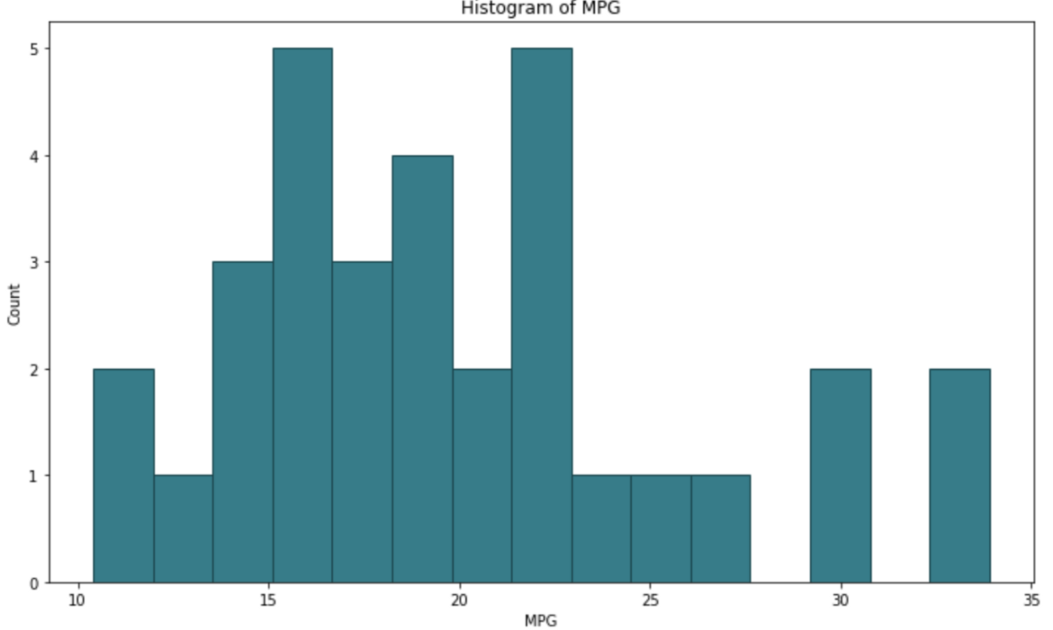
默认情况下两者非常相似。即使我们需要编写的代码量也大致相同,所以很难在这里选择最喜欢的代码。我喜欢Python的x轴是从0开始的,但在R中可以很容易地改变。另一方面,我喜欢R中没有边界,但这也是Python中易于实现的东西。
平局
条形图
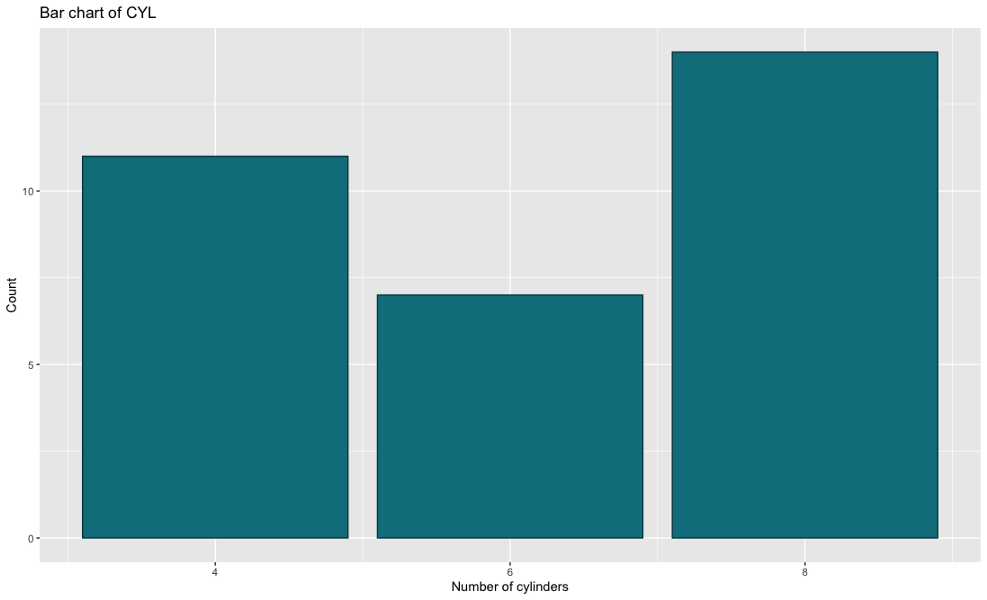
条形图由不同高度的矩形组成,其中高度表示给定属性段的值。我们将使用它们来比较不同数量的圆柱体(属性cyl)的计数。
以下是R的代码和结果:
ggplot(mtcars, aes(x=cyl)) +
  geom_bar(fill='#087E8B', color='#02454d') +
  scale_x_continuous(breaks=seq(min(mtcars$cyl), max(mtcars$cyl), by=2)) +
  ggtitle('Bar chart of CYL') +
  xlab('Number of cylinders') + ylab('Count')
Python也是一样:
bar_x = mtcars['cyl'].value_counts().index
bar_height = mtcars['cyl'].value_counts().values

plt.figure(figsize=(12, 7))
plt.bar(x=bar_x, height=bar_height, color='#087E8B', ec='#02454d')
plt.xticks([4, 6, 8])
plt.title('Bar chart of CYL')
plt.xlabel('Number of cylinders')
plt.ylabel('Count');
毫无疑问,R的代码更整洁、更简单,因为Python需要手动计算高度。从美学角度看,它们非常相似,但代码我更喜欢R版。
获胜者:ggplot2
散点图
散点图用于可视化两个变量之间的关系。这样做的目的是观察第二个变量随着第一个变量的变化(上升或下降)会发生什么。我们还可以通过对其他属性值的点着色来为二维图添加另一个“维度”。
我们将使用散点图来可视化HP和MPG属性之间的关系。
以下是R的代码和结果:
ggplot(mtcars, aes(x=hp, y=mpg)) +
  geom_point(aes(size=cyl, color=cyl)) +
  ggtitle('Scatter plot of HP vs MPG') +
  xlab('Horse power') + ylab('Miles per gallon')

Python也是一样:
colors = []
for val in mtcars['cyl']:
    if val == 4: colors.append('#17314c')
    elif val == 6: colors.append('#326b99')
    else: colors.append('#54aef3')
plt.figure(figsize=(12, 7))
plt.scatter(x=mtcars['hp'], y=mtcars['mpg'], s=mtcars['cyl'] * 20, c=colors)
plt.title('Scatter plot of HP vs MPG')
plt.xlabel('Horse power')
plt.ylabel('Miles per gallon');
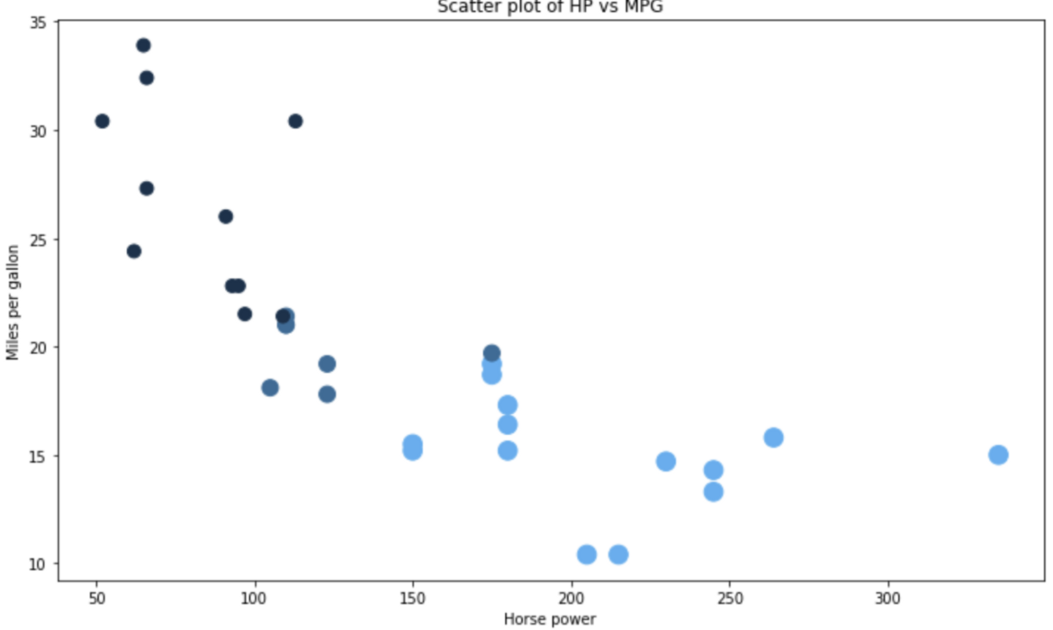
代码方面,这是R和ggplot2的明显胜利。Matplotlib不提供一种简单的方法,通过第三个属性给数据点上色,因此我们必须手动执行该步骤。尺寸也有点怪。
获胜者:ggplot2
箱线图
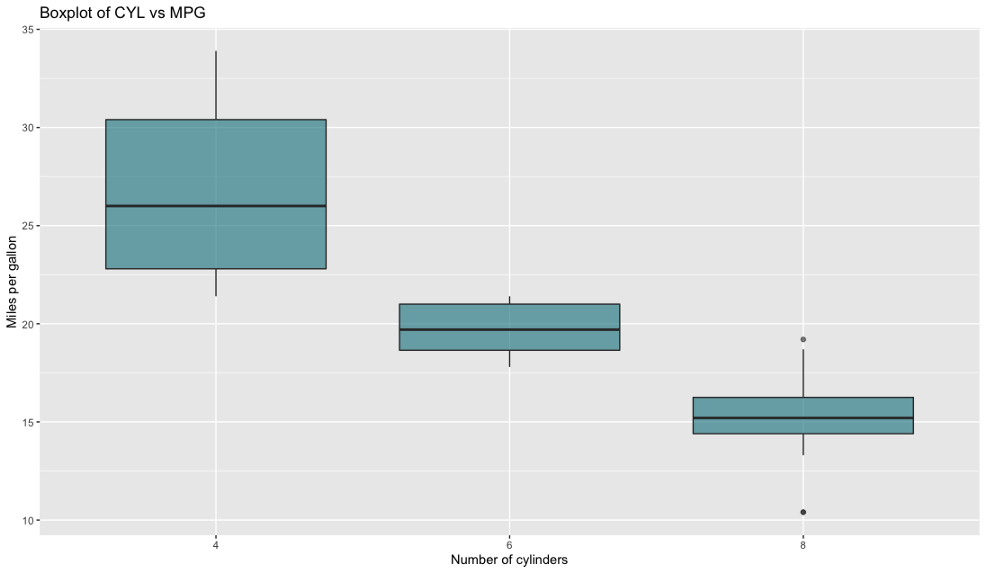
箱线图用于通过四分位数可视化数据。它们通常会有线(胡须)从盒子里伸出来,这些线在上下四分位数之外显示出变化。中间的线是中值。顶部或底部显示的点被视为异常值。
我们将使用箱线图,通过不同的CYL值来可视化MPG。
以下是R的代码和结果:
ggplot(mtcars, aes(x=as.factor(cyl), y=mpg)) +
  geom_boxplot(fill='#087E8B', alpha=0.6) +
  ggtitle('Boxplot of CYL vs MPG') +
  xlab('Number of cylinders') + ylab('Miles per gallon')
Python也是一样:
boxplot_data = [
    mtcars[mtcars['cyl'] == 4]['mpg'].tolist(),
    mtcars[mtcars['cyl'] == 6]['mpg'].tolist(),
    mtcars[mtcars['cyl'] == 8]['mpg'].tolist()
]

fig = plt.figure(1, figsize=(12, 7))
ax = fig.add_subplot(111)
bp = ax.boxplot(boxplot_data, patch_artist=True)

for box in bp['boxes']:
    box.set(facecolor='#087E8B', alpha=0.6, linewidth=2)

for whisker in bp['whiskers']:
    whisker.set(linewidth=2)

for median in bp['medians']:
    median.set(color='black', linewidth=3)

ax.set_title('Boxplot of CYL vs MPG')
ax.set_xlabel('Number of cylinders')
ax.set_ylabel('Miles per galon')
ax.set_xticklabels([4, 6, 8]);
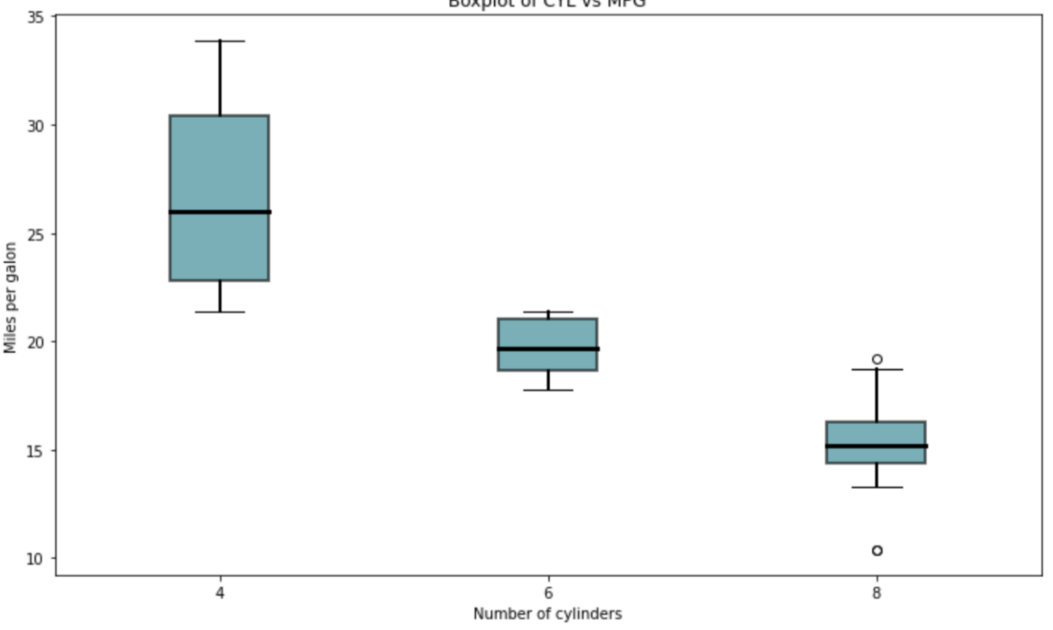
有一件事是立即可见的-Matplotlib需要大量的代码来生成一个外观不错的boxplot。ggplot2不是这样。到目前为止,R是这里明显的赢家。
获胜者:ggplot2
折线图
现在我们将从mtcars数据集转移到airline passengers数据集。我们将使用它创建一个带有日期格式的x轴的简单折线图。这并不像听起来那么容易。
以下是R的代码和结果:
ap <- read.csv('https://raw.githubusercontent.com/jbrownlee/Datasets/master/airline-passengers.csv')
ap$Month <- as.Date(paste(ap$Month, '-01', sep=''))

ggplot(ap, aes(x=Month, y=Passengers)) +
  geom_line(size=1.5, color='#087E8B') +
  scale_x_date(date_breaks='1 year', date_labels='%Y') +
  ggtitle('Line chart of Airline passengers') +
  xlab('Year') + ylab('Count')

Python也是一样:
ap = pd.read_csv('https://raw.githubusercontent.com/jbrownlee/Datasets/master/airline-passengers.csv')
ap['Month'] = ap['Month'].apply(lambda x: pd.to_datetime(f'{x}-01'))

fig = plt.figure(1, figsize=(12, 7))
ax = fig.add_subplot(111)
line = ax.plot(ap['Month'], ap['Passengers'], lw=2.5, color='#087E8B')

formatter = mdates.DateFormatter('%Y')
ax.xaxis.set_major_formatter(formatter)
locator = mdates.YearLocator()
ax.xaxis.set_major_locator(locator)
ax.set_title('Line chart of Airline passengers') ax.set_xlabel('Year') ax.set_ylabel('Count');

从美学角度来看,这些图表几乎完全相同,但在代码量方面,ggplot2再次击败Matplotlib。与Python相比,R在X轴显示日期要容易得多。
获胜者:ggplot2
结论
在我看来,ggplot2在简单性和数据可视化美观方面是一个明显的赢家。几乎总是可以归结为非常相似的3-5行代码,而Python则不是这样。
欢迎关注磐创AI博客站:
http://panchuang.net/
sklearn机器学习中文官方文档:
http://sklearn123.com/
欢迎关注磐创博客资源汇总站:
http://docs.panchuang.net/


