
linux下的C语言开发(gdb调试)
原文: http://blog.csdn.net/feixiaoxing/article/details/7199643
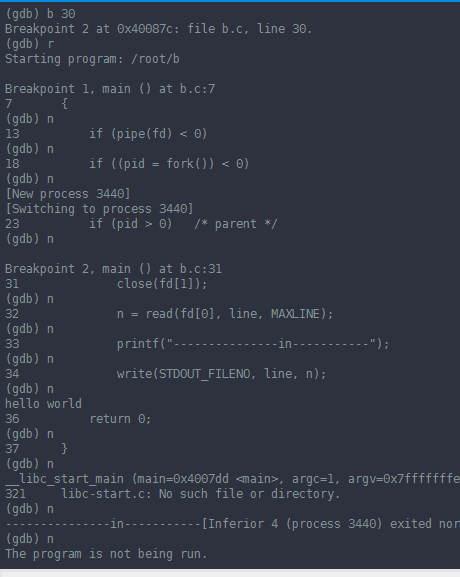
用gdb调试多进程的程序会遇到困难,gdb只能跟踪一个进程(默认是跟踪父进程),而不能同时跟踪多个进程,但可以设置gdb在fork之后跟踪父进程还是子进程。以上面的程序为
#include <stdlib.h>
#include <unistd.h>
#include <stdio.h>
#define MAXLINE 80

int main(void)
{
    int n;
    int fd[2];
    pid_t pid;
    char line[MAXLINE];

    if (pipe(fd) < 0)
    {
        perror("pipe");
        exit(1);
    }
    if ((pid = fork()) < 0)
    {
        perror("fork");
        exit(1);
    }
    if (pid > 0)   /* parent */
    {
        close(fd[0]);
        write(fd[1], "hello world\n", 12);
        wait(NULL);
    }
    else           /* child */
    {
        close(fd[1]);
        n = read(fd[0], line, MAXLINE);
        printf("---------------in-----------");
        write(STDOUT_FILENO, line, n);
    }
    return 0;
}
$ gcc main.c -g
$ gdb a.out
GNU gdb 6.8-debian
Copyright (C) 2008 Free Software Foundation, Inc.
License GPLv3+: GNU GPL version 3 or later <http://gnu.org/licenses/gpl.html>
This is free software: you are free to change and redistribute it.
There is NO WARRANTY, to the extent permitted by law.  Type "show copying"
and "show warranty" for details.
This GDB was configured as "i486-linux-gnu"...
(gdb) l
2	#include <unistd.h>
3	#include <stdio.h>
4	#include <stdlib.h>
5
6	int main(void)
7	{
8		pid_t pid;
9		char *message;
10		int n;
11		pid = fork();
(gdb)
12		if(pid<0) {
13			perror("fork failed");
14			exit(1);
15		}
16		if(pid==0) {
17			message = "This is the child\n";
18			n = 6;
19		} else {
20			message = "This is the parent\n";
21			n = 3;
(gdb) b 17
Breakpoint 1 at 0x8048481: file main.c, line 17.
(gdb) set follow-fork-mode child
(gdb) r
Starting program: /home/akaedu/a.out
This is the parent
[Switching to process 30725]

Breakpoint 1, main () at main.c:17
17			message = "This is the child\n";
(gdb) This is the parent
This is the parent
---------------------------------------------------------------------
编写代码过程中少不了调试。在windows下面,我们有visual studio工具。在Linux下面呢,实际上除了gdb工具之外,你没有别的选择。那么,怎么用gdb进行调试呢?我们可以一步一步来试试看。
- #include <stdio.h>
- int iterate(int value)
- {
- if(1 == value)
- return 1;
- return iterate(value - 1) + value;
- }
- int main()
- {
- printf("%d\n", iterate(10));
- return 1;
- }
既然需要调试,那么生成的可执行文件就需要包含调试的信息,这里应该怎么做呢?很简单,输入 gcc test.c -g -o test。输入命令之后,如果没有编译和链接方面的错误,你就可以看到 可执行文件test了。
调试的步骤基本如下所示,
(01) 首先,输入gdb test
(02) 进入到gdb的调试界面之后,输入list,即可看到test.c源文件
(03) 设置断点,输入 b main
(04) 启动test程序,输入run
(05) 程序在main开始的地方设置了断点,所以程序在printf处断住
(06) 这时候,可以单步跟踪。s单步可以进入到函数,而n单步则越过函数
(07) 如果希望从断点处继续运行程序,输入c
(08) 希望程序运行到函数结束,输入finish
(09) 查看断点信息,输入 info break
(10) 如果希望查看堆栈信息,输入bt
(11) 希望查看内存,输入 x/64xh + 内存地址
(12) 删除断点,则输入delete break + 断点序号
(13) 希望查看函数局部变量的数值,可以输入print + 变量名
(14)希望修改内存值,直接输入 print + *地址 = 数值
(15) 希望实时打印变量的数值,可以输入display + 变量名
(16) 查看函数的汇编代码,输入 disassemble + 函数名
(17) 退出调试输入quit即可

 浙公网安备 33010602011771号