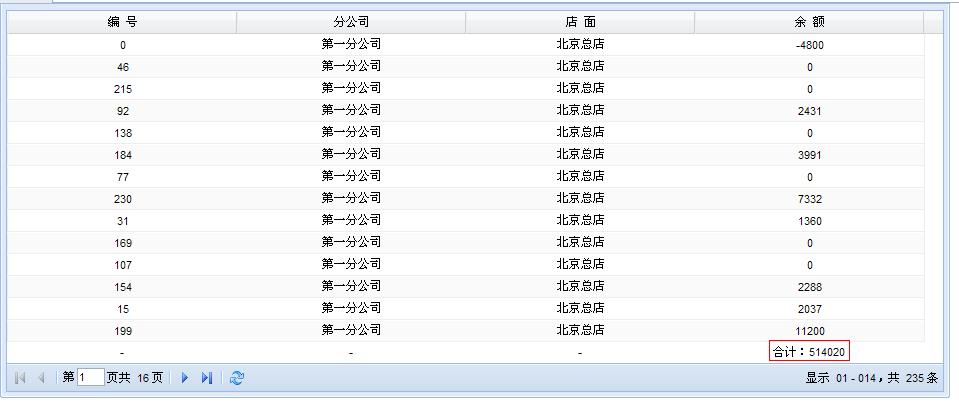
ExtJs Grid 合计 [Ext | GridPanel | GridSummary]
前言
五一期间学习Ext很痛苦也很快乐,到现在也算是小有所成,陆陆续续的开始在项目中使用,Ext的表格据统计是使用率最高的一个组件,实在是很强大,但我以为关键是很漂亮,而他本身并不支持数据的统计功能,但是我们可以在他的sample里面找到一个Live Group Summary的例子,但是这个例子仅能够统计一页是数据,实际使用中是不现实的,鼓捣2天后有了这个偏方 : ) 下面和大家一起分享。
版本
ext-3.0-rc1
正文
1. 截图效果
2. 修改源代码 ext-3.0-rc1\source\data\JsonReader.js,添加汇总接受数据的属性,注意代码红色部分。
2.1 添加属性,this.dataSum = 0,源码97行后:
meta = meta || {};
this.dataSum = 0;//add
Ext.data.JsonReader.superclass.constructor.call(this, meta, recordType || meta.fields);
};
2.1 为属性赋值,源码180 行左右,红色部分。
// over 2009-5-3
if(s.dataSum){
this.dataSum = o.dataSum;
}
if(s.totalProperty) {
this.getTotal = this.getJsonAccessor(s.totalProperty);
}
2. 实现统计功能的 GroupSummary.js,本代码来源于 http://extjs.com/forum/showthread.php?t=21331。这里没有用自带例子里面的GroupSummary.js,因为在我这边报错。
Ext.ux.grid.GridSummary = function(config) {
Ext.apply(this, config);
};
Ext.extend(Ext.ux.grid.GridSummary, Ext.util.Observable, {
init : function(grid) {
this.grid = grid;
this.cm = grid.getColumnModel();
this.view = grid.getView();
var v = this.view;
// override GridView's onLayout() method
v.onLayout = this.onLayout;
v.afterMethod('render', this.refreshSummary, this);
v.afterMethod('refresh', this.refreshSummary, this);
v.afterMethod('syncScroll', this.syncSummaryScroll, this);
v.afterMethod('onColumnWidthUpdated', this.doWidth, this);
v.afterMethod('onAllColumnWidthsUpdated', this.doAllWidths, this);
v.afterMethod('onColumnHiddenUpdated', this.doHidden, this);
// update summary row on store's add/remove/clear/update events
grid.store.on({
add: this.refreshSummary,
remove: this.refreshSummary,
clear: this.refreshSummary,
update: this.refreshSummary,
scope: this
});
if (!this.rowTpl) {
this.rowTpl = new Ext.Template(
'<div class="x-grid3-summary-row x-grid3-gridsummary-row-offset">',
'<table class="x-grid3-summary-table" border="0" cellspacing="0" cellpadding="0" style="{tstyle}">',
'<tbody><tr>{cells}</tr></tbody>',
'</table>',
'</div>'
);
this.rowTpl.disableFormats = true;
}
this.rowTpl.compile();
if (!this.cellTpl) {
this.cellTpl = new Ext.Template(
'<td class="x-grid3-col x-grid3-cell x-grid3-td-{id} {css}" style="{style}">',
'<div class="x-grid3-cell-inner x-grid3-col-{id}" unselectable="on" {attr}>{value}</div>',
"</td>"
);
this.cellTpl.disableFormats = true;
}
this.cellTpl.compile();
},
calculate : function(rs, cm) {
var data = {}, cfg = cm.config;
for (var i = 0, len = cfg.length; i < len; i++) { // loop through all columns in ColumnModel
var cf = cfg[i], // get column's configuration
cname = cf.dataIndex; // get column dataIndex
// initialise grid summary row data for
// the current column being worked on
data[cname] = 0;
if (cf.summaryType) {
for (var j = 0, jlen = rs.length; j < jlen; j++) {
var r = rs[j]; // get a single Record
data[cname] = Ext.ux.grid.GridSummary.Calculations[cf.summaryType](r.get(cname), r, cname, data, j);
}
}
}
return data;
},
onLayout : function(vw, vh) {
if (Ext.type(vh) != 'number') { // handles grid's height:'auto' config
return;
}
// note: this method is scoped to the GridView
if (!this.grid.getGridEl().hasClass('x-grid-hide-gridsummary')) {
// readjust gridview's height only if grid summary row is visible
this.scroller.setHeight(vh - this.summary.getHeight());
}
},
syncSummaryScroll : function() {
var mb = this.view.scroller.dom;
this.view.summaryWrap.dom.scrollLeft = mb.scrollLeft;
this.view.summaryWrap.dom.scrollLeft = mb.scrollLeft; // second time for IE (1/2 time first fails, other browsers ignore)
},
doWidth : function(col, w, tw) {
var s = this.view.summary.dom;
s.firstChild.style.width = tw;
s.firstChild.rows[0].childNodes[col].style.width = w;
},
doAllWidths : function(ws, tw) {
var s = this.view.summary.dom, wlen = ws.length;
s.firstChild.style.width = tw;
var cells = s.firstChild.rows[0].childNodes;
for (var j = 0; j < wlen; j++) {
cells[j].style.width = ws[j];
}
},
doHidden : function(col, hidden, tw) {
var s = this.view.summary.dom,
display = hidden ? 'none' : '';
s.firstChild.style.width = tw;
s.firstChild.rows[0].childNodes[col].style.display = display;
},
renderSummary : function(o, cs, cm) {
cs = cs || this.view.getColumnData();
var cfg = cm.config,
buf = [],
last = cs.length - 1;
for (var i = 0, len = cs.length; i < len; i++) {
var c = cs[i], cf = cfg[i], p = {};
p.id = c.id;
p.style = c.style;
p.css = i == 0 ? 'x-grid3-cell-first ' : (i == last ? 'x-grid3-cell-last ' : '');
if (cf.summaryType || cf.summaryRenderer) {
p.value = (cf.summaryRenderer || c.renderer)(o.data[c.name], p, o);
} else {
p.value = '';
}
//此处设置默认不显示时用什么符号标记
if (p.value == undefined || p.value === "") p.value = "-";
buf[buf.length] = this.cellTpl.apply(p);
}
return this.rowTpl.apply({
tstyle: 'width:' + this.view.getTotalWidth() + ';',
cells: buf.join('')
});
},
refreshSummary : function() {
var g = this.grid, ds = g.store,
cs = this.view.getColumnData(),
cm = this.cm,
rs = ds.getRange(),
data = this.calculate(rs, cm),
buf = this.renderSummary({data: data}, cs, cm);
if (!this.view.summaryWrap) {
this.view.summaryWrap = Ext.DomHelper.insertAfter(this.view.scroller, {
tag: 'div',
cls: 'x-grid3-gridsummary-row-inner'
}, true);
}
this.view.summary = this.view.summaryWrap.update(buf).first();
},
toggleSummary : function(visible) { // true to display summary row
var el = this.grid.getGridEl();
if (el) {
if (visible === undefined) {
visible = el.hasClass('x-grid-hide-gridsummary');
}
el[visible ? 'removeClass' : 'addClass']('x-grid-hide-gridsummary');
this.view.layout(); // readjust gridview height
}
},
getSummaryNode : function() {
return this.view.summary
}
});
Ext.reg('gridsummary', Ext.ux.grid.GridSummary);
/*
* all Calculation methods are called on each Record in the Store
* with the following 5 parameters:
*
* v - cell value
* record - reference to the current Record
* colName - column name (i.e. the ColumnModel's dataIndex)
* data - the cumulative data for the current column + summaryType up to the current Record
* rowIdx - current row index
*/
Ext.ux.grid.GridSummary.Calculations = {
sum : function(v, record, colName, data, rowIdx) {
return data[colName] + Ext.num(v, 0);
},
count : function(v, record, colName, data, rowIdx) {
return rowIdx + 1;
},
max : function(v, record, colName, data, rowIdx) {
return Math.max(Ext.num(v, 0), data[colName]);
},
min : function(v, record, colName, data, rowIdx) {
return Math.min(Ext.num(v, 0), data[colName]);
},
average : function(v, record, colName, data, rowIdx) {
var t = data[colName] + Ext.num(v, 0), count = record.store.getCount();
return rowIdx == count - 1 ? (t / count) : t;
}
}
3. 调用代码
3.1 改后的JsonReader调用方法:
totalProperty: 'count',
root: 'result',
dataSum: 'dataSum' //注意了,这个是我自定义的属性(成员变量)
},[
{ name: 'fgsname' },
{ name: 'dianname'},
{ name: 'asd' },
{ name: 'Money',type: 'float'}
]);
3.2 为GridPanel添加插件
var grid = new Ext.grid.GridPanel({
plugins: summary,
//


3.3 修改ColumnModel
return '合计:'+jr.dataSum;
}
var dataColumns = new Ext.grid.ColumnModel([
{header: "编 号", align:'center', dataIndex: 'asd'},
{header: "分公司", align:'center', dataIndex: 'fgsname',locked: true},
{header: "店 面", align:'center', dataIndex: 'dianname'},
{header: "余 额", align:'center', dataIndex: 'Money',summaryRenderer:renderSummary}
]);
4. 代码下载:
更新:
1. 2009-5-6 请在我修改后的JsonReader.js大概210行左右加上如下标红代码:
//add
if(s.dataSum){
this.dataSum = o.dataSum;
}
if(s.totalProperty){
var v = parseInt(this.getTotal(o), 10);
if(!isNaN(v)){
totalRecords = v;
}
}
2. 2009-5-13 如果在同一页面不是通过刷新来搜索的,可能会出现没有搜索结果而表格的数据确没有清掉统计也是上次搜索的结果,需要在搜索前加上如下三行代码就可以了:
jr.dataSum = 0;
summary.refreshSummary();
结束
开源项目这点还是非常好的,就是你看不顺眼或者根据自己的需求可以任意的修改代码,但是修改的时候请小心一点,需要大致明白里面的工作机制。


 浙公网安备 33010602011771号