Visual Studio 2017调试时内存数据可视化插件
Visual Studio 2017调试时内存数据可视化插件
软件调试时经常需要查看内存中数组的值,特别是用图形的方式展示数组的内容,非常有利于软件的调试。
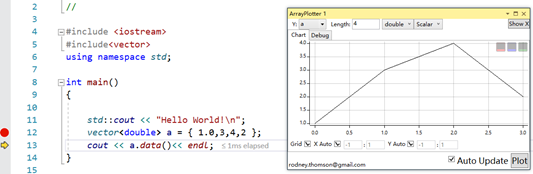
(1)ArrayPlotter 折线方式显示序列数据
https://marketplace.visualstudio.com/items?itemName=RodneyThomson.ArrayPlotter
ArrayPlotter is a debugger visualisation tool that allows you to dynamically plot the contents of your C++/C# arrays and IEnumerables within the Visual Studio debugger.
Features
Plot C++ or C# array or IEnumerable contents into a zoomable/pannable chart. Supported datatypes:
float
double
unsigned/signed 8/16/32/64 bit integers
Handles complex number of above datatypes (can plot real / imaginary / magnitude / phase)
Handle interleaved datatypes via stride / offset
Plot independent X/Y data values for non-linear X
Auto Update feature will automatically plot array upon entering break mode
A history of array pointer expressions will be kept between invocations
The current plot can be held for comparison. Up to 3 plots can be held at once
ArrayPlotter windows are standard dockable/moveable Visual Studio window
Multiple ArrayPlotter windows can be opened at once
Chart colours (Axis / Series / Background) are customisable and will persist
Chart supports auto or manual x and y-scaling
Both array pointer and length expressions are supported, ie length can be a fixed integer or a variable with a constantly changing value. Pointer and numerical arithmetic can also be applied
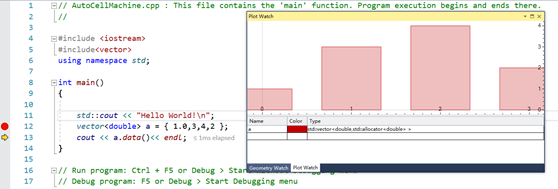
(2)Graphical Debugging 几何图形、序列数据的显示
https://marketplace.visualstudio.com/items?itemName=AdamWulkiewicz.GraphicalDebugging
This extension allows to display graphical representation of C++ and C# variables during debugging.
It supports Boost.Geometry and Boost.Polygon models, Boost.Variant, STL/Boost containers of values and points, C-style arrays, C# arrays, List and LinkedList as well as user-defined geometry types. The extension has the following components:
Debugger visualizers for Boost.Array, Boost.CircularBuffer, Boost.Container, Boost.Geometry, Boost.MPL, Boost.Polygon, Boost.Tuple and Boost.Variant
Geometry Watch tool window displaying geometries in a common coordinate system, e.g. Boost.Geometry, Boost.Polygon polygons, etc.
Graphical Watch tool window displaying graphical representation of variables, e.g. Boost.Geometry models, vectors of values, Boost.Gil images, etc.
Plot Watch tool window displaying plot representation of variables, e.g. vector of doubles, array of pairs, etc.
(3)Image Watch 2017
https://marketplace.visualstudio.com/items?itemName=VisualCPPTeam.ImageWatch2017
Provides a watch window for visualizing in-memory images (bitmaps) when debugging native C++ code for Visual Studio 2017.
Image Watch is a watch window for viewing in-memory bitmaps when debugging native C++ code.
The current version has built-in support for OpenCV image types (cv::Mat, cv::Mat_<>, CvMat, _IplImage). To enable user-defined image types please refer to the Image Watch documentation.
This version works with Visual Studio 2017.
Quick Start: Simply break in the debugger and select View > Other Windows > Image Watch. Alternatively, click on the magnifying glass icon next to an image variable in your Locals window or on the debugger Data Tip.

(5)ILNumerics Array Visualizer(收费)
https://marketplace.visualstudio.com/items?itemName=ILNumericsGmbH.ILNumericsArrayVisualizer
ILNumerics Array Visualizer is a graphical watch window for Visual Studio. This is the only tool which combines fast data visualization with professional 2D/3D plotting and export capabilities for any .NET and C/C++ array. The Array Visualizer works for 32 and 64 bit targets.
(6)Free Real-Time Charts with Tooltips and Cursor Feedback (收费)
https://marketplace.visualstudio.com/items?itemName=genlogic.FreeReal-TimeChartswithTooltipsandCursorFeedbackCo
(7)LightningChart® .NET(收费)
https://marketplace.visualstudio.com/items?itemName=Arctionsoftwarecomponents.LightningChartUltimateSDK
LightningChart is a Visual Studio add-on, and the fastest 2D & 3D data visualization SDK for Windows Forms and WPF. The charting library is used in applications for the most demanding industries: science and research, engineering, economics and finance, trading, medicine, energy, space and defence. LightningChart is entirely GPU accelerated and performance optimized for presenting the massive amount of data (more than 1 Billion data points real-time).
Utilizing CPU and memory resources efficiently, LightningChart is developed and optimized for the professional high-speed software dealing with the real-time data acquisition and representation. This provides an unmatched performance to final applications.
LightningChart provides the following Features: XY charts, 3D charts, Polar view, Smith view, Maps, Signal Tools and Volume Rendering.

 浙公网安备 33010602011771号