XTGeo油藏数值模拟Eclipse模型处理python库
(1)面数据Surface: RegularSurface 2
XTGeo地层用c语言写,python包使用了大量的numpy和pandas以保证数据处理的性能。
XTGeo is Python library to work with surfaces, grids, cubes, wells, etc, possibly in combinations.
XTGeo包含的数据模型有规则面数据,网格数据,地震立方体数据,井数据,点数据和多边形数据,特别适用于不同类型数据的交互操作,比如从模型中提取面,。
· Regular surfaces, i.e. 2D maps with regular sampling and rotation
· 3D grids (corner-point), supporting several formats such as RMS and Eclipse
· Support of seismic cubes, using segyio as backend for SEGY format
· Support of well data, line and polygons (still somewhat immature)
· Operations between the data types listed above; e.g. slice a surface with a seismic cube
官方给出的教程如下,主要是安装方法、数据模型和输入输出格式,使用方法等,其中的使用方法给的例子很少,体现的接口也很少。

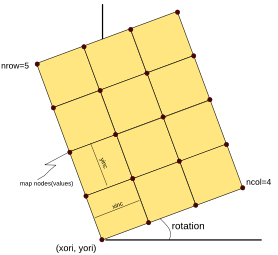
面数据是结构化二维网格数据,在python中的是numpy对象。
A surface can in principle be represented in various ways. Currently, XTGeo supports a RegularSurface which is commonly used in the oil industry. Due to the regular layout, such surfaces are quite fast to work with and requires small storage (only the Z values array is stored).
RegularSurface is described by:
- An origin in UTM coordinates, defined as xori and yori
- An increment in each direction, defined as xinc and yinc
- A number of columns and rows, where columns follow X and rows follow Y, if a rotation is zero, as ncol and nrow.
- A rotation of the X axis; in XTGeo the rotation is counter-clockwise from the X (East) axis, in degrees.
- An yflip indicator. Normally the system is left-handed (with Z axis positive down). If yflip is -1, then the map is right-handed.
- A 2D array (masked numpy) of values, for a total of ncol * nrow entries. Undefined map nodes are masked. The 2D numpy array is stored in C-order (row-major). Default is 64 bit Float.
支持的数据导入导出格式是:

立方体数据可以是地震数据和正交网格的模型数据。Python中的是numpy对象
A Cube is described by:
- An origin in UTM coordinates, defined as xori, yori and zori
- An increment in each direction, defined as xinc, yinc and zinc
- A number of columns, rows and layers, where columns follow X and rows follow Y, if a rotation is zero, as ncol and nrow. Vertically nlay
- A rotation of the X axis; in XTGeo the rotation is counter-clockwise from the X (East) axis, in degrees.
- An yflip indicator. Normally the system is left-handed (with Z axis positive down). If yflip is -1, then the cube is right-handed.
- A 3D array (numpy) of values, for a total of ncol * nrow * nlay entries. All nodes are defined. The 3D numpy array is stored in C-order (row-major). Default is 32 bit Float.
支持的导入导出数据格式有:

三维网格包括两部分,几何网格部分是简化版本的角点网格(Grid class),属性部分是是网格模型上的属性场(GridProperty class)。
A 3D grid consists of two parts, a geometry which follows a simplified version of a corner-point grid (Grid class), and a number of assosiated properties (GridProperty class):
- The geometry is stored as pointers to C arrays; hence the geometry itself is not directly accessible in Python. The C arrays are usually named p_coord_v, p_zcorn_v, and p_actnum_v. They are one dimensionial arrays.
- The grid dimensions are given by ncol * nrow * nlay
- The properties are stored as 3D masked numpy arrays in python. Undefined cells are masked. The machine order in python is C-order. For historical reasons, the order of the property arrays in C code (when applied) is F-order.
从上述介绍可以看出,网格部分的存储是C矩阵,因此几何属性无法直接在python中获取,C矩阵的名字分别是p_coord_v, p_zcorn_v和p_actnum_v,它们是一维矩阵。不过新版本好像提供了获取网格信息的python接口,也是pandas对象。
dataframe=grd.dataframe(), #grid=xtgeo.grid3d.Grid()
网格的维数是· ncol * nrow * nlay
网格属性场存储方式是numpy对象,但后面的例子中看起来是pandas对象。
三维模型几何网格部分支持的导入导出格式是:

三维模型属性场支持的导入导出格式有:

井数据在python中是pandas dataframe的格式,没有给据悉的细节。
Well data is stored in python as Pandas dataframe plus some additional metadata.
A special subclass is Blocked Well data.
In general, Points and Polygons are XYZ data with possible atttributes.
Points and Polygons data is stored in python as Pandas dataframe plus some additional metadata.
The term “Polygons” here is not precise perhaps, at it refers to connected lines which can either form an open polyline or are closed polygon. A Polygons() instance may have a number of individual polygon “pieces”, which are defined by a POLY_ID (default name) column. This design is borrowed from RMS.
可以从文件读取面数据,也可以从三维网格场提取面数据,也可以对面数据进行各种计算。Nupy支持的计算应该都可以执行。
from xtgeo.surface import RegularSurface
# create an instance of a surface, read from file
mysurf = RegularSurface('myfile.gri') # Irap binary as default
print('Mean is {}'.format(mysurf.values.mean()))
# change date so all values less than 2000 becomes 2000# The values attribute gives the Numpy array
mysurface.values[mysurface.values < 2000] = 2000
# export the modified surface:
mysurface.to_file('newfile.gri')
也可以从三维场中提取面
def slice_a_cube_with_surface():
"""Slice a seismic cube with a surface on OW dat/map format"""
cubefile = join(EXPATH1, "ib_test_cube2.segy")
surfacefile = join(EXPATH2, "h1.dat")
mycube = xtgeo.cube_from_file(cubefile)
# import map/dat surface using cube as template (inline/xline
# must match)
mysurf = xtgeo.surface_from_file(surfacefile, fformat="ijxyz", template=mycube)
# sample cube values to mysurf (replacing current depth values)
mysurf.slice_cube(mycube, sampling="trilinear")
# export result
mysurf.to_file("slice.dat", fformat="ijxyz")
Cube data主要是正交网格的模型和三维地震数据。Python中是个numpy的三维数组,支持两个对量之间的数学运算和重采样等。
import xtgeo
# make two cube objects from file import:cube1 = xtgeo.cube_from_file('cube1.segy')cube2 = xtgeo.cube_from_file('cube2.segy')
# subtract the two numpy arrayscube1.values = cube1.values - cube2.values
# export the updated cube1 to SEGYcube1.to_file('diff.segy')
面数据和立体方数据的相互操作,可以很方便地提取层面地震属性和层间地震属性。
To sample cube values into a surface can be quite useful. Both direct sampling, and interval sampling (over a window, or between two surfaces) is supported. For the interval sampling, various attributes can be extracted.
Sampling a surface from a cube
Here is sampling a regular surface from a cube. The two objects can have different rotation. See xtgeo.surface.RegularSurface.slice_cube() method
import xtgeo
# make two cube objects from file import:surf = xtgeo.surface_from_file('top.gri')cube = xtgeo.cube_from_file('cube2.segy')
surf.slice_cube(cube)
# export the updated to RMS binary map formatsurf.to_file('myslice.gri')
Sampling the root-mean-square surface over a window from a cube
The root mean scquare (rms) value over a surface, +- 10 units (e.g. metres if depth), see slice_cube_window method.
import xtgeo
# slice within a window (vertically) around surface:surf = xtgeo.surface_from_file('top.gri')cube = xtgeo.cube_from_file('cube.segy')
surf.slice_cube_window(cube, zrange=10, attribute='rms')
# export the updated to Irap (RMS) ascii map formatsurf.to_file('rmsaverage.fgr', fformat='irap_ascii')
可以从大模型中提取小模型,也可以把模型网格几何数据和属性场提取出来,作为pandas frame数据。
def extractdf():
"""Extract dataframe from Eclipse case"""
# gete dataframe from the grid only
grd = xtgeo.grid3d.Grid(GRIDFILEROOT + '.EGRID')
dataframe = grd.dataframe() # will not have any grid props
print(dataframe)
# load as Eclipse run; this will automatically look for EGRID, INIT, UNRST
grd = xtgeo.grid3d.Grid()
grd.from_file(GRIDFILEROOT, fformat='eclipserun', initprops=INITS,
restartprops=RESTARTS, restartdates=MYDATES)
# dataframe from a GridProperties instance, in this case grd.gridprops
dataframe = grd.gridprops.dataframe() # properties for all cells
print(dataframe)
# Get a dataframe for all cells, with ijk and xyz. In this case
# a grid key input is required:
dataframe = grd.dataframe()
print(dataframe) # default is for all cells
# For active cells only:
dataframe = grd.dataframe(activeonly=True)
print(dataframe)
dataframe.to_csv('reek_sim.csv')
也可以计算某种沉积相其他属性场的统计特征。
Compute a grid property average and stdev
In this example, how to extract Mean ans Stddev from some geo properties, filtered on facies. An RMS inside version is also shown.
也可以计算多个实现的统计特征。
Compute a grid property average across realisations
In this example, a technique that keeps memory usage under control when computing averages is also presented.
也可以从模型的初始化数据INIT文件中提取数据转化为CSV文件格式。
Make a CSV file from Eclipse INIT data (aka ERT ECL)
Example on how to create a CSV file from all INIT properties. Example is for Eclipse format, but shall work also with ROFF input
def all_init_as_csv():
"""Get dataframes, print as CSV."""
print('Loading Eclipse data {}'.format(GRIDFILEROOT))
grd = xtgeo.grid3d.Grid()
grd.from_file(GRIDFILEROOT, fformat='eclipserun', initprops=INITPROPS)
print('Get dataframes...')
dfr = grd.dataframe(activeonly=True)
print(dfr.head())
print('Filter out columns with constant values...')
dfr = dfr.iloc[:, ~np.isclose(0, dfr.var())]
print(dfr.head())
print('Write to file...')
dfr.to_csv('mycsvdump.csv', index=False)
给的例子中做了每个层过井属性数据的统计。
官方没有给出例子。
因为例子不多,接口描述就非常关键。另外,也是因为python是动态解释语言,不做函数接口的数据类型检查,让代码看起来很费劲。XTGeo的模块结构如下,这里不详细介绍,具体看链接。
https://pypi.org/project/xtgeo/
https://github.com/equinor/xtgeo
https://xtgeo.readthedocs.io/en/latest/apiref/modules.html

 浙公网安备 33010602011771号