Winform 后台生成饼状图并保存为图片
.cs代码如下
string ldt_picPath = System.Windows.Forms.Application.StartupPath + @"Pic\" + ItemName + @"\" + KeMuName + @"\" + ExamCode + @"\";

            Chart Chart3 = new Chart();
            ChartArea chartArea1 = new ChartArea();
            Chart3.Width = 900;
            Chart3.BackColor = Color.Moccasin;
            Chart3.BackGradientStyle = GradientStyle.DiagonalRight;
            Chart3.BorderlineDashStyle = ChartDashStyle.Solid;
            Chart3.BorderlineColor = Color.Gray;
            Chart3.BorderSkin.SkinStyle = BorderSkinStyle.Emboss;

            // forma the chart area
            Chart3.ChartAreas.Add(chartArea1);
            Chart3.ChartAreas[0].BackColor = Color.Wheat;
            // add and format the title
            Chart3.Titles.Add("标题");
            Chart3.Titles[0].Font = new Font("Utopia", 14, FontStyle.Bold);

            Chart3.Series.Add(new Series("Pie")
            {
                ChartType = SeriesChartType.Pie,
                ShadowOffset = 2
            });
            Chart3.Series[0].Label = "#VALX \n\n #PERCENT{P}";//显示百分比和说明
            Chart3.Series[0].LegendText = "#VALX";
            double[] yValues = null;//数值
            string[] xValues = null;//标签

            DataTable bz = Data.SQL_zl.getBzjg();
            if (bz.Rows.Count > 0)
            {
                yValues = new double[bz.Rows.Count];
                xValues = new string[bz.Rows.Count];
                for (int i = 0; i < bz.Rows.Count; i++)
                {
                    string dj = bz.Rows[i]["dj"].ToString();
                    xValues[i] = dj;
                    DataTable dt = Data.SQL_zl.Get_GRZhiLiang(KeMuName, dj);
                    if (dt.Rows.Count > 0)
                    {
                        yValues[i] = Convert.ToDouble(dt.Rows[0]["jgC"].ToString());
                    }
                }
            }
            //饼状图的标签方位
            Chart3.Series[0]["PieLabelStyle"] = "Outside";
            Chart3.Series[0]["PieLineColor"] = "Black";
            Chart3.Series[0].Points.DataBindXY(xValues, yValues);
            //图例说明
            Legend leg = new Legend();
            Chart3.Legends.Add(leg);

            //每个部分开花
            foreach (DataPoint point in Chart3.Series[0].Points)
            {
                point["Exploded"] = "true";
            }
            Chart3.SaveImage(ldt_picPath + "4.jpg", ChartImageFormat.Jpeg);
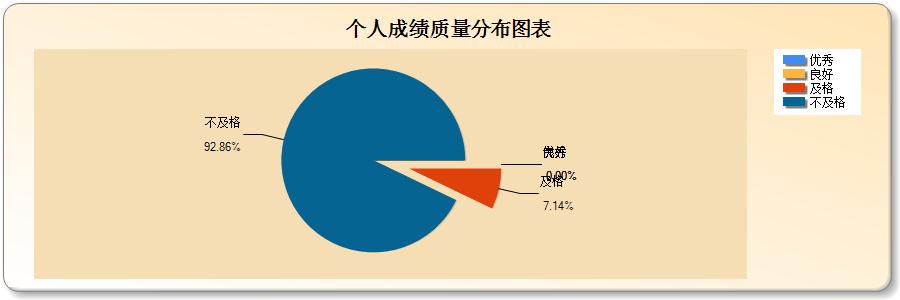
生成图片的效果