
matplotlib技巧---9.共享坐标轴、创建多个subplot、调整横坐标、放置文本框、latext文字、平移坐标轴、清除绘图、清除坐标轴、设置中文
1. 共享坐标轴
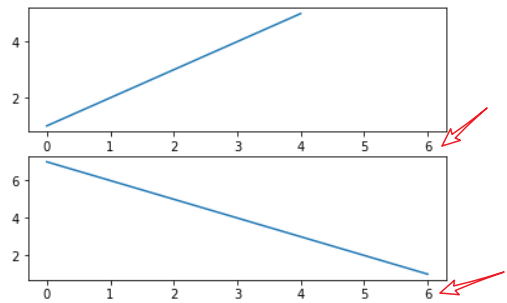
当你通过pyplot.subplot()、pyplot.axes()函数或者Figure.add_subplot()、Figure.add_axes()方法创建一个Axes时,你可以通过sharex关键字参数传入另一个Axes表示共享X轴;或者通过sharey关键字参数传入另一个Axes表示共享Y轴。共享轴线时,当你缩放某个Axes时,另一个Axes也跟着缩放。
举例:
1 2 3 4 5 6 7 8 | import matplotlibimport matplotlib.pyplot as pltfig = plt.figure()ax1 = fig.add_subplot(211)ax1.plot([1,2,3,4,5])ax2 = fig.add_subplot(212,sharex=ax1)ax2.plot([7,6,5,4,3,2,1])fig.show() |
2. 创建多个 subplot
如果你想创建网格中的许多subplot,旧式风格的代码非常繁琐:
1 2 3 4 5 6 | # 旧式风格fig=plt.figure()ax1=fig.add_subplot(221)ax2=fig.add_subplot(222,sharex=ax1,sharey=ax1)ax3=fig.add_subplot(223,sharex=ax1,sharey=ax1)ax4=fig.add_subplot(224,sharex=ax1,sharey=ax1) |
新式风格的代码直接利用pyplot.subplots()函数一次性创建:
1 2 3 4 5 | # 新式风格的代码fig,((ax1,ax2),(ax3,ax4))=plt.subplots(2,2,sharex=True,sharey=True)ax1.plot(...)ax2.plot(...) ... |
它创建了Figure和对应所有网格SubPlot。你也可以不去解包而直接:
1 2 3 4 5 6 7 | # 新式风格的代码fig,axs=plt.subplots(2,2,sharex=True,sharey=True)ax1=axs[0,0]ax2=axs[0,1]ax3=axs[1,0]ax4=axs[1,1]... |
返回的axs是一个nrows*ncols的array,支持numpy的索引。
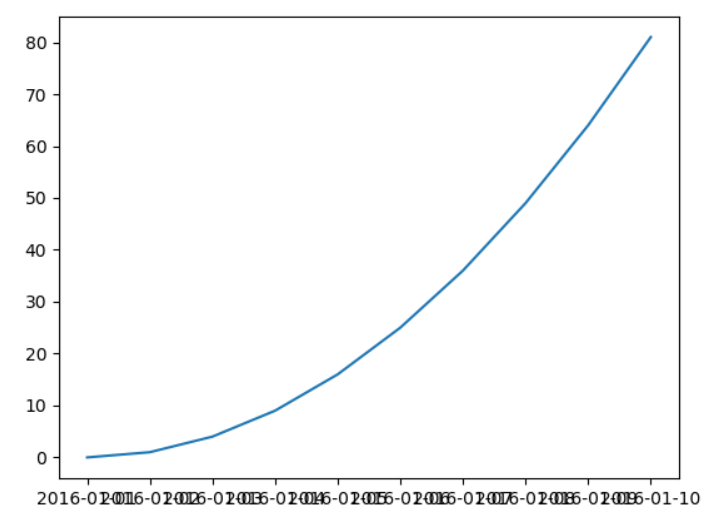
3. 调整横坐标不重叠
未调整前:
1 2 3 4 5 6 7 8 9 | import datetimeimport matplotlib.pyplot as pltimport matplotlib.dates as mdatesd0 = datetime.date(2016,1,1)ndates = [d0+datetime.timedelta(i) for i in range(10)]n_ys = [i*i for i in range(10)]fig,ax = plt.subplots(1)ax.plot(ndates,n_ys) |
(1)matplotlib.dates.DateFormatter
当x轴为时间日期时,有可能间隔太密集导致显示都叠加在一起。此时可以用matplotlib.figure.Figure.autofmt_xdate()函数来自动调整X轴日期的显式。
也可以调整X轴的显示格式。当X轴为时间时,其显示由Axes.fmt_xdata属性来提供。该属性是一个函数对象或者函数,接受一个日期参数,返回该日期的显示字符串。matplotlib已经提供了许多date formatter,你可以直接使用ax.fmt_xdata=matplotlib.dates.DateFormatter('%Y-%m-%d')。
1 2 3 4 5 6 | fig2,ax2 = plt.subplots(1)ax2.plot(ndates,n_ys)fig2.autofmt_xdate() # 调整x轴时间的显示 ax2.fmt_xdata = mdates.DateFormatter('%Y-%m-%d') # 格式化器plt.show() |
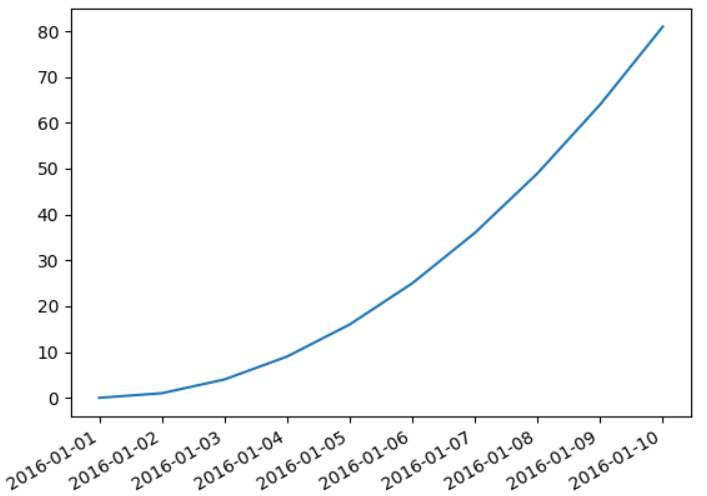
(2)plt.xticks(rotation=顺时针旋转角度)
1 2 3 4 5 | fig3,ax3 = plt.subplots(1)ax3.plot(ndates,n_ys)plt.xticks(rotation=25)plt.tight_layout()plt.show() |
(3)ax.set_xticklabels(rotation=顺时针旋转角度)
1 2 3 4 5 | fig4,ax4 = plt.subplots(1)ax4.plot(ndates,n_ys)ax4.set_xticklabels(ndates,rotation=25,ha="right")plt.tight_layout()plt.show() |
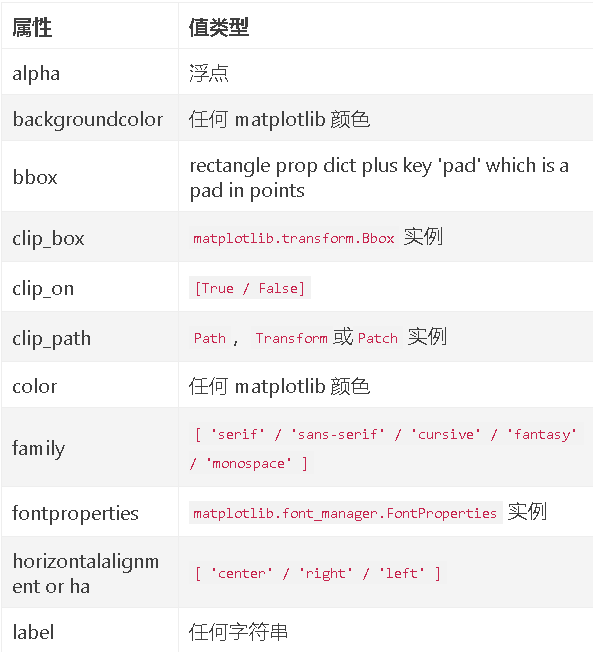
4. 放置 text box
当你在Axes中放置text box时,你最好将它放置在axes coordinates下,这样当你调整X轴或者Y轴时,它能够自动调整位置。
你也可以使用Text的.bbox属性来让这个Text始终放在某个Patch中。其中.bbox是个字典,它存放的是该Patch实例的属性。
语法:
1 | ax.text(x, y, s, fontdict=None, withdash=False, **kwargs) |
功能:将文本s添加到数据坐标中位置x,y的轴上。
参数:
- x,y:张量,放置文本的位置。 默认情况下,这是在数据坐标中。 可以使用变换参数来更改坐标系。
- s:文本
- fontdict:字典,可选,覆盖默认文本属性的字典。 如果fontdict为None,则默认值由rc参数确定。
- withdash:布尔值,可选,默认值:False。创建一个〜matplotlib.text.TextWithDash实例,而不是一个〜matplotlib.text.Text实例。
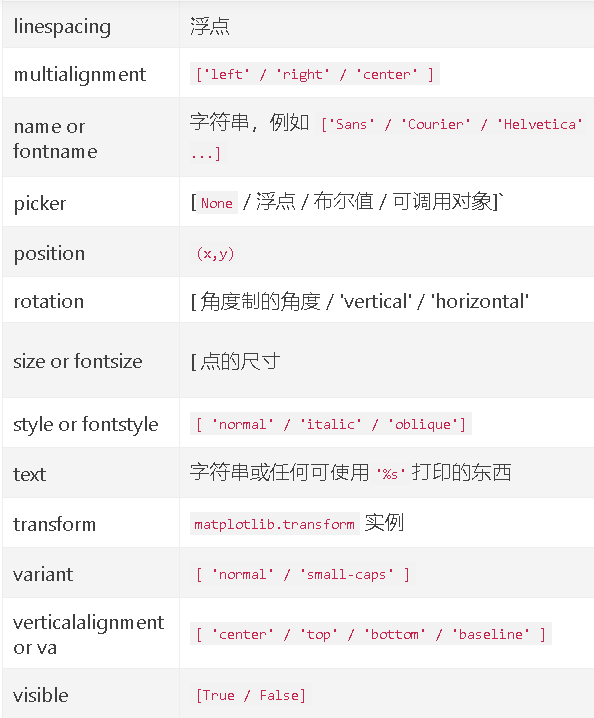
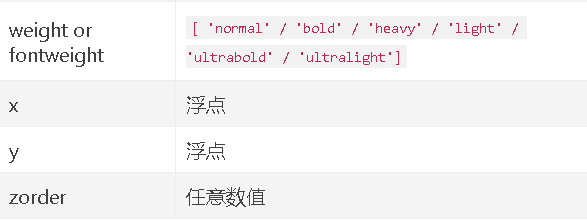
horizontalalignment,verticalalignment和multialignment来布置文本。horizontalalignment控制文本的x位置参数表示文本边界框的左边,中间或右边。verticalalignment控制文本的y位置参数表示文本边界框的底部,中心或顶部。multialignment,仅对于换行符分隔的字符串,控制不同的行是左,中还是右对齐。
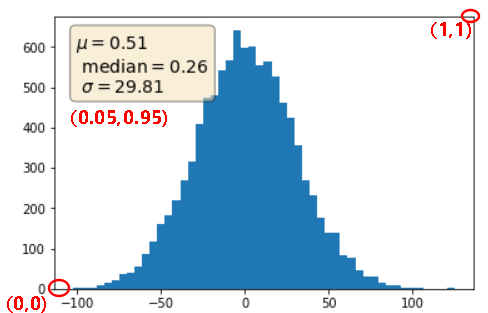
text()命令显示各种对齐方式的例子。 在整个代码中使用transform = ax.transAxes,表示坐标相对于轴边界框给出,其中0,0是轴的左下角,1,1是右上角。举例:
1 2 3 4 5 6 7 8 9 10 11 12 13 14 | import matplotlib.pyplot as pltimport numpy as npfig,ax = plt.subplots(1)x = 30 * np.random.randn(10000)mu = x.mean()median = np.median(x)sigma = x.std()textstr = '$\mu=%.2f$ \n $\mathrm{median}=%.2f$ \n $\sigma=%.2f$'%(mu,median,sigma)ax.hist(x,50)props=dict(boxstyle='round',facecolor='wheat',alpha=0.5)ax.text(0.05,0.95,textstr,transform=ax.transAxes,fontsize=14,verticalalignment='top',bbox=props)fig.show() |
5. LATEX文字
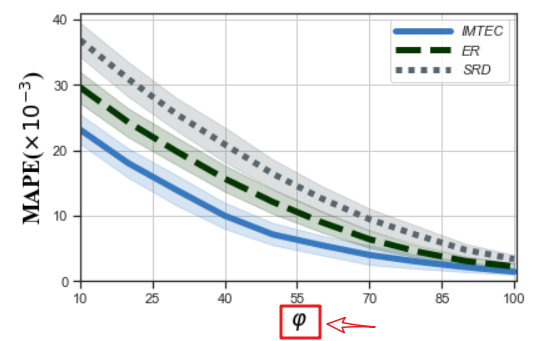
要想在文本中使用LATEX,你需要使用''这种字符串(即使用'...$'的格式,因为原生字符串不会转义'\',从而使得大量的LATEX词法能够正确解析。
举例:
1 2 3 4 5 6 7 8 9 10 11 12 13 14 15 16 17 18 19 20 21 22 23 | sns.set(style='ticks')sns.set_context(rc={'lines.linewidth':5})plt.xlim((10,100.5))plt.ylim((0,41))plt.xticks(np.arange(10, 100.5, 15))plt.yticks(np.arange(0,41,10))# "greyish", "faded green",colors = ["windows blue", "dark green", "slate grey"]palette = sns.xkcd_palette(colors)ax = sns.lineplot(x="phi", y="MAPE",hue = 'alg', style='alg',data=df_mape_change_phi, markers = False,palette=palette)# - 实线-- 短线-.短点相间线:虚点线 # ax.lines[0].set_linestyle("-")# ax.lines[1].set_linestyle("-.")# ax.lines[2].set_linestyle("--")plt.xlabel(r'$\varphi$', fontdict={'color': 'black','family': 'Times New Roman','size': 18})plt.ylabel(r'MAPE($\times 10^{-3}$)', fontdict={'color': 'black','family': 'Times New Roman','size': 18})plt.legend(['IMTEC','ER','SRD'],prop={'style': 'italic'},handlelength=4)#图例plt.grid(True)plt.tight_layout()plt.savefig('local_pic/phi_mape.jpg',dpi=600)# plt.savefig('loc_svg/TD_precision_tasknum.svg')plt.show() |
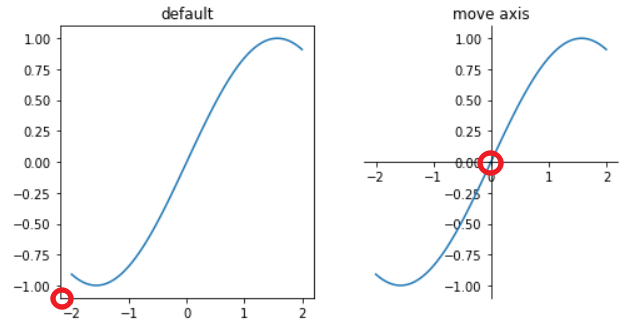
6. 平移坐标轴
Axes.spines是个字典,它存放了四个键,分别为:
Axes.spines['left'],Axes.spines['right'],Axes.spines['top'],Axes.spines['bottom']
他们都是一个matplotlib.spines.Spine对象,该对象继承自matplotlib.patches.Patch对象,主要是设置图形边界的边框。
-
Spine.set_color('none'):不显示这条边线 -
Spine.set_position((position)):将边线移动到指定坐标,其中position是一个二元元组,指定了(position type,amount),position type可以是:outward:在绘图区域之外放置边线,离开绘图区域的距离由amount指定(负值则在会去区域内绘制)axes:在Axes coordinate内放置边线(从 0.0 到 1.0 )data:在data coordinate内放置边线
你也可以指定
position为:'center',等价于('axes',0.5);或者'zero',等价于('data',0.0)
举例:
1 2 3 4 5 6 7 8 9 10 11 12 13 14 15 16 17 18 19 20 21 22 23 24 | import matplotlib.pyplot as pltimport numpy as npX = np.linspace(-2,2,num=100)Y = np.sin(X)fig = plt.figure(figsize=(8,4))# ax1ax1 = fig.add_subplot(1,2,1)ax1.plot(X,Y)ax1.set_title('default')# ax2ax2 = fig.add_subplot(1,2,2)ax2.plot(X,Y)ax2.spines['right'].set_color('none') # 不显示右边框ax2.spines['top'].set_color('none') # 不显示上边框ax2.xaxis.set_ticks_position('bottom') # 设置x坐标轴为下边框ax2.yaxis.set_ticks_position('left') # 设置y坐标轴为左边框ax2.spines['bottom'].set_position(('data',0))# 设置x轴, y轴在(0, 0)的位置ax2.spines['left'].set_position(('data',0)) ax2.set_title('move axis') |
7. 清除绘图
(1)通过pyplot清除绘图
pyplot.cla():清除current axis。非当前axis不受影响pyplot.clf():清除current figure。但是它不关闭windowpyplot.close():关闭window
(2)通过面向对象的方法
Figure.clf():清除该Figure对象的所有内容。
8. 清除X坐标和Y坐标
1 2 3 | Axes.set_xticks(())Axes.set_yticks(())Axes.set_axis_off() #清除tick和边框 |
9. 设置中文
在linux 下,为了支持中文,则在开头设置:
1 2 | import matplotlib.pyplot as pltplt.rcParams['font.sans-serif'] = ['SimHei'] #matplotlib 中文字体 |
参考文献:
【1】matplotlib的基本用法(三)——调整坐标轴_SnailTyan-CSDN博客
【2】huaxiaozhuan大佬博客


【推荐】国内首个AI IDE,深度理解中文开发场景,立即下载体验Trae
【推荐】编程新体验,更懂你的AI,立即体验豆包MarsCode编程助手
【推荐】抖音旗下AI助手豆包,你的智能百科全书,全免费不限次数
【推荐】轻量又高性能的 SSH 工具 IShell:AI 加持,快人一步
· go语言实现终端里的倒计时
· 如何编写易于单元测试的代码
· 10年+ .NET Coder 心语,封装的思维:从隐藏、稳定开始理解其本质意义
· .NET Core 中如何实现缓存的预热?
· 从 HTTP 原因短语缺失研究 HTTP/2 和 HTTP/3 的设计差异
· 分享一个免费、快速、无限量使用的满血 DeepSeek R1 模型,支持深度思考和联网搜索!
· 使用C#创建一个MCP客户端
· ollama系列1:轻松3步本地部署deepseek,普通电脑可用
· 基于 Docker 搭建 FRP 内网穿透开源项目(很简单哒)
· 按钮权限的设计及实现