
matplotlib---7.坐标变换
一、matplotlib的坐标系
1.matplotlib的四个坐标系:
- 用户级的
data坐标系:坐标转换对象为ax.transData。它是用户级坐标系,由xlim和ylim控制 Axes坐标系:坐标转换对象为ax.transAxes。它是Axes的坐标系,(0,0)为Axes的左下角,(1,1)为Axes的右上角。Figure坐标系:坐标转换对象为fig.transFigure。它是Figure的坐标系,(0,0)为Figure的左下角,(1,1)为Figure的右上角。display坐标系:它没有坐标转换对象。它显示的是display的像素坐标系,(0,0)为display的左下角,(width,height)为display的右上角。
前面三个坐标系的坐标转换对象有方法执行坐标转换,这些方法接受输入并产生输出:输入为本坐标系内的坐标点,输出为display坐标系中的坐标。(因此display坐标系没有坐标转换对象)。当然他们也有相关方法将来自于display坐标系中的坐标转换回本坐标系内的坐标。
2.在Artist的构造函数中传入transform关键字参数(其值为坐标转换对象),就能够切换坐标系。如:ax.text(0.05,0.95,label,"This is a Text",transform=ax.transAxes),将Text放置于Axes坐标系中的(0.05,0.95)位置处。
通常不建议直接使用
display坐标系。因为它固定了绝对坐标,导致你resize图表时你必须重新定位坐标。所以你必须监听resize事件,非常麻烦。
1.用户的data坐标系
1.1 当调用ax.set_xlimit(x_min,x_max)以及ax.set_ylimit(y_min,y_max)时,即建立起了用户data坐标系。左下角坐标为(x_min,y_min),右上角坐标为(x_max,y_max)。
有时候你可能并没有显式调用
.set_xlimit()以及.set_ylimit()。其实matplotlib会隐式调用它们来设置坐标轴的数据范围。
1 2 3 4 5 6 7 | import matplotlib.pyplot as pltfig = plt.figure()ax = fig.add_subplot(111)ax.set_xlim(0, 10)ax.set_ylim(-1, 1)type(ax.transData)ax.transData.transform((5, 0)) |

1.2 你可以调用ax.transData返回data坐标系的坐标转换对象。对该坐标转换对象调用.transform(point)方法会返回point在display坐标系下的坐标。其中point是点在data坐标系下的坐标(x,y)。你也可以给.transform()方法一次传入多个点的坐标,此时输出也是对应于display坐标系下的一系列坐标。
1.3 你可以对ax.trandData返回的坐标转换对象调用.inverted()方法。该方法返回的是一个坐标逆转换对象。对该坐标逆转换对象调用.transform(point)方法会返回point在data坐标系下的坐标。其中point是点在display坐标系下的坐标(x,y)。你也可以给.transform()方法一次传入多个点的坐标,此时输出也是对应于data坐标系下的一系列坐标。
1.4 当你调用了ax.set_xlim()或者ax.set_ylim()时,坐标转换对象会实时更新。
1 2 3 4 5 6 7 8 9 10 11 12 13 14 15 16 17 18 19 | import matplotlib.pyplot as pltfig = plt.figure()ax = fig.add_subplot(111)ax.set_xlim(0,10)ax.set_ylim(-1,1)print(type(ax.transData)) # <class 'matplotlib.transforms.CompositeGenericTransform'>ax.transData.transform((5,0)) # data坐标对应的display坐标 array([221.4 , 144.72])ax.transData.transform([(5,0),(1,2)]) # array([[221.4 , 144.72], [ 87.48, 362.16]])inv = ax.transData.inverted()print(type(inv)) # <class 'matplotlib.transforms.CompositeGenericTransform'>inv.transform((221.4 , 144.72))ax.set_ylim(-1,2) # 调整了ylimitax.transData.transform((5,0)) # 相同的data坐标系内的点,display坐标改变# array([221.4 , 108.48]) |
2.Axes坐标系
2.1 在Axes坐标系中,(0,0)位于Axes的左下角,(1,1)位于Axes的右上角,(0.5,0.5)位于Axes的中心。当然你可以引用位于这之外的点,如(-0.1,1.1)。
2.2 通常如果你需要在Axes中放置一些文字说明,那么一般都是采用Axes坐标系来定位。这样无论图形怎么缩放,这些Text都能位于正确的位置。
2.3 你也可以在Axes中通过Axes坐标系添加一些Patch,但是通常建议在data坐标系下添加。因为你在Axes中添加的图表当图表缩放时可能会出现问题。
3.混合坐标系(data坐标系+Axes坐标系)
3.1 有时候你需要混合data坐标系和Axes坐标系。
matplotlib.transforms.blended_transform_factory(ax.transData, ax.transAxes)
功能:返回一个混合坐标系
参数:
x坐标为data坐标系,y坐标为Axes坐标系。
因此该坐标系中(1,1)表示的是data坐标系中x=1但是y位于最上方的点。
举例:
1 2 3 4 5 6 7 8 9 10 11 | import matplotlib.pyplot as pltimport matplotlib.transforms as tsfimport matplotlib.patches as pthfig = plt.figure()ax = fig.add_subplot(111)trans = tsf.blended_transform_factory(ax.transData,ax.transAxes)rect = pth.Rectangle((1,0),width=1,height=1,transform=trans,color='yellow',alpha=0.5)ax.add_patch(rect)ax.set_xlim(0,4)ax.set_ylim(-4,4)plt.show() |

3.2 有两个函数返回特定的混合坐标系:
matplotlib.axes.Axes.get_xaxis_transform():等价于matplotlib.transforms.blended_transform_factory(ax.transData, ax.transAxes)。x坐标为data坐标系,y坐标为Axes坐标系。常用于绘制x轴的label、tick、gridline。matplotlib.axes.Axes.get_yaxis_transform():等价于matplotlib.transforms.blended_transform_factory(ax.transAxes,ax.transData)。x坐标为Axes坐标系,y坐标为data坐标系。常用于绘制y轴的label、tick、gridline。
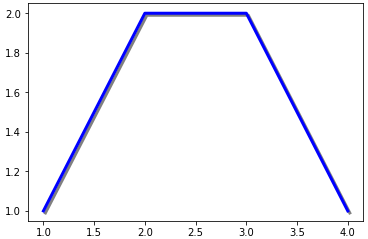
4.利用坐标变换制造阴影效果
4.1 matplotlib.transform.ScaledTranslation(xt, yt, scale_trans)创建一个新的坐标转换对象,该坐标转换由xt和yt经过scale_trans坐标转换而来。
它创建的是一个偏移对于的坐标变换。偏移的坐标是位于
scale_trans中的。
-
制作阴影的时候,将阴影的
zorder调小,从而使得阴影首先绘制并位于底层 -
当
scale_trans为fig.dpi_scale_trans坐标转换对象时,xt,yt的单位是像素。 -
还有一个方法也能达到同样的效果:
matplotlib.transforms.offset_copy(trans,x=xt,y=yt,units='inches'),但是该方法返回的坐标转换对象是trans合成了偏移之后的效果。
举例:
1 2 3 4 5 6 7 8 9 10 11 12 | import matplotlib.pyplot as pltimport matplotlib.transforms as transformsimport matplotlib.patches as patchesfig = plt.figure()ax = fig.add_subplot(111)line, = ax.plot([1,2,3,4],[1,2,2,1],lw=3,color='blue')dx,dy = 2/72. , -2/72. # 偏移量offset = transforms.ScaledTranslation(dx,dy,fig.dpi_scale_trans)shadow_transform = ax.transData + offsetax.plot([1,2,3,4],[1,2,2,1],lw=3,color='gray',transform=shadow_transform,zorder=0.5*line.get_zorder())#阴影plt.show() |
5.直角坐标系、对数坐标系、极坐标系
5.1 设置x轴/y轴是否对数坐标
通过Axes.set_xscale(value,**kwargs)/Axes.set_yscale(value,**kwargs)方法可以设置x轴/y轴是否对数坐标。其中value可以为:
linear:线性log:对数。其中basex|basey关键字指定对数的基logit:以2为底的对数symlog:对数,其中basex|basey关键字指定对数的基
你也可以通过matplotlib.pyplot.xscale()和matplotlib.pyplot.yscale()来设置对数坐标。一定要先添加数据后设置对数坐标。
举例:
1 2 3 4 5 6 7 8 9 10 11 12 13 14 15 16 17 18 19 20 21 22 23 24 25 26 27 28 29 | import numpy as npimport matplotlib.pyplot as plty = np.random.normal(loc=0.5,scale=0.4,size=1000)y = y[(y>0) & (y<1)]y.sort()x = np.arange(len(y))plt.figure(figsize=(12,8))plt.subplot(221)plt.plot(x,y)plt.grid(True)plt.subplot(222)plt.plot(x,y)plt.yscale('log')plt.grid(True)plt.subplot(223)plt.plot(x,y-y.mean())plt.yscale('symlog',linthreshy=0.05)plt.grid(True)plt.subplot(224)plt.plot(x,y)plt.yscale('logit')plt.grid(True)plt.tight_layout()plt.show() |

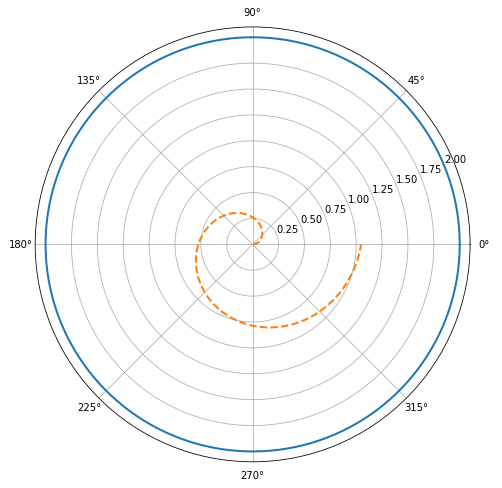
5.2 创建极坐标的Axes
通过Figure.add_axes((left,bottom,width,height), projection='polar')或者Figure.add_axes((left,bottom,width,height), polar=True)方法可以创建一个极坐标的Axes。其中polar关键字是为了兼容旧代码,新代码推荐用projection关键字,因为projection关键字不仅可以设置极坐标,还可以设置自定义坐标(它将坐标统一为映射关系)。
Figure.add_subplot(...)也是同样的设置
举例:
1 2 3 4 5 6 | import matplotlib.pyplot as pltfig = plt.figure(figsize=(12,8))ax = fig.add_subplot(111,projection='polar')theta = np.arange(0,2*np.pi,0.02)ax.plot(theta,2*np.ones_like(theta),lw=2)ax.plot(theta,theta/6,'--',lw=2) |


【推荐】国内首个AI IDE,深度理解中文开发场景,立即下载体验Trae
【推荐】编程新体验,更懂你的AI,立即体验豆包MarsCode编程助手
【推荐】抖音旗下AI助手豆包,你的智能百科全书,全免费不限次数
【推荐】轻量又高性能的 SSH 工具 IShell:AI 加持,快人一步
· go语言实现终端里的倒计时
· 如何编写易于单元测试的代码
· 10年+ .NET Coder 心语,封装的思维:从隐藏、稳定开始理解其本质意义
· .NET Core 中如何实现缓存的预热?
· 从 HTTP 原因短语缺失研究 HTTP/2 和 HTTP/3 的设计差异
· 分享一个免费、快速、无限量使用的满血 DeepSeek R1 模型,支持深度思考和联网搜索!
· 使用C#创建一个MCP客户端
· ollama系列1:轻松3步本地部署deepseek,普通电脑可用
· 基于 Docker 搭建 FRP 内网穿透开源项目(很简单哒)
· 按钮权限的设计及实现