[转]Windows上的valgrind--deleaker
Valgrind is a developer tool for C++ developers used to find memory issues including C++ memory leak detection. Valgrind uses instrumentation to collect information about allocated and freed memory to gather complete information about memory blocks.
Many developers ask how to use Valgrind on Windows and Visual Studio. Valgrind heavy relies on Linux internals, that’s why Valgrind does not support Windows.
Fortunately, there is a Valgrind alternative for Windows, called Deleaker. It is a memory profiler tool for Windows. While Valgrind uses instrumentation that makes the code slower about 10x times, Deleaker uses hooks and does not modify code of a program: code execution speed remains almost the same. Deleaker doesn’t require a program to be rebuilt. All what Deleaker needs is a debug information to locate source of leaks.
Also Deleaker detects Windows specific leaks such as GDI leaks, leaks of handles.
Deleaker can work as a standalone application and as an extension for Visual Studio. The standalone version is suitable for memory leaks profiling on a client machine when the installation of Visual Studio is not allowed. If your favourite IDE is Qt Creator or C++ Builder, it is worth mentioning that Deleaker integrates with them as well.
With Deleaker extension for Visual Studio, a developer checks code for memory leaks, identifying exact leaking places quite quickly. Deleaker assists a developer, showing list of allocated memory blocks with their call stacks and other information including hit count, size, module path and others.
Let’s look at how it works. Create new console application and add a simple leak:
|
1
2
3
4
5
6
7
8
9
10
11
12
|
<br>#include <windows.h></windows.h></p><p>int main()<br>{<br> for (int i = 0; true; i++)<br> {<br> new int[100000];<br> CreateEventW(NULL, FALSE, FALSE, NULL);<br> CreateDC(L"DISPLAY", NULL, NULL, NULL);<br> Sleep(500);<br> }<br>}<br> |
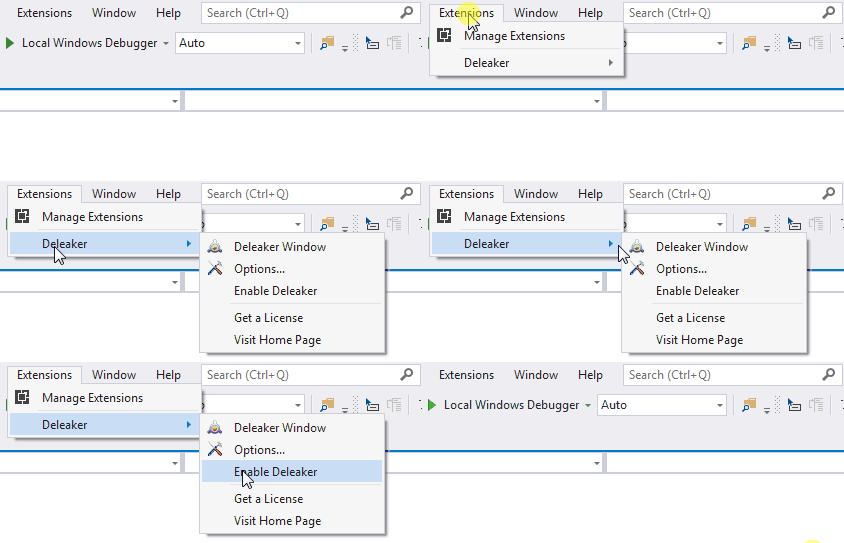
Before starting debugging, ensure that Deleaker is enabled:

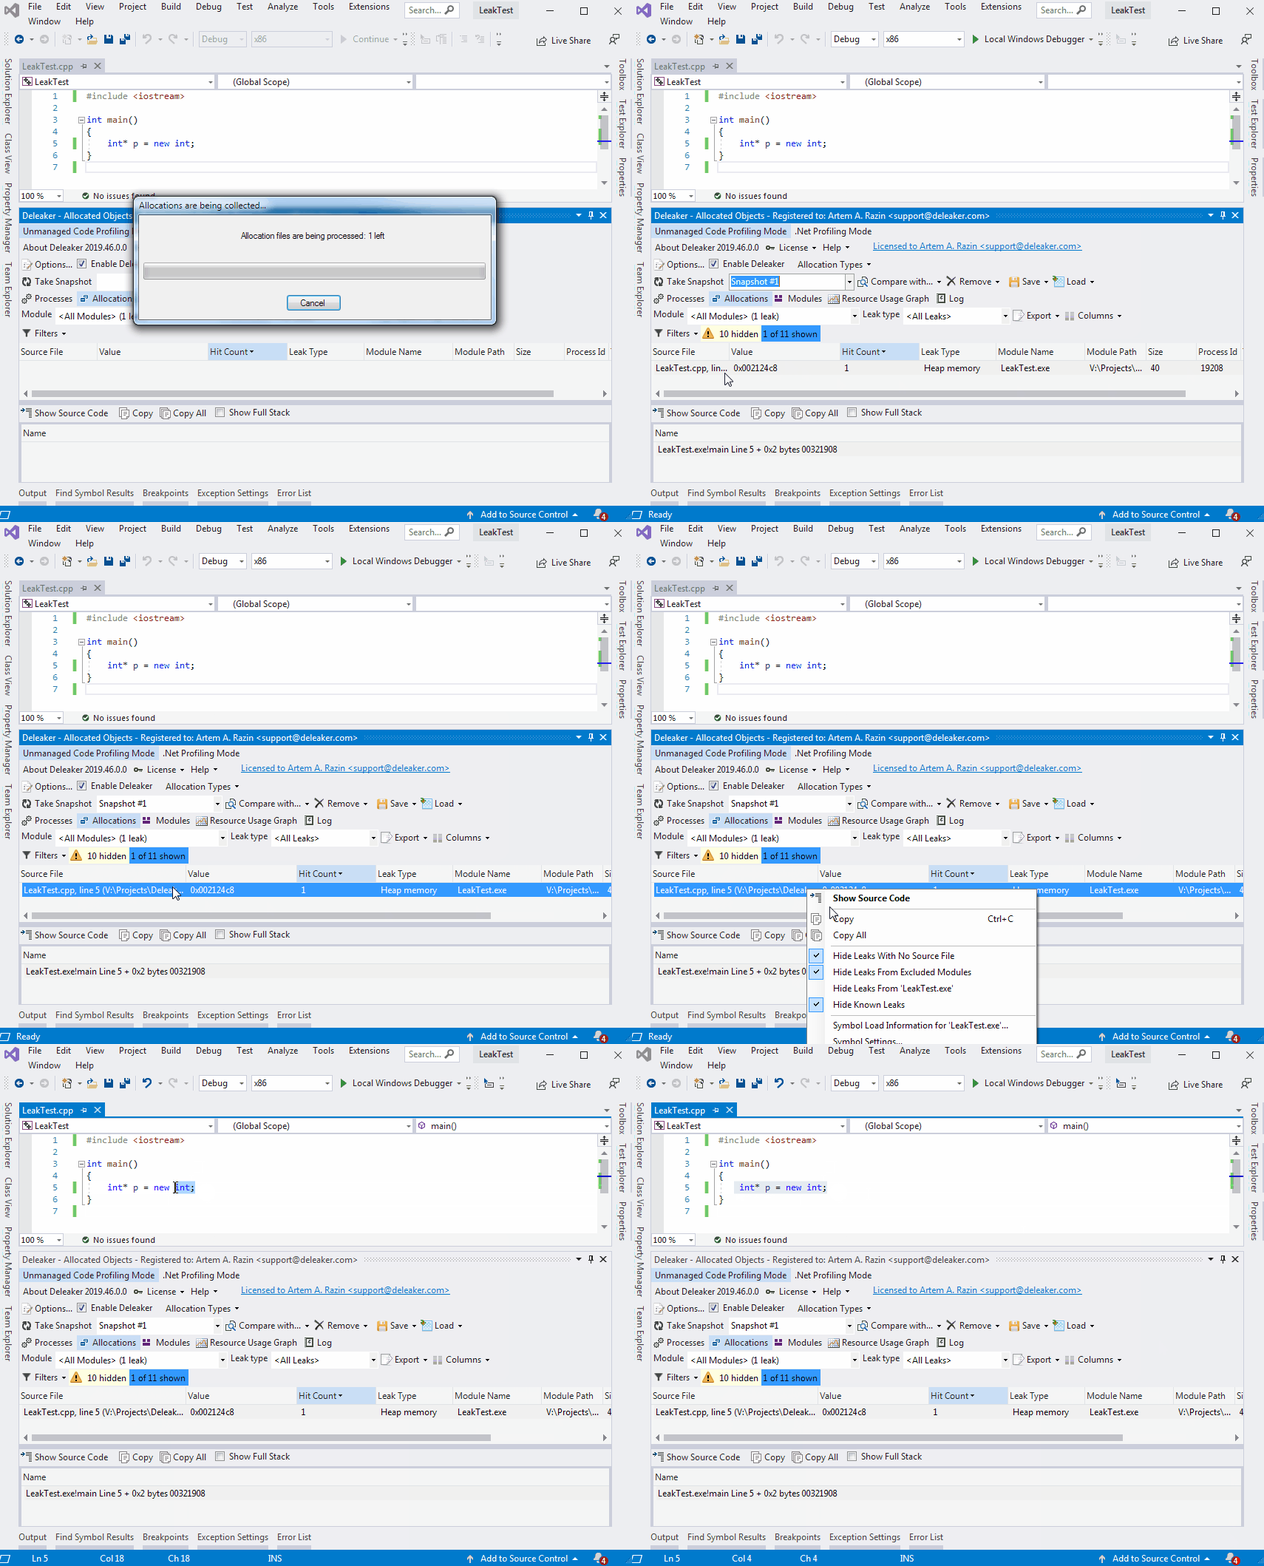
Start debugging. The application allocates memory and exits. Once the debugging stopped, Deleaker takes a snapshot and shows a report. To navigate to the source of a leak, just right-click and select Show Source Code:

Deleaker can compare snapshots to find some recurring leaks. Also a developer can export snapshots to review them later.
Deleaker comes with a command line tool, DeleakerConsole.exe, that can be used to integrate memory leaks checking into continuous integration process to ensure that an application does not leak. DeleakerConsole.exe prepares memory leaks reports in XML format that can be analyzed.
If you are looking for an alternative of Valgrind, try Deleaker. It is a C++ memory leak detection tool for Windows that is fast, supports both 32-bit and 64-bit code, and integrates with all major IDE including Visual Studio, Qt Creator and RAD Studio.


 浙公网安备 33010602011771号