

七、手写实现决策树算法
1. 实现决策树的前提:信息增益
信息增益:
数据集合在被处理的之前之后,其信息发生的变化称为信息增益。
香农熵或熵:
集合信息的度量方式称为香农熵或者简称为熵。
熵被定义为信息的期望值:
-
信息的定义
如果存在有多个分类(分类1、分类2...)的条件下,待分类的事务可能被划分为其中某个分类,则该事务()的信息定义为:
-
信息的期望值
- n是分类的数目
计算给定集合中特征的熵:
-
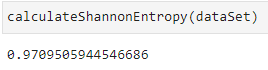
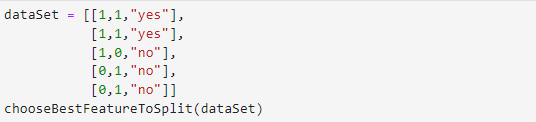
假定集合为:
dataSet = [[1,1,"yes"],
           [1,1,"yes"],
           [1,0,"no"],
           [0,1,"no"],
           [0,1,"no"]]
共三个特征
-
python计算该集合的熵
import math def calculateShannonEntropy(dataSet): # 计算数据集中实例的总数 numRows = len(dataSet) # 创建存储标签的字典,方便计数 labelCounts = {} for data in dataSet: # 取数据集的最后一个特征 currentLabel = data[-1] # 如果特征不存在,则赋予默认值,否则计数+1 if currentLabel not in labelCounts.keys(): labelCounts[currentLabel] = 0 labelCounts[currentLabel] += 1 # 初始化熵值 shannonEntropy = 0.0 for currentLabel in labelCounts: # 计算当前类别标签的发生频率,即该类别出现的概率 probability = float(labelCounts[currentLabel])/numRows # 计算所有特征的所有可能值包含的信息期望值 shannonEntropy -= probability * math.log(probability,2) # 返回香农熵 return shannonEntropy -
结果
2. 实现决策树的前提:划分数据集
抽取符合给定特征的数据集:
def splitDataSet(dataSet, feature_seq : int = 0, feature_value=None):

    '''
    抽取符合要求的值,形成一个新的集合

    :param dataSet: 数据集
    :param feature_seq: 特征在数据集中的位置,默认从0开始
    :param feature_value: 指定特征的值
    :return:
    '''

    # 创建一个新集合,防止对源数据集合的修改
    resultDataSe t = list()

    for data in dataSet:
        # 获取新集合,新集合中排除目标特征
        if data[feature_seq] == feature_value:
            # 选择在feature_seq之前的特征
            reduceFeature = data[:feature_seq]
            # 选择在feature_seq之后的特征
            reduceFeature.extend(data[feature_seq + 1:])
            resultDataSet.append(reduceFeature)

    return resultDataSet
找到最好的特征划分方式:
需要满足两个条件:
- 数据必须时一种由列表元素组成的列表,而且所有的列表元素都要具有相同的数据长度
- 数据的最后一列或者每个实例的最后一个元素是当前实例的类别标签
def chooseBestFeatureToSplit(dataSet):
    '''
    选择源数据集中的最好特征

    信息增益是熵的减少或者是数据无序度的减少。

    :param dataSet:
    :return: 比较所有特征中的信息增益,返回最好特征划分的索引值
    '''

    # 获取特征的长度
    numFeatures = len(dataSet[0])
    # 计算源数据的最后一个特征的香农熵(最初的无序度量值)
    baseEntropy = calculateShannonEntropy(dataSet)
    # 初始化信息增益
    bestInfoGain = 0.0
    # 初始化最好的特征
    bestFeature:int = -1

    # 循环遍历所有特征,要排除最后一个特征,最后一个特征已计算香农熵
    # 对每个特征划分一次数据集
    for i in range(numFeatures-1):
        # 获取特征 i 下的 所有值
        featList = [example[i] for example in dataSet]
        # 对特征i的取值去重
        uniqueVals = set(featList)
        newEntropy = 0.0
        # 用特征i下的不同值,循环切割数据,获取熵
        for value in uniqueVals:
            # 按照不同的 特征值,进行数据切割
            subDataSet = splitDataSet(dataSet,i,value)
            # 计算 该数据子集的 选中概率
            probability = len(subDataSet)/len(dataSet)
            # 累加 该数据自己的 香农熵
            newEntropy += probability * calculateShannonEntropy(subDataSet)

        # 计算用该特征i进行数据集划分时的信息增益
        infoGain = baseEntropy - newEntropy

        # 打印 当前特征序列,当前信息增益,信息增益差,初始信息增益
        print("current feature_seq: {},shannonEntropy:{},infoGain:{},baseEntropy:{}".format(i,newEntropy,infoGain,baseEntropy))

        # 不断迭代 信息增益,获取 信息增益最大的那个特征i
        if (infoGain > bestInfoGain):
            bestInfoGain = infoGain
            print()
            bestFeature = i

    return bestFeature
3. 递归构建决策树
工作原理:
- 得到原始数据集,然后基于最好的属性值划分数据集
- 消耗特征,划分数据集,构建最好特征下的分类树,数据将被向下传递到树分支的下一个节点
- 每颗分类树形成的子集,被再次划分数据,重复1,2步骤,直到满足递归结束条件
- 返回生成的树
多数表决的情况:
如果数据集已经处理了所有属性,但是类标签依然不是唯一的,此时我们需要决定如何定义该叶子节点,通常会采用多数表决的方式决定该叶子节点的分类。
def majorityCount(classList):
    '''
    统计每个类标签出现的频率,并返回出现次数最多的分类名称

    :param classList: 存放类标签
    :return:
    '''
    classCount = dict()
    for vote in classList:
        if vote not in classList.keys():
            classList[vote] = 0
        classList[vote] += 1
    # sorted默认为False:升序
    sortedClassCount = sorted(classCount.items(),
                              key=operator.itemgetter(1),
                              reverse=True)
    return sortedClassCount[0][0]
创建决策树:
def createTree(dataSet,featureLabels):

    # 设数据集最后一列为当前实例的类别标签
    classList = [example[-1] for example in dataSet]

    # 递归终止条件
    # list.count(value),统计list中value出现的次数
    # 如果该分支下,实例具有相同的分类,则所有实例都具有相同的分类
    if classList.count(classList[0]) == len(classList):
        print("current classList1:{}".format(classList))
        return classList[0]

    # 如果数据集已经处理了所有属性(即只剩下一个待处理特征),但是类标签依然不是唯一的,此时采用多数表决的方法决定该叶子节点的分类
    # 注意 ,此处 dataSet[0] 是选择,row=0(即样本中的一条数据),而不是col=0
    if len(dataSet[0]) == 1:
        print("current classList2:{}".format(classList))
        return majorityCount(classList)

    # 选择最好的特征,注意返回的是 特征的索引
    bestFeature_seq = chooseBestFeatureToSplit(dataSet)
    # 获取最好的特征的值
    bestFeatureLabel = labels[bestFeature_seq]

    # 初始化树结构
    myTree = {
        bestFeatureLabel:{}
    }

    # 删除该特征,相当于消耗了特征
    del(featureLabels[bestFeature_seq])

    # 获取dataSet的特征值向量
    featureValues = [example[bestFeature_seq] for example in dataSet]
    # 对dataSet的特征值向量去重
    uniqueValues = set(featureValues)
    # 遍历每个特征值,切分数据形成子集
    for value in uniqueValues:
        # 确定子集的 特征值
        subLabels = featureLabels[:]
        # 按照 bestFeatureLabel的唯一值,遍历创建树结构,同时递归调用,创建子树
        myTree[bestFeatureLabel][value] = createTree(splitDataSet(dataSet,
                                                                  bestFeature_seq,
                                                                  value),
                                                     subLabels)
    # 返回树
    return myTree
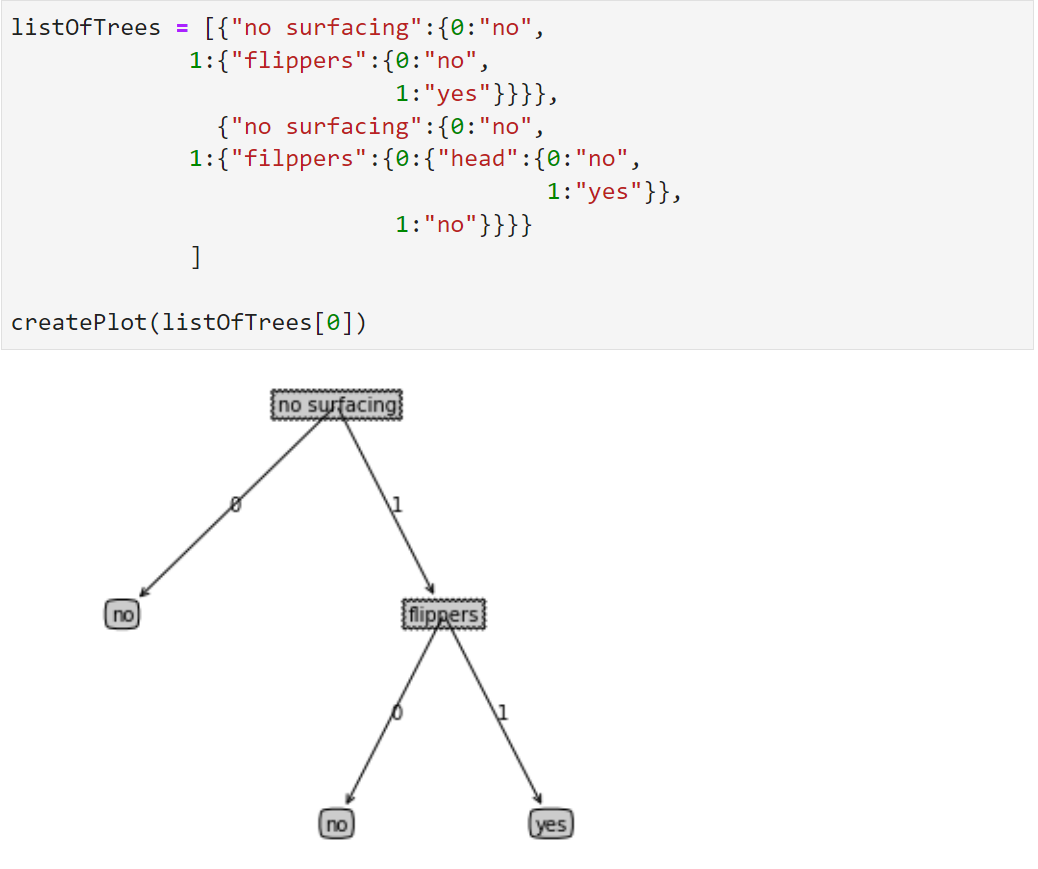
4. 使用matplotlib绘制树图形
获取叶节点的数据:
def getNumLeafs(myTree):
'''
获取数据的叶节点数目
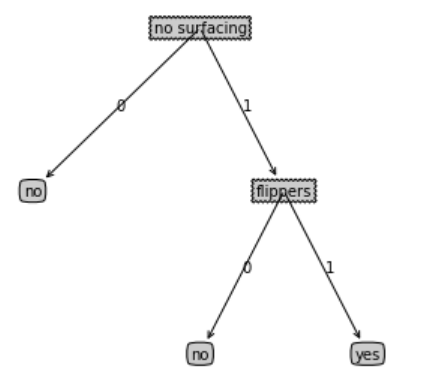
:param myTree: 传递进来的数结构:{'no surfacing': {0: 'no', 1: {'flippers': {0: 'no', 1: 'yes'}}}}
:return:
'''
numLeafs = 0
# 根节点,理论上应该只有一个值
firstStr = list(myTree.keys())[0]
# 获取根节点下的所有子节点数据
secondDict = myTree[firstStr]
# 遍历子节点
for key in secondDict.keys():
if type(secondDict[key]).__name__ == "dict":
# 如果子树,不是一个叶节点,则递归调用函数,累计叶节点数
numLeafs += getNumLeafs(secondDict[key])
# 如果子数,是一个叶节点,则累加
else:
numLeafs += 1
return numLeafs
获取树的层数:
def getTreeDepth(myTree):
    '''
    获取数据的树的层数
    :param myTree: 传递进来的数结构:{'no surfacing': {0: 'no', 1: {'flippers': {0: 'no', 1: 'yes'}}}}
    :return:
    '''
    maxDepth = 0
    firstStr = list(myTree.keys())[0]
    secondDict = myTree[firstStr]
    for key in secondDict.keys():
        if type(secondDict[key]).__name__ == "dict":
            # 如果子树,是非叶节点,则在父节点的基础上累加
            thisDepth = 1 + getTreeDepth(secondDict[key])
        else:
            # 如果是叶节点,则赋值1
            thisDepth = 1

        # 返回最大深度
        if thisDepth > maxDepth:
            maxDepth = thisDepth

    return maxDepth
画图:
def plotMidText(subPoint,parentPoint,nodeText,ax):
    '''
    在父节点和子节点 中间位置,标注nodeText内容
    :param centerPoint: 子节点坐标
    :param parentPoint: 父节点坐标
    :param nodeText: 标注内容
    :param ax: 传递的 plt.figure().add_subplot() 对象
    :return:
    '''
    xMid = (parentPoint[0]-subPoint[0])/2 + subPoint[0]
    yMid = (parentPoint[1]-subPoint[1])/2 + subPoint[1]
    ax.text(xMid,yMid,nodeText)


def plotNode(nodeText,subPoint,parentPoint,nodeType,ax):
    '''

    :param nodeText: 注解的文本内容
    :param subPoint: 子节点的
    :param parentPoint:
    :param nodeType:
    :param ax:
    :return:
    '''
    arrow_args = dict(arrowstyle="<-")
    ax.annotate(nodeText,
                xy=parentPoint,
                xycoords='axes fraction', # 指定坐标系 | 'axes fraction' | 0,0 是轴域左下角,1,1 是右上角 |
                xytext=subPoint,
                textcoords='axes fraction',
                va='center',
                ha='center',
                bbox=nodeType,
                arrowprops=arrow_args)


def plotTree(currentTree,parentPoint,nodeText,xOff,yOff,totalW,totalD,ax):
    '''

    :param currentTree: 当前的树结构 {'no surfacing': {0: 'no', 1: {'flippers': {0: 'no', 1: 'yes'}}}}
    :param parentPoint: 当前的根节点
    :param nodeText: 标签内容
    :param xOff:
    :param yOff:
    :param totalW: 原始树的总宽度
    :param totalD: 原始树的总高度
    :param ax: 传递的 plt.figure().add_subplot() 对象
    :return:
    '''
    # 确定当前tree的宽度
    numLeafs = getNumLeafs(currentTree)
    # 确定当前tree的高度
    depth = getTreeDepth(currentTree)
    # 获取根节点的标签名
    firstStr = list(currentTree.keys())[0]

    '''
    树的宽度用于计算放置判断节点的位置,主要的计算原则是将它放在所有叶子节点的中间,而不仅仅是它子节点的中间

    按照叶子节点的数目将x轴划分称为若干部分
    '''
    subPoint = (xOff + (1.0 + float(numLeafs))/2.0/totalW,yOff)

    # print("xOff:{},numLeafs:{},totalW:{},yOff:{},subPoint:{}".format(xOff,numLeafs,totalW,yOff,subPoint))

    #
    plotMidText(subPoint,parentPoint,nodeText,ax)


    plotNode(firstStr,
             subPoint,
             parentPoint,
             dict(boxstyle="sawtooth",fc="0.8"),
             ax)

    secondDict = currentTree[firstStr]

    # 按比例减少全局变量yOff
    yOff = yOff - 1.0/totalD
    for key in secondDict.keys():
        if type(secondDict[key]).__name__=="dict":
            plotTree(secondDict[key],subPoint,str(key),xOff,yOff,totalW,totalD,ax)
        else:
            xOff = xOff + 1.0/totalW
            plotNode(secondDict[key],
                     (xOff,yOff),
                     subPoint,
                     dict(boxstyle="round4",fc="0.8"),ax)
            plotMidText((xOff,yOff),subPoint,str(key),ax)

    # 绘制完所有子节点之后,增加全局变量yOff的偏移
    yOff = yOff + 1.0/totalD


def createPlot(inTree):
    '''
    树绘制的主程序,控制流程
    :param inTree: 输入的树内容
        \'\'\'
            [{'no surfacing': {0: 'no', 1: {'flippers': {0: 'no', 1: 'yes'}}}},
             {'no surfacing': {0: 'no',
               1: {'filppers': {0: {'head': {0: 'no', 1: 'yes'}}, 1: 'no'}}}}]
        \'\'\'
    :return:
    '''
    import matplotlib.pyplot as plt
    fig = plt.figure(num=1,facecolor="white")
    # fig.clf() 清空绘图区
    fig.clf()
    # 设置不显示 x,y坐标刻度
    axprops = dict(xticks=[],yticks=[])

    ax1 = plt.subplot(111,frameon=False,**axprops)
    # 获取原始树的总宽度
    totalW = getNumLeafs(inTree)
    # 获取原始树的总高度
    totalD = getTreeDepth(inTree)

    '''
    使用两个全局变量xOff和yOff追踪已经绘制的节点位置,以及放置下一个节点的恰当位置

    绘制图形的x轴有效范围是0.0到1.0,y轴有效范围也是0.0~1.0
    '''
    xOff = -0.5/totalW
    # 顶点的距离
    yOff = 1.0
    # 初始化文本内容
    nodeText = ''
    plotTree(inTree,(0.5,1.0),nodeText,xOff,yOff,totalW,totalD,ax1)
    plt.show()
# 测试数据
listOfTrees = [{"no surfacing":{0:"no",
             1:{"flippers":{0:"no",
                            1:"yes"}}}},
               {"no surfacing":{0:"no",
             1:{"filppers":{0:{"head":{0:"no",
                                       1:"yes"}},
                            1:"no"}}}}
             ]

createPlot(listOfTrees[0])
5. 验证构造的树是否正确
准备验证数据集:
listOfTrees = [{"no surfacing":{0:"no",
             1:{"flippers":{0:"no",
                            1:"yes"}}}},
               {"no surfacing":{0:"no",
             1:{"filppers":{0:{"head":{0:"no",
                                       1:"yes"}},
                            1:"no"}}}}
             ]

labels = ["no surfacing","flippers"]
编写验证函数:
def classify(inputTree,featureLabels,testVector):
    '''

    :param inputTree: 待验证的树结构 {'no surfacing': {0: 'no', 1: {'flippers': {0: 'no', 1: 'yes'}}}}
    :param featureLabels: 树结构的先验特征集 labels = ["no surfacing","flippers"]
    :param testVector: 单条先验特征集的值向量  [1,1]
    :return:
    '''
    firstStr = list(inputTree.keys())[0]
    secondDict = inputTree[firstStr]
    # 确定分类特征的位置
    featureIndex = featureLabels.index(firstStr)
    for key in secondDict.keys():
        if testVector[featureIndex] == key:
            if type(secondDict[key]).__name__ == "dict":
                classLabel_ = classify(secondDict[key],featureLabels,testVector)
            else:
                # 如果到达叶子节点,则返回当前节点的分类标签
                classLabel_ = secondDict[key]
    return classLabel_
画出listOfTrees[0]的树结构:
listOfTrees[0]
>>> {'no surfacing': {0: 'no', 1: {'flippers': {0: 'no', 1: 'yes'}}}}

createPlot(listOfTrees[0])
调用验证函数:
classify(listOfTrees[0],labels,[1,1])
输出: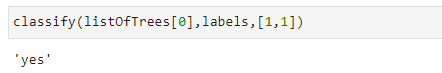
可以看到,如果 'no surfacing'=1,'flippers'=1,那就会被归类为 “yes”,而且绘制的树图形与此处代表树的数据结构完全相同。
6. 持久化树结构
可以预先提炼并存储数据集中包含的知识信息,在需要对事物进行分类时再使用这些知识。


【推荐】国内首个AI IDE,深度理解中文开发场景,立即下载体验Trae
【推荐】编程新体验,更懂你的AI,立即体验豆包MarsCode编程助手
【推荐】抖音旗下AI助手豆包,你的智能百科全书,全免费不限次数
【推荐】轻量又高性能的 SSH 工具 IShell:AI 加持,快人一步
· TypeScript + Deepseek 打造卜卦网站:技术与玄学的结合
· 阿里巴巴 QwQ-32B真的超越了 DeepSeek R-1吗?
· 【译】Visual Studio 中新的强大生产力特性
· 10年+ .NET Coder 心语 ── 封装的思维:从隐藏、稳定开始理解其本质意义
· 【设计模式】告别冗长if-else语句:使用策略模式优化代码结构
2021-04-11 Centos安装KDE