
排查Java进程CPU占用高之三板斧
写在前面
线上环境突然出现Java进程CPU占用率持续超过100%的问题,该如何排查并定位呢?
问题一:我们如何知道线上环境的那个服务器(或者哪个Docker容器)出现了CPU持续高的故障了呢?
如果是有比较完善的监控设施,当出现CPU持续高时可以通过发送报警通知的方式告知开发人员,如果没有监控通知,那只能通过用户侧感知了,比如操作响应慢,甚至出现了服务不可用的现象。
问题二:存在哪些可能的原因会导致Java进程的CPU占用率会持续高呢?
如果是突然出现的问题,可能是跟当时并发压力有关,比如用户访问量突然增多触发大量的TCP连接请求,也可能是触发了某个代码逻辑的BUG进入死循环等。根据经验,会引起Java进程CPU占用率持续高的原因可能有如下几个:
- 并发量突然增大引起TCP连接数陡增,Tomcat容器处理不过来
- 数据量猛然变大引起频繁Full GC,这个可以从GC日志可以看出来
- 如果打印日志非常多,也可能导致CPU持续高,当然这个原因一般不会突然才冒出来,在测试阶段就能感知了
既然存在多种可能的原因,那么在排查的时候就需要依次定位了。
线程堆栈
不论是何种原因引起的Java进程CPU占用率高问题,排查的入口都是先从线程堆栈信息入手。
可以查看Java线程堆栈信息的工具有:jstack命令,Arthas工具。
jstack命令
jstack命令是JDK自带的,在使用它查看进程堆栈之前先要找到具体的进程ID。
先通过top命令确定CPU占用高的Java进程ID,如下示例:
ubuntu@epic-doberman:~$ top
top - 15:49:15 up 30 min,  2 users,  load average: 0.86, 0.32, 0.12
Tasks: 122 total,   1 running, 121 sleeping,   0 stopped,   0 zombie
%Cpu(s): 25.3 us,  0.0 sy,  0.0 ni, 74.6 id,  0.0 wa,  0.0 hi,  0.2 si,  0.0 st
MiB Mem :   7925.5 total,   6999.9 free,    454.5 used,    711.5 buff/cache
MiB Swap:      0.0 total,      0.0 free,      0.0 used.   7470.9 avail Mem

    PID USER      PR  NI    VIRT    RES    SHR S  %CPU  %MEM     TIME+ COMMAND
   8632 ubuntu    20   0 4386476  28076  18604 S  99.7   0.3   1:56.00 java
      1 root      20   0   22708  13540   9444 S   0.0   0.2   0:02.23 systemd
      2 root      20   0       0      0      0 S   0.0   0.0   0:00.00 kthreadd
      3 root      20   0       0      0      0 S   0.0   0.0   0:00.00 pool_workqueue_release
      4 root       0 -20       0      0      0 I   0.0   0.0   0:00.00 kworker/R-rcu_g
      5 root       0 -20       0      0      0 I   0.0   0.0   0:00.00 kworker/R-rcu_p
      6 root       0 -20       0      0      0 I   0.0   0.0   0:00.00 kworker/R-slub_
      7 root       0 -20       0      0      0 I   0.0   0.0   0:00.00 kworker/R-netns
      9 root      20   0       0      0      0 I   0.0   0.0   0:00.31 kworker/0:1-events
     10 root       0 -20       0      0      0 I   0.0   0.0   0:00.00 kworker/0:0H-events_highpri
     12 root       0 -20       0      0      0 I   0.0   0.0   0:00.00 kworker/R-mm_pe
     13 root      20   0       0      0      0 I   0.0   0.0   0:00.00 rcu_tasks_kthread
如上,CPU占用高的进程ID为8632。..
接着,使用JDK自带的jstack命令导出进程堆栈文件。
$ jstack
Usage:
    jstack [-l] <pid>
        (to connect to running process)
    jstack -F [-m] [-l] <pid>
        (to connect to a hung process)
    jstack [-m] [-l] <executable> <core>
        (to connect to a core file)
    jstack [-m] [-l] [server_id@]<remote server IP or hostname>
        (to connect to a remote debug server)

Options:
    -F  to force a thread dump. Use when jstack <pid> does not respond (process is hung)
    -m  to print both java and native frames (mixed mode)
    -l  long listing. Prints additional information about locks
    -h or -help to print this help message
$ jstack 8632 > 8632.tdump
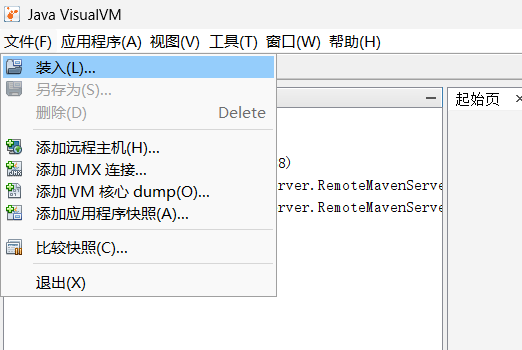
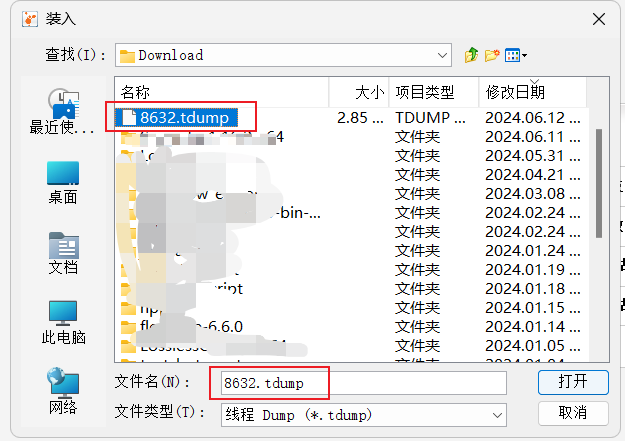
将进程8632的线程堆栈信息导出到文件8632.tdump之后,使用JDK自带的jvisualvm工具分析堆栈信息。
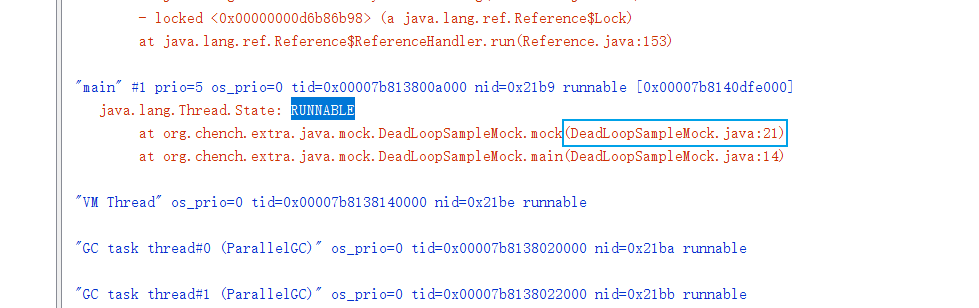
在线程堆栈文件中查找并分析状态为RUNNABLE的线程,结合代码进行分析,如果能直接确定出问题原因则修复代码即可。
对于使用jstack命令查看线程堆栈,可以结合shell脚本来实现快速查看,如下示例:
#!/bin/bash
# Desc: 查看Java进程CPU使用率高的线程堆栈信息
# Name: show_java_process_thread_stack.sh

echo "Show java process thread stack"
pid=$1
if [ ! "$pid" ]; then
	echo "Usage: sh $0 pid"
	echo "  e.g: sh $0 1234"
	echo ""
	exit 1
fi

top -H -p "$pid"|head -20
echo ""

top_thread_id=`top -H -p $pid|head -8|awk '/java/{print $2}'`
#echo "top cpu thread: $top_thread_id"

thread_id_hex=`printf "%x" "$top_thread_id"`
#echo "$thread_id_hex"
jstack "$pid"|grep "$thread_id_hex" -A 100 > jstack_tmp
cat jstack_tmp
rm -rf jstack_tmp

#echo "Done."
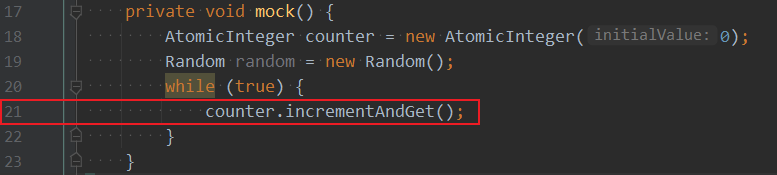
如果是代码死循环问题,通常在分析线程堆栈之后很快就能定位到具体的位置。
而倘若是因为大量用户请求引起的TCP连接数很多,此时在线程堆栈中也会有所体现,如下示例:
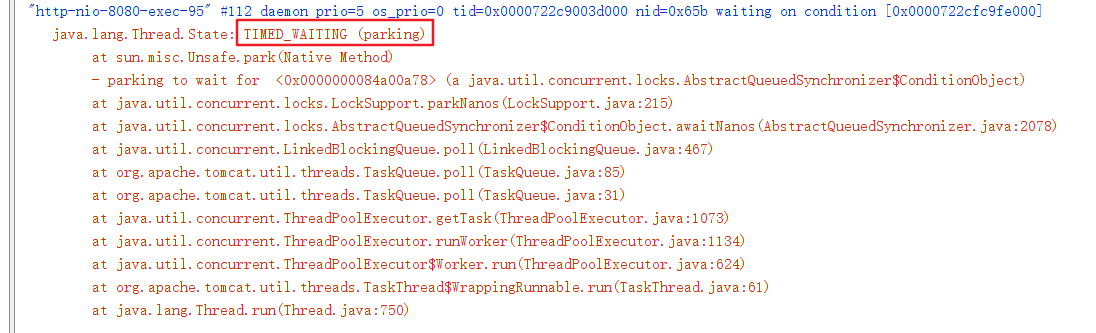
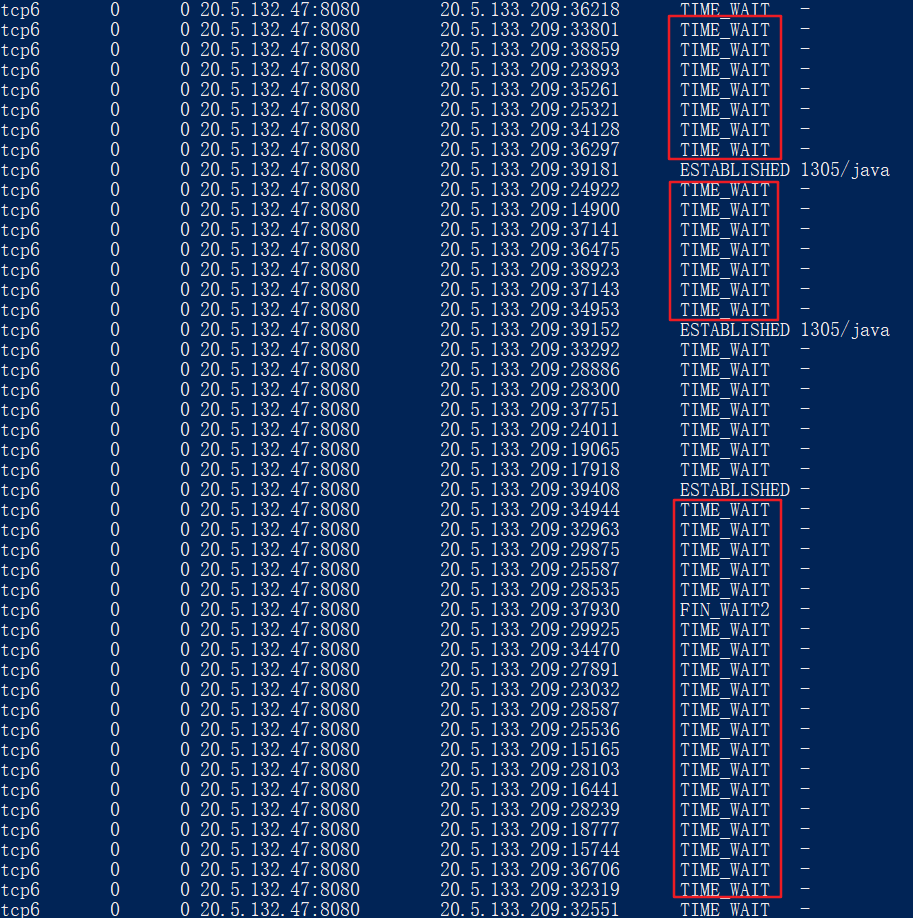
同时,再结合相关网络连接查看命令,也能大致确认(此时会存在大量TCP连接处于TIME_WAIT状态),参考查看linux中的TCP连接数。
$ sudo netstat -anpt
Arthas工具thread命令
使用Arthas排查查看线程堆栈信息非常方便,通过如下步骤使用arthas可以便捷地查看到线程堆栈信息,对于定位可能存在死循环的代码位置非常有帮助。
第一步:启动arthas
# 使用与目标进程相同的用户权限启动arthas
$ java -jar arthas-boot.jar
ubuntu@epic-doberman:~/Scripts$ java -jar arthas-boot.jar
[INFO] JAVA_HOME: /usr/lib/jvm/java-8-openjdk-amd64/jre
[INFO] arthas-boot version: 3.7.2
[INFO] Found existing java process, please choose one and input the serial number of the process, eg : 1. Then hit ENTER.
* [1]: 2730 test-java-util.jar
第二步:选择目标进程编号并回车
1
[INFO] arthas home: /home/ubuntu/.arthas/lib/3.7.2/arthas
[INFO] Try to attach process 2730
Picked up JAVA_TOOL_OPTIONS:
[INFO] Attach process 2730 success.
[INFO] arthas-client connect 127.0.0.1 3658
  ,---.  ,------. ,--------.,--.  ,--.  ,---.   ,---.
 /  O  \ |  .--. ''--.  .--'|  '--'  | /  O  \ '   .-'
|  .-.  ||  '--'.'   |  |   |  .--.  ||  .-.  |`.  `-.
|  | |  ||  |\  \    |  |   |  |  |  ||  | |  |.-'    |
`--' `--'`--' '--'   `--'   `--'  `--'`--' `--'`-----'

wiki       https://arthas.aliyun.com/doc
tutorials  https://arthas.aliyun.com/doc/arthas-tutorials.html
version    3.7.2
main_class
pid        2730
time       2024-06-13 16:24:38

[arthas@2730]$
第三步:执行dashboard命令找到CPU占用率高的线程ID
$ dashboard
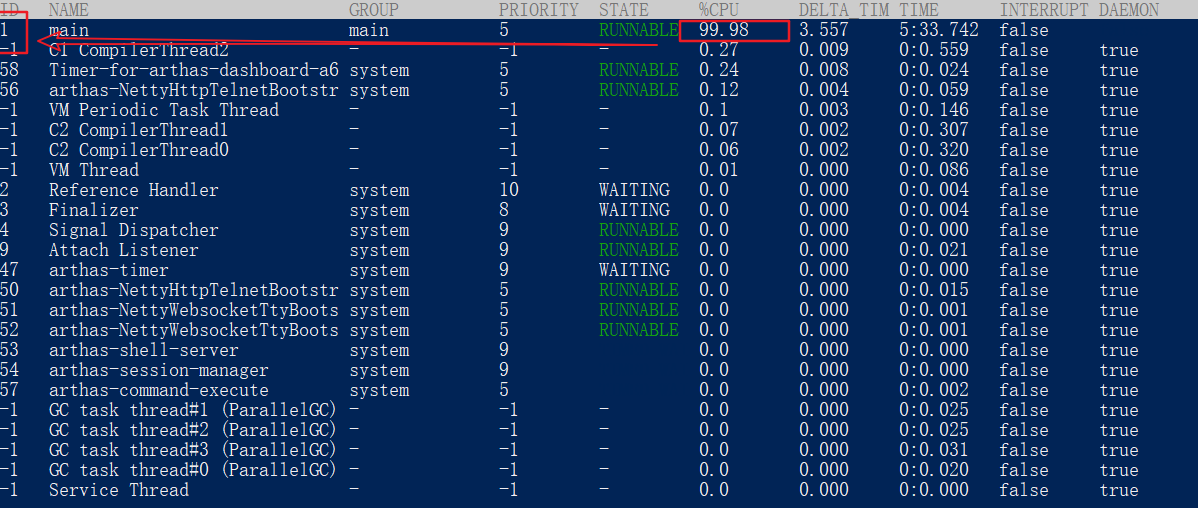
第四步:执行thread <线程ID>查看指定线程的堆栈信息
[arthas@2730]$ thread 1
"main" Id=1 RUNNABLE
    at org.chench.extra.java.mock.DeadLoopSampleMock.mock(DeadLoopSampleMock.java:20)
    at org.chench.extra.java.mock.DeadLoopSampleMock.main(DeadLoopSampleMock.java:14)
如果存在多个线程占用CPU都比较高的情况,可以直接执行thread -n <线程数量N>查看当前最忙的前N个线程并打印堆栈。
# 查看当前最繁忙的前3个线程堆栈,各线程堆栈信息之间通过2个空行分隔
$ thread -n 3
"main" Id=1 cpuUsage=99.96% deltaTime=204ms time=1835502ms RUNNABLE
    at org.chench.extra.java.mock.DeadLoopSampleMock.mock(DeadLoopSampleMock.java:20)
    at org.chench.extra.java.mock.DeadLoopSampleMock.main(DeadLoopSampleMock.java:14)


"C2 CompilerThread0" [Internal] cpuUsage=1.55% deltaTime=3ms time=823ms


"arthas-command-execute" Id=57 cpuUsage=0.12% deltaTime=0ms time=6ms RUNNABLE
    at sun.management.ThreadImpl.dumpThreads0(Native Method)
    at sun.management.ThreadImpl.getThreadInfo(ThreadImpl.java:461)
    at com.taobao.arthas.core.command.monitor200.ThreadCommand.processTopBusyThreads(ThreadCommand.java:206)
    at com.taobao.arthas.core.command.monitor200.ThreadCommand.process(ThreadCommand.java:122)
    at com.taobao.arthas.core.shell.command.impl.AnnotatedCommandImpl.process(AnnotatedCommandImpl.java:82)
    at com.taobao.arthas.core.shell.command.impl.AnnotatedCommandImpl.access$100(AnnotatedCommandImpl.java:18)
    at com.taobao.arthas.core.shell.command.impl.AnnotatedCommandImpl$ProcessHandler.handle(AnnotatedCommandImpl.java:111)
    at com.taobao.arthas.core.shell.command.impl.AnnotatedCommandImpl$ProcessHandler.handle(AnnotatedCommandImpl.java:108)
    at com.taobao.arthas.core.shell.system.impl.ProcessImpl$CommandProcessTask.run(ProcessImpl.java:385)
    at java.util.concurrent.Executors$RunnableAdapter.call(Executors.java:511)
    at java.util.concurrent.FutureTask.run(FutureTask.java:266)
    at java.util.concurrent.ScheduledThreadPoolExecutor$ScheduledFutureTask.access$201(ScheduledThreadPoolExecutor.java:180)
    at java.util.concurrent.ScheduledThreadPoolExecutor$ScheduledFutureTask.run(ScheduledThreadPoolExecutor.java:293)
    at java.util.concurrent.ThreadPoolExecutor.runWorker(ThreadPoolExecutor.java:1149)
    at java.util.concurrent.ThreadPoolExecutor$Worker.run(ThreadPoolExecutor.java:624)
    at java.lang.Thread.run(Thread.java:750)
GC日志
当线上应用因为堆内存空间不足而引起频繁Full GC时,同样会导致CPU占用持续高的问题。如果经过排查线程堆栈信息无法定位到具体的原因,就要转换思路,需要定位是否出现了Full GC。
在排查是否出现了频繁Full GC问题时,可以从2个方面入手:GC日志,JVM内存信息。
查看GC日志有多种方式,可以使用JDK自带的jstat命令查看实时的GC信息,也可以在启动参数中指定输出GC日志到到文件中。
jstat命令查看GC概要
使用jstat命令可以试试查看JVM堆内存状态以及GC信息,命令语法为:jstat -gcutil <进程ID> <刷新频率,单位:毫秒>,如下示例:
$ jstat -gcutil 34444 1000
  S0     S1     E      O      M     CCS    YGC     YGCT    FGC    FGCT     GCT
  0.00  34.38  13.91  53.31  93.42  86.18    427    0.770     5    0.348    1.119
  0.00  34.38  13.91  53.31  93.42  86.18    427    0.770     5    0.348    1.119
  0.00  34.38  13.91  53.31  93.42  86.18    427    0.770     5    0.348    1.119
  0.00  34.38  33.96  53.31  93.42  86.18    427    0.770     5    0.348    1.119
  0.00  34.38  33.96  53.31  93.42  86.18    427    0.770     5    0.348    1.119
  0.00  34.38  33.96  53.31  93.42  86.18    427    0.770     5    0.348    1.119
输出参数含义:
-
S0: 新生代中Survivor space 0区已使用空间的百分比
-
S1: 新生代中Survivor space 1区已使用空间的百分比
-
E: 新生代已使用空间的百分比
-
O: 老年代已使用空间的百分比
-
M: 元空间已使用空间的百分比
-
CCS: Compressed class space utilization as a percentage
-
YGC: 从应用程序启动到当前,发生Yang GC 的次数
-
YGCT: 从应用程序启动到当前,Yang GC所用的时间(单位:秒)
-
FGC: 从应用程序启动到当前,发生Full GC的次数
-
FGCT: 从应用程序启动到当前,Full GC所用的时间
-
GCT: 从应用程序启动到当前,用于垃圾回收的总时间(单位:秒)
GC日志文件
使用JDK自带的jstat命令只能查看GC的概要信息,如果希望知道更加具体的GC细节,应该在应用启动参数中指定生成gc.log日志文件。
参数格式为:-Xloggc:/tmp/gc.log -XX:+PrintGCDetails -XX:+PrintGCDateStamps,相关参数含义如下:
- -Xloggc:/tmp/gc.log 日志文件的输出路径
- -XX:+PrintGC 输出GC日志
- -XX:+PrintGCDetails 输出GC的详细日志
- -XX:+PrintGCTimeStamps 输出GC的时间戳(以基准时间的形式)
- -XX:+PrintGCDateStamps 输出GC的时间戳(以日期的形式,如
2013-05-04T21:53:59.234+0800) - -XX:+PrintHeapAtGC 在进行GC的前后打印出堆的信息
如果是因为出现频繁Full GC导致的CPU占用高,那么在gc日志文件中将可以看到打印如下Full GC日志:
2024-06-14T11:02:52.151+0800: 613.966: [Full GC (Ergonomics) [PSYoungGen: 3584K->3583K(7168K)] [ParOldGen: 22009K->22009K(22016K)] 25593K->25593K(29184K), [Metaspace: 13892K->13892K(1071104K)], 0.0376547 secs] [Times: user=0.13 sys=0.00, real=0.04 secs]
2024-06-14T11:02:52.189+0800: 614.004: [Full GC (Ergonomics) [PSYoungGen: 3583K->3583K(7168K)] [ParOldGen: 22009K->22008K(22016K)] 25593K->25592K(29184K), [Metaspace: 13892K->13892K(1071104K)], 0.0419170 secs] [Times: user=0.15 sys=0.00, real=0.04 secs]
2024-06-14T11:02:52.231+0800: 614.046: [Full GC (Ergonomics) [PSYoungGen: 3584K->3583K(7168K)] [ParOldGen: 22008K->22008K(22016K)] 25592K->25592K(29184K), [Metaspace: 13892K->13892K(1071104K)], 0.0453520 secs] [Times: user=0.15 sys=0.00, real=0.05 secs]
2024-06-14T11:02:52.276+0800: 614.091: [Full GC (Ergonomics) [PSYoungGen: 3584K->3583K(7168K)] [ParOldGen: 22008K->22008K(22016K)] 25592K->25592K(29184K), [Metaspace: 13892K->13892K(1071104K)], 0.0397477 secs] [Times: user=0.14 sys=0.00, real=0.04 secs]
2024-06-14T11:02:52.316+0800: 614.131: [Full GC (Ergonomics) [PSYoungGen: 3584K->3584K(7168K)] [ParOldGen: 22008K->22008K(22016K)] 25592K->25592K(29184K), [Metaspace: 13892K->13892K(1071104K)], 0.0336829 secs] [Times: user=0.11 sys=0.00, real=0.03 secs]
内存dump
Arthas工具memory命令
还可以通过Arthas诊断工具的memory命令查看JVM内存信息。
$ memory
Memory                                             used              total            max              usage
heap                                               77M               136M             1762M            4.43%
ps_eden_space                                      20M               42M              626M             3.23%
ps_survivor_space                                  5M                17M              17M              30.53%
ps_old_gen                                         52M               77M              1321M            3.98%
nonheap                                            65M               66M              -1               98.30%
code_cache                                         10M               10M              240M             4.17%
metaspace                                          49M               50M              -1               98.26%
compressed_class_space                             6M                6M               1024M            0.63%
direct                                             0K                0K               -                0.00%
mapped                                             0K                0K               -                0.00%
堆内存dump文件
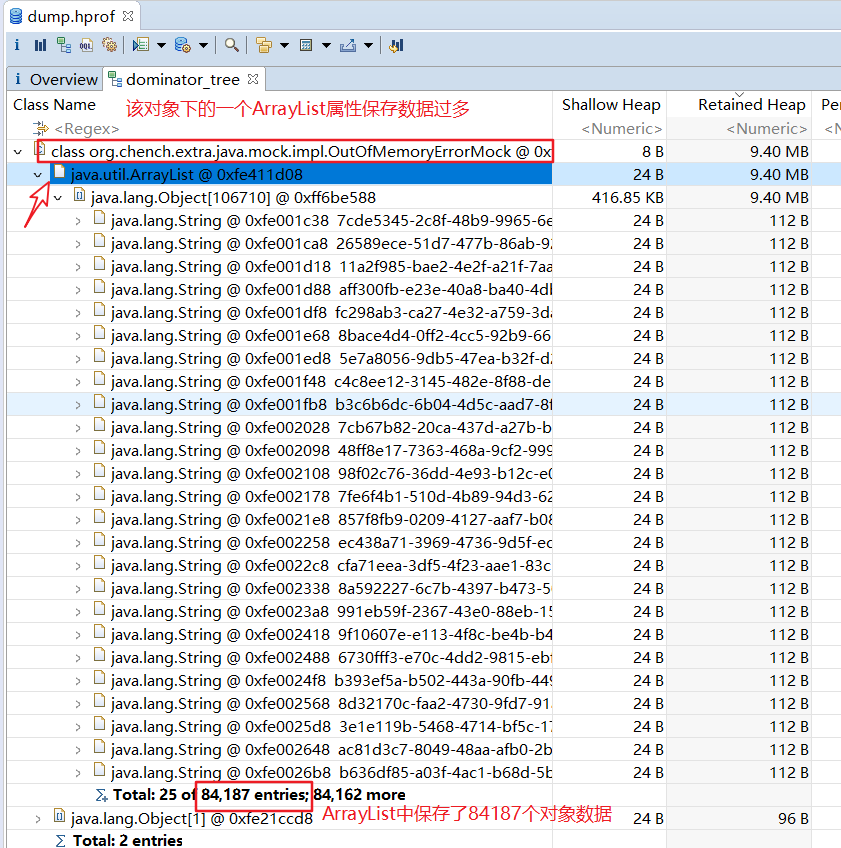
不论使用JDK自带的jstat命令还是使用Arthas工具的memory命令,都只能查看到JVM堆内存的概要信息,并不利于排查和定位代码问题。如果是因为堆内存空间不足导致OutOfMemoryError报错,定位问题最好的办法是生成堆内存dump文件,然后再使用MAT工具进行分析,找到问题的根本原因并解决。
生成堆dump文件至少有三种方式:
其一:在启动参数中指定生成dump文件的时机和路径,如:-XX:+HeapDumpOnOutOfMemoryError -XX:HeapDumpPath=/tmp/headpdump.hprof
其二:使用JDk自带的jmap命令导出指定Java进程的堆内存dump文件,如:jmap -dump:file=/tmp/dump.hprof <进程ID>
其三:使用Arthas工具的heapdump命令将当前堆内存快照保存到文件中,如:heapdump /tmp/dump.hprof
第一种方式只有在Java进程出现OutOfMemoryError报错之后才会生成dump文件,而通过JDK提供的jmap命令或Arthas工具的heapdump命令方式可以随时生成堆dump文件,特别是出现频繁Full GC的时候导出堆内存dump文件非常有利于定位和解决问题。
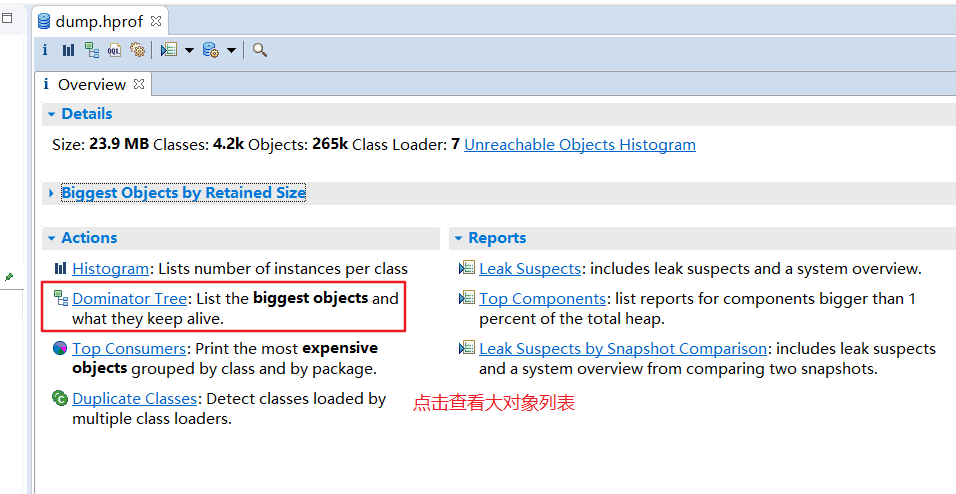
此外,在使用MAT工具分析堆内存dump文件时,首先要关注的就是大对象有哪些。
最后总结
排查Java进程CPU占用高的问题,基本思路如下:
首先,从线程堆栈入手,排查可能存在的代码死循环问题,可用的工具:JDK自带的jstack命令,Arthas工具的thread命令。
其次,如果线程堆栈中定位不到具体的原因,再去看看gc日志是否出现了频繁Full GC的问题,可用的工具:JDK自带的jstat命令,Arthas工具的memory命令。
最后,如果出现了频繁Full GC的问题,则使用JDK自带的jmap命令或者Arthas工具的heapdump命令导出堆内存文件,使用MAT工具进行分析和定位代码问题。
另外,为了方便线上排查问题,应该将相关的工具一起打到操作系统镜像中,这样在遇到线上故障时就不会手忙脚乱了。
附
jstack命令用法
$ jstack -help
Usage:
    jstack [-l] <pid>
        (to connect to running process)
    jstack -F [-m] [-l] <pid>
        (to connect to a hung process)
    jstack [-m] [-l] <executable> <core>
        (to connect to a core file)
    jstack [-m] [-l] [server_id@]<remote server IP or hostname>
        (to connect to a remote debug server)

Options:
    -F  to force a thread dump. Use when jstack <pid> does not respond (process is hung)
    -m  to print both java and native frames (mixed mode)
    -l  long listing. Prints additional information about locks
    -h or -help to print this help message
jstat命令用法
$ jstat -help
Usage: jstat -help|-options
       jstat -<option> [-t] [-h<lines>] <vmid> [<interval> [<count>]]

Definitions:
  <option>      An option reported by the -options option
  <vmid>        Virtual Machine Identifier. A vmid takes the following form:
                     <lvmid>[@<hostname>[:<port>]]
                Where <lvmid> is the local vm identifier for the target
                Java virtual machine, typically a process id; <hostname> is
                the name of the host running the target Java virtual machine;
                and <port> is the port number for the rmiregistry on the
                target host. See the jvmstat documentation for a more complete
                description of the Virtual Machine Identifier.
  <lines>       Number of samples between header lines.
  <interval>    Sampling interval. The following forms are allowed:
                    <n>["ms"|"s"]
                Where <n> is an integer and the suffix specifies the units as
                milliseconds("ms") or seconds("s"). The default units are "ms".
  <count>       Number of samples to take before terminating.
  -J<flag>      Pass <flag> directly to the runtime system.
jmap命令用法
$ jmap -help
Usage:
    jmap [option] <pid>
        (to connect to running process)
    jmap [option] <executable <core>
        (to connect to a core file)
    jmap [option] [server_id@]<remote server IP or hostname>
        (to connect to remote debug server)

where <option> is one of:
    <none>               to print same info as Solaris pmap
    -heap                to print java heap summary
    -histo[:live]        to print histogram of java object heap; if the "live"
                         suboption is specified, only count live objects
    -clstats             to print class loader statistics
    -finalizerinfo       to print information on objects awaiting finalization
    -dump:<dump-options> to dump java heap in hprof binary format
                         dump-options:
                           live         dump only live objects; if not specified,
                                        all objects in the heap are dumped.
                           format=b     binary format
                           file=<file>  dump heap to <file>
                         Example: jmap -dump:live,format=b,file=heap.bin <pid>
    -F                   force. Use with -dump:<dump-options> <pid> or -histo
                         to force a heap dump or histogram when <pid> does not
                         respond. The "live" suboption is not supported
                         in this mode.
    -h | -help           to print this help message
    -J<flag>             to pass <flag> directly to the runtime system
【参考】
GC日志生成-Xloggc,GC情况实时查看命令jstat
java 七 如何查看 GC 日志
jstat命令详解---JVM的统计监测工具
作者:编程随笔
出处:http://www.cnblogs.com/nuccch/
声明:本文版权归作者和博客园共有,欢迎转载,但请在文章页面明显位置给出原文连接。

 浙公网安备 33010602011771号