matplotlib 直方图绘制详解
n, bins, patches = plt.hist(datasets, bins, normed=False, facecolor=None, alpha=None)
函数说明
用于绘制多个数据集datasets的直方图
主要形参:
- datasets: 数据集列表, datasets中各个数据集的长度可以不等, 也可以传入numpy中的 2-D ndarray
- bins: 直方图中箱子(bin)的个数
- facecolor: 箱子的颜色
- alpha: 箱子的透明度
- normed: 决定直方图
y轴取值是落在某个箱子中的元素的个数(normed=False或normed=0),
还是某个箱子中的元素的个数占总体的百分比(normed=True或normed=1)
函数返回值: 返回值为一个元组(tuple)
- n: 直方图中 数据x落在 某个箱子里元素个数(或者占比)组成的数组
- bins: 直方图中 箱子取值(可能是落在该区间的x的均值)组成的数组
- patches: 是一个封装了 p 和 n信息的列表的集合(Patch对象)
例子
import numpy as np
import matplotlib.pyplot as plt

# Fixing random state for reproducibility
# np.random.randn 这个函数的作用就是从标准正态分布中返回一个或多个样本值
# seed(): 设置种子是为了输出图形具有可重复性
np.random.seed(20170617)
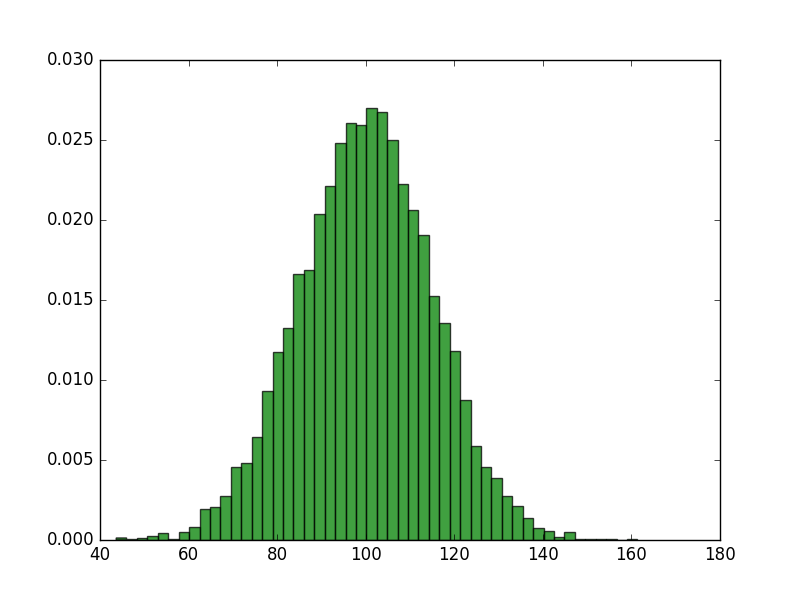
mu, sigma = 100, 15
x = mu + sigma * np.random.randn(10000)
p, bins, patches = plt.hist(x, 50, normed=True, facecolor='g', alpha=0.75)
 

改变形参 bins, facecolor, normed
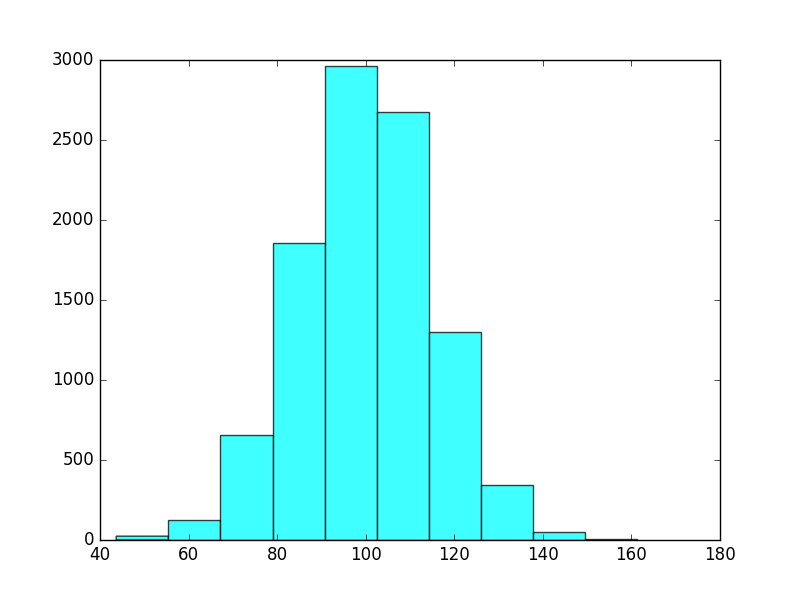
设置 bins=10, facecolor=cyan, normed=0
通过下图可以看到 箱子个数, 颜色, 以及 y轴的变化
p, bins, patches = plt.hist(x, 10, normed=0, facecolor='cyan', alpha=0.75)
 

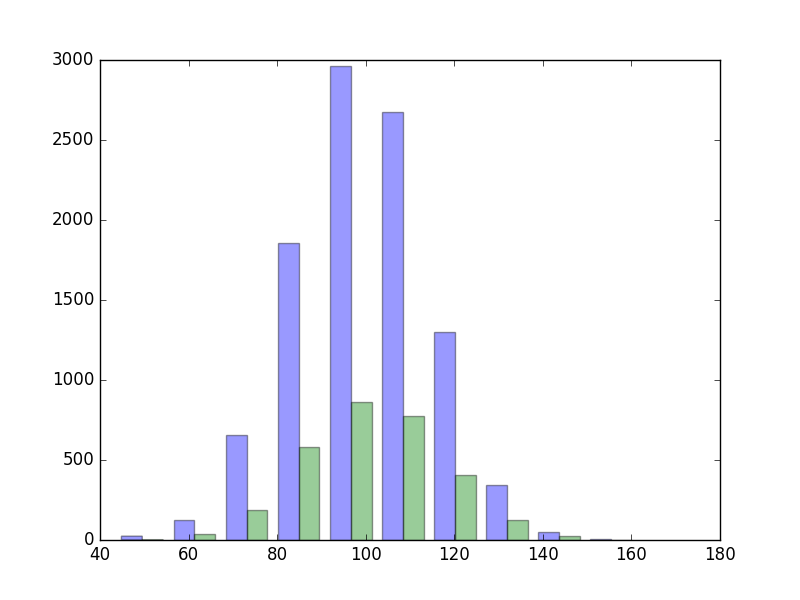
datasets为多个一维数据集
import numpy as np
import matplotlib.pyplot as plt

np.random.seed(20170617)
mu, sigma = 100, 15
x1 = mu + sigma * np.random.randn(10000)

np.random.seed(20160617)
x2 = mu + sigma * np.random.randn(3000)
p, bins, patches = plt.hist((x1,x2), 10, normed=0, alpha=0.4)
 

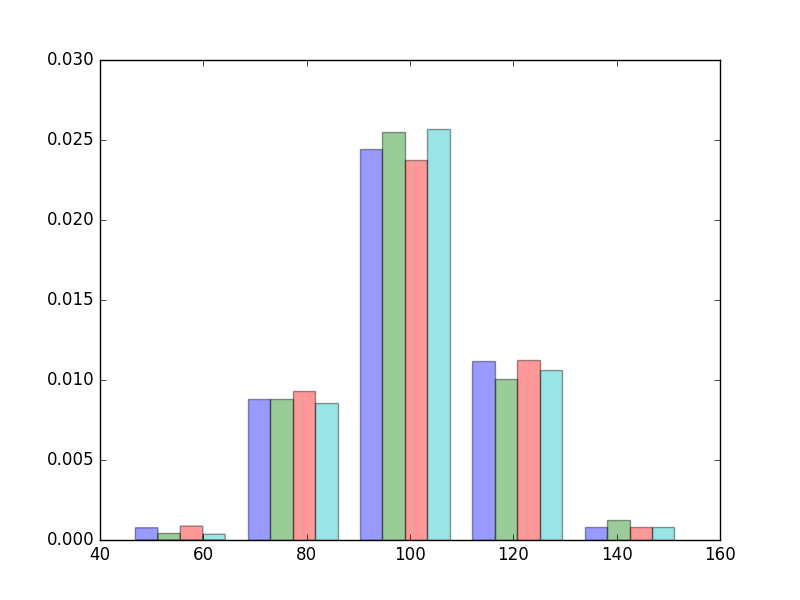
datasets 为 2D-ndarray
import numpy as np
import matplotlib.pyplot as plt

np.random.seed(20170617)
mu, sigma = 100, 15
t = np.random.randn(3600)
t.shape = (900, 4)
x = mu + sigma * t

p, bins, patches = plt.hist(x, 5, normed=10, alpha=0.4)


 matplotlib 直方图绘制详解

 浙公网安备 33010602011771号