
报告内容
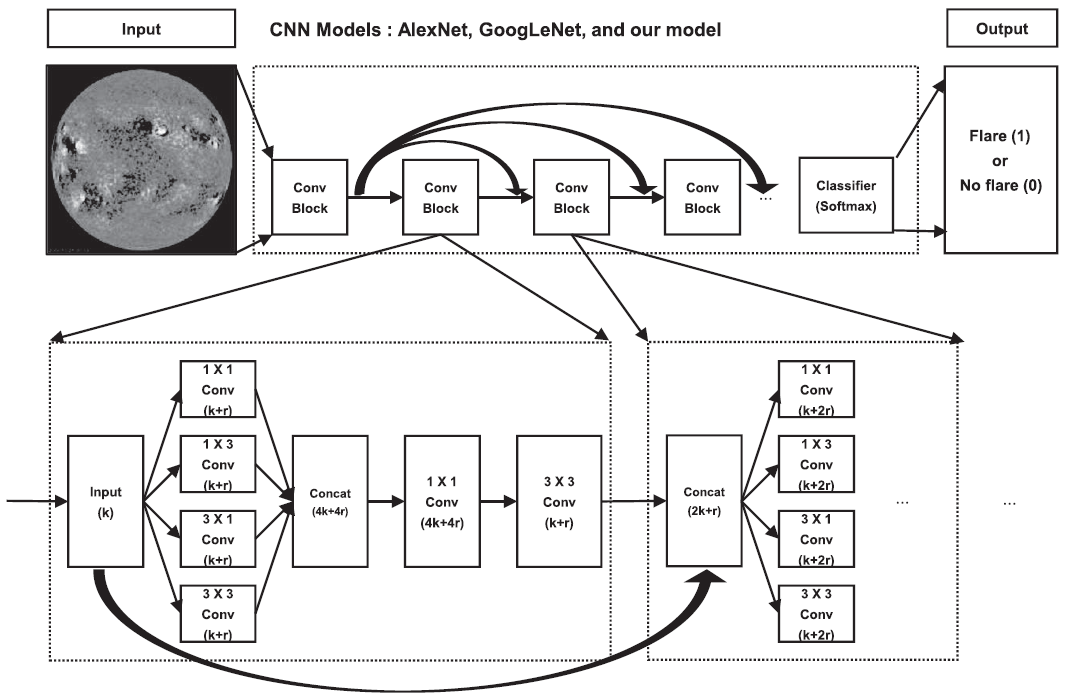
Park et.al :Application of the Deep Convolutional Neural Network to the Forecast of Solar Flare Occurrence Using Full-disk Solar Magnetograms
https://doi.org/10.3847/1538-4357/aaed40
METHODS
data sets:
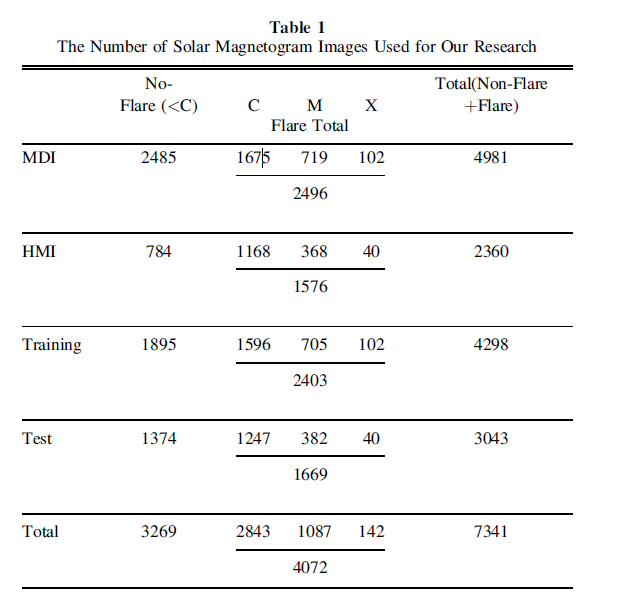
input data: We select full-disk line-ofsight SOHO/MDI magnetograms from 1996 May to 2010 December for every 00:00 UT and those of SDO/HMI from 2011 January to 2017 June.
Output data : Model outputs are the “Yes or No” of daily flare occurrence and they are compared with GOES observations(X-ray flare :for No-flare(weaker than C 1.0),Flare: (otherwise)).
Train data: We train the models using the input data and observations from 1996 to 2008, covering the entire solar cycle 23
Test data: test them using the data sets from 2009 to 2017, covering solar cycle 24.
Traing: In the step of the training, we use magnetograms that are labeled by the flare occurrence (Yes or No) according to GOES X-ray peak flux. (HOW? 如何标记的呢,一个图片里不应该有多个solar flare耀斑吗,那怎么判断和定位的呢)
由于HMI替代了MDI,作者计算了两个航天器检测图片的相关性,(how?),得到可以将两者看作一个整体。
最后采用了k折交叉验证(k-fold cross-validation)结果更优,以此证明了模型的稳定性?(why)
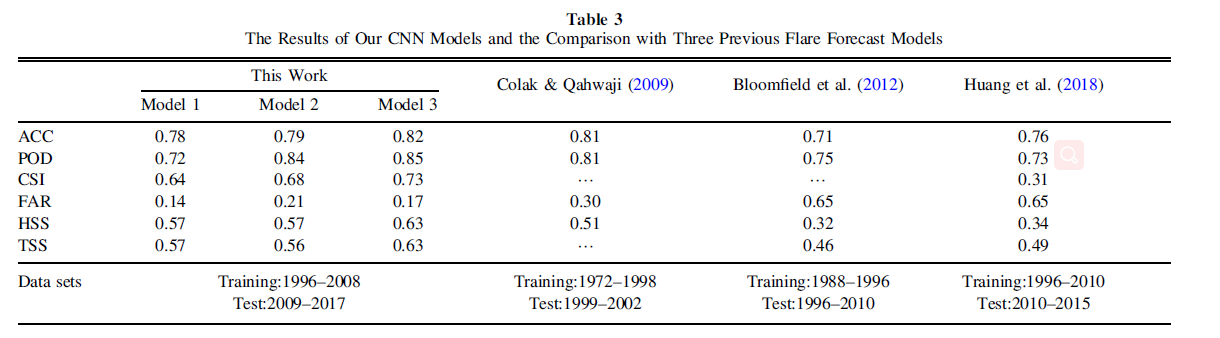
后期详细了解 Table3,!!!看他们的输入,输出数据,以及如何将label和对应图片配套的!!!
想把这个程序给实现了(初步大胆想法)
-----------------------------------------------------------------------------------------------------------------------------------------------------------------------------------------------------------------------------------------------------------------------------------------------
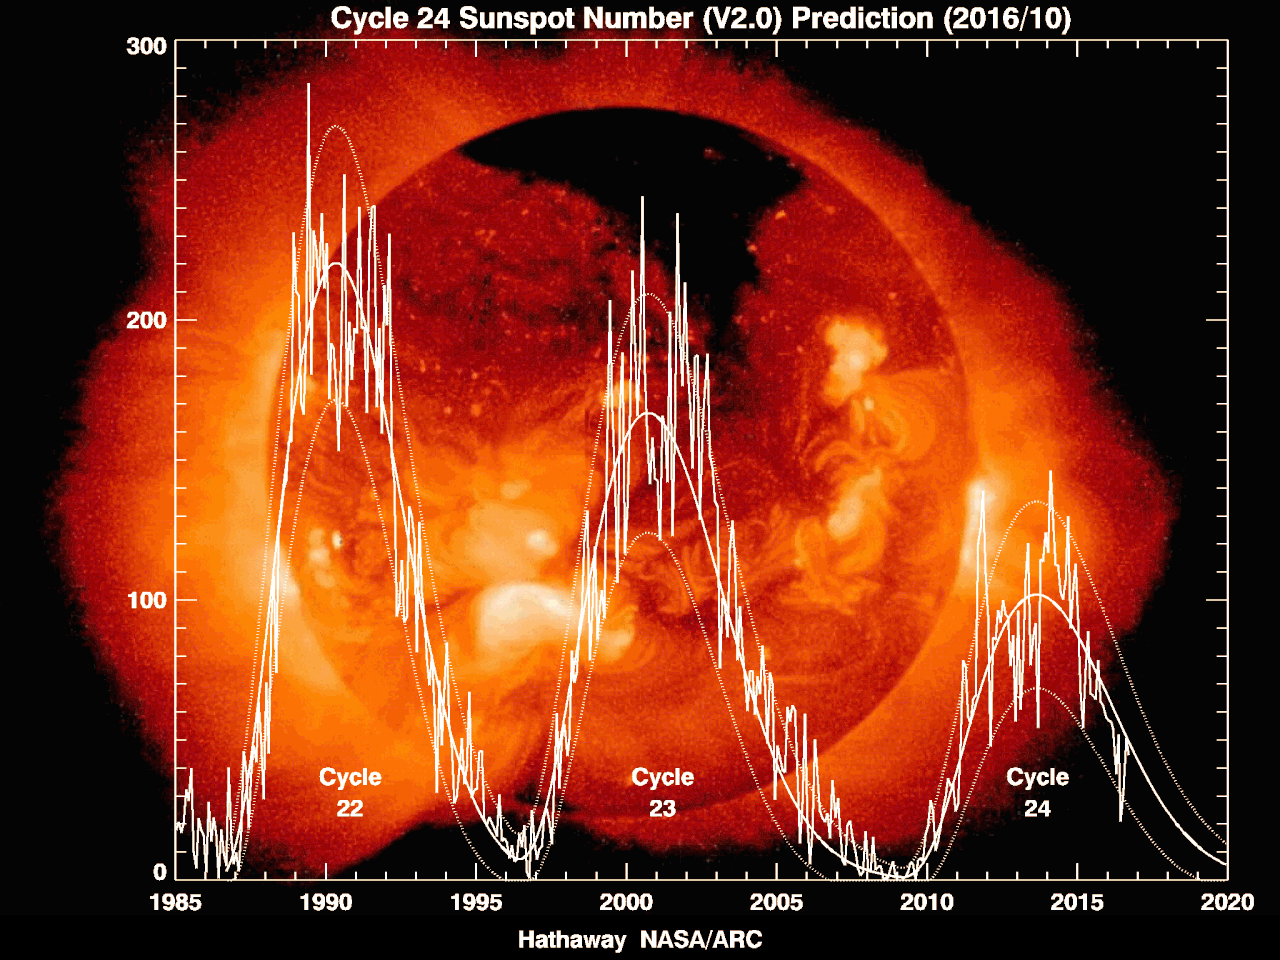
SOLAR CYCLE:The solar cycle or solar magnetic activity cycle is a nearly periodic 11-year change in the Sun's activity measured in terms of variations in the number of observed sunspots on the solar surface.
from : https://solarscience.msfc.nasa.gov/predict.shtml
------------------------------------------------------------------------------------------------------------------------------------------------------------------------------------------------------------------------------------------------------------------------------------------
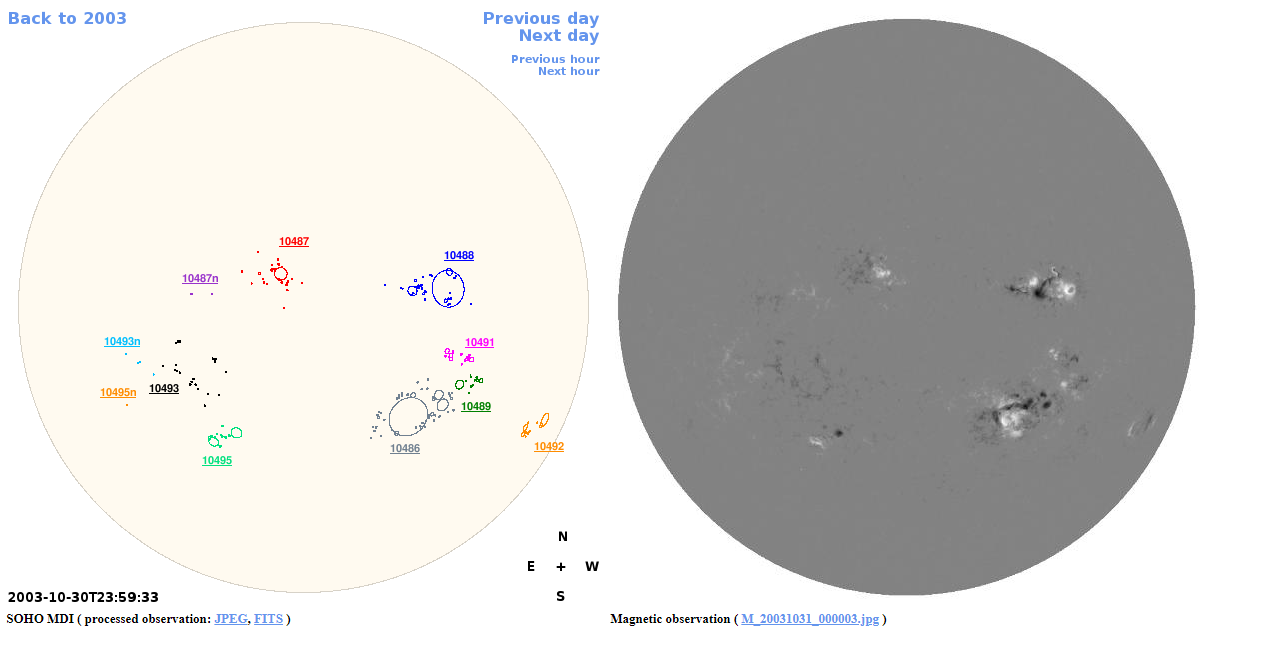
SOHO/MDI data
magnetic observation magnetograms (data sets in the paper)
add: http://fenyi.solarobs.csfk.mta.hu/en/databases/SOHO/

-------------------------------------------------------------------------------------------------------------------------------------------------------------------------------------------------------------------------
from http://jsoc.stanford.edu/doc/exports/tour.pdf
SOHO 是 European Space Agency & NASA 合办项目(joint project), for helioseismic and magnetic field observation of the Sun 太阳地震和磁场观测。
SDO/HMI
SDO web link: http://sdo.gsfc.nasa.gov
HMI web link: http://hmi.stanford.edu
HMI/AIA JSOC data center web link: http://jsoc.stanford.edu
-------------------------------------------------------------------------------------------------------------------------------------------------------------------------------------
http://jsoc.stanford.edu/new/
介绍了HMI,AIA,MDI,SHA,IRIS,SID的含义
------------------------------------------------------------------------------------------------------------------------------------------------------------------------------------------------------------------------------------------------------------------------------------------
------------------------------------------------------------------------------------------------------------------------------------------------------------------------------------------------------------------------------------------------------------------------------------------
Paper 2: Automatic analysis of magnetograms for identification and classification of active regions using Deep Learning
这篇论文是一篇不错的模板以及集齐了大量的素材,值得深挖
Active regions (ARs)
Active regions on the Sun are places where the Sun's magnetic field is disturbed. These regions frequently spawn various types of solar activity, including explosive "solar storms" such as solar flares and coronal mass ejections (CME).
-----------------------------------------------------------------------------------------------------------------------------------------------------------------------------------------------------------------------------------------------------------------------------------------------------------------------------------------------------------------
Magnetograms
A magnetogram is a graphical representation of the variation of the Sun’s magnetic field. It is an image formed from a set of magnetic data obtained from a magnetometer.

Notice that, in Fig. 1 three types of colors occur: white spots appear, which represent regions with positive polarities or that move against the Sun’s core; black spots representing negative polarities or that move toward the Sun’s core; and other gray areas. A group of spots forms an active region, which, in turn, is related to the occurrence of solar flares.
This situation occurs because, between spots of different polarities, magnetic arcs can arise, which, when broken, cause solar flares and, eventually, coronal mass ejections.

上图为磁力线(magnetic field lines),磁弧(magnetic arcs)
根据黑子的组成,可将magnetic 分为 8 类(Mt. Wilson classfication)

-------------------------------------------------------------------------------------------------------------------------------------------------------------------------------------------------------------------------
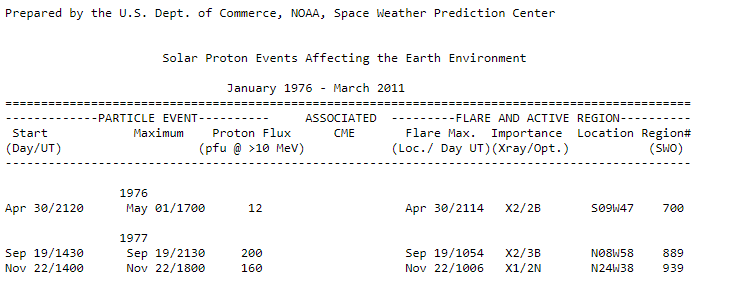
from: https://www.ngdc.noaa.gov/stp/satellite/goes/doc/SPE.txt
这个是flare的定位吗?
-------------------------------------------------------------------------------------------------------------------------------------------------------------------------------------------------------------------------
Method
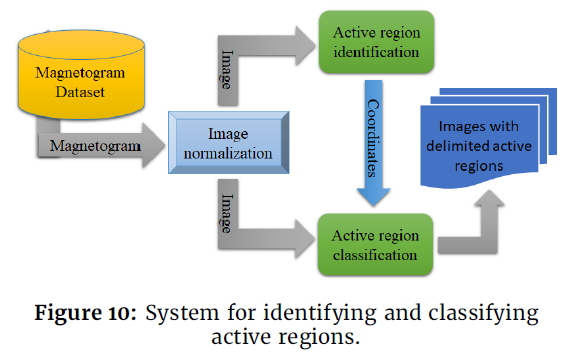

使用了 GoogLeNet 和 DetectNet(在DIGITS(NVIDIA Deep Learning GPU Training System)),
----------------------------------------
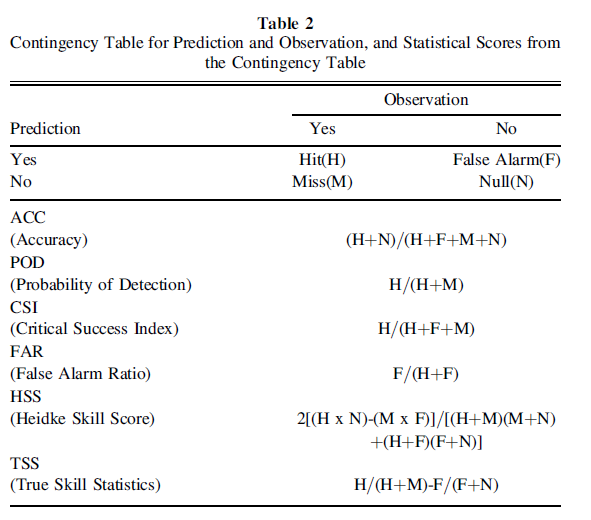
metrics:评价指标:
accuracy for both classification and object detection and Recall, mAP, and F1 score for object detection only.
---------------------------------------------------------------------------------------------------------------------------------------------------------------------------------
数据来源:
https://helioviewer.org/#

-------------------------------------------------------------------------------------------------------------------------------------------------------------------------------------

 浙公网安备 33010602011771号