前言
原文来源:这里!
数据集:根据不同人的数据来判断他有没有可能再次偿还信用借款(Home credit default risk)
看完的感想是:
- 每个不同的数据集的数据都是不一样的,背后表现的现象也是有差异。
- 但是还是有处理数据的规律和套路可以值得学习的。
- 本文是特征工程处理的第一章,提供了一些简单的方法来新建特征数据,之后还有2章讲述新的方法
原文的工作流程:outline of a machine learning project
- 理解问题,数据背景(understand the problem and the data)
- 数据清理和格式清理(data cleaning and formatting)
- EDA研究数据
- 使用数据建立最简单的模型(baseline model) ----> 线性回归line regression比如说(得到最低的acc,然后之后都要在这个基础上改进,不能比这个还差)
- 改进模型(improved model)----> 使用特征工程改进的数据或者使用新的模型
- 对于模型进行基本解释(model interpretaion) ---> 为啥比baseline好等等的总结
特征工程feature engineering
- 下面列举本文新建特征数据的几个方法,本文新建的角度有两种:
-
- 从统计学的角度
-
- 从应用场景的背景知识来的角度(domain knowledge)
-
- 本文还强调了kaggle的关键也就是特征工程,好的特征可以比起HP Tuning和模型选择更能促进gradient boosting,从而获得高acc。
- 特征工程是:
- 新建特征
- 选择重要特征(删除其他不需要的特征):从而reduce dimentionality的集合
统计学的角度
- 多项式特征
我们本来有['EXT_SOURCE_1', 'EXT_SOURCE_2', 'EXT_SOURCE_3', 'DAYS_BIRTH']这些特征,然后我们可以将他们两两组合(degree=2)变成下面的特征组合。
['1',
 'EXT_SOURCE_1',
 'EXT_SOURCE_2',
 'EXT_SOURCE_3',
 'DAYS_BIRTH',
 'EXT_SOURCE_1^2',
 'EXT_SOURCE_1 EXT_SOURCE_2',
 'EXT_SOURCE_1 EXT_SOURCE_3',
 'EXT_SOURCE_1 DAYS_BIRTH',
 'EXT_SOURCE_2^2',
 'EXT_SOURCE_2 EXT_SOURCE_3',
 'EXT_SOURCE_2 DAYS_BIRTH',
 'EXT_SOURCE_3^2',
 'EXT_SOURCE_3 DAYS_BIRTH',
 'DAYS_BIRTH^2']
实现方法:
from sklearn.preprocessing import PolynomialFeatures

# Make a new dataframe for polynomial features
poly_features = app_train[['EXT_SOURCE_1', 'EXT_SOURCE_2', 'EXT_SOURCE_3', 'DAYS_BIRTH', 'TARGET']]

# Create the polynomial object with specified degree
poly_transformer = PolynomialFeatures(degree = 3)
# Train the polynomial features
poly_transformer.fit(poly_features)

# Transform the features
poly_features = poly_transformer.transform(poly_features)
注:对于poly的新特征有必要用scaler来调整一些参数取值范围(原文用了minmaxscaler)
从经济学的角度(domain knowledge)
CREDIT_INCOME_PERCENT: 借贷与收入比 the percentage of the credit amount relative to a client's income
ANNUITY_INCOME_PERCENT: 贷款年金和收入比the percentage of the loan annuity relative to a client's income
CREDIT_TERM: 连续还款月长度 the length of the payment in months (since the annuity is the monthly amount due
DAYS_EMPLOYED_PERCENT: 受雇佣天数与年龄比the percentage of the days employed relative to the client's age
实现方式
app_train_domain['CREDIT_INCOME_PERCENT'] = app_train_domain['AMT_CREDIT'] / app_train_domain['AMT_INCOME_TOTAL']
app_train_domain['ANNUITY_INCOME_PERCENT'] = app_train_domain['AMT_ANNUITY'] / app_train_domain['AMT_INCOME_TOTAL']
app_train_domain['CREDIT_TERM'] = app_train_domain['AMT_ANNUITY'] / app_train_domain['AMT_CREDIT']
app_train_domain['DAYS_EMPLOYED_PERCENT'] = app_train_domain['DAYS_EMPLOYED'] / app_train_domain['DAYS_BIRTH']
其他
除了重点是特征工程以外,本文还提供了一些新的画图/处理数据的方法,这里简单总结一下
1.画图
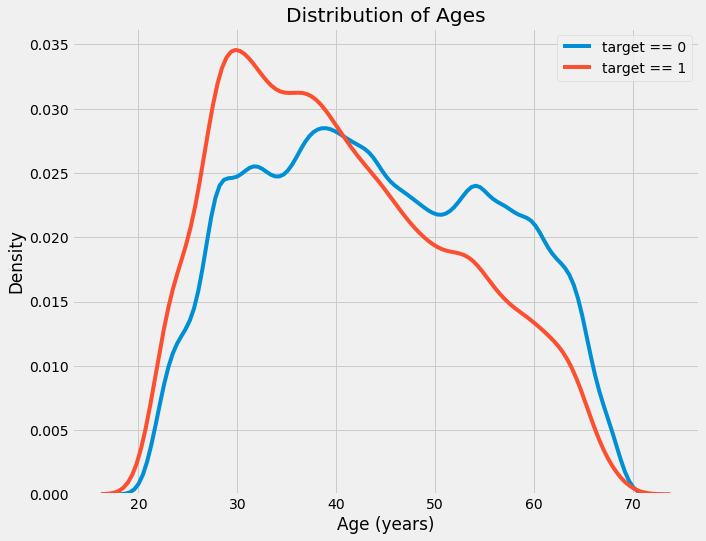
- sns.kdeplot: 内核密度函数kernel density estimation
也就是之前sns.distplot之后hist的拟合曲线?
plt.figure(figsize = (10, 8))

# KDE plot of loans that were repaid on time
sns.kdeplot(app_train.loc[app_train['TARGET'] == 0, 'DAYS_BIRTH'] / 365, label = 'target == 0')

# KDE plot of loans which were not repaid on time
sns.kdeplot(app_train.loc[app_train['TARGET'] == 1, 'DAYS_BIRTH'] / 365, label = 'target == 1')

# Labeling of plot
plt.xlabel('Age (years)'); plt.ylabel('Density'); plt.title('Distribution of Ages');

- 如何通过kde看出相关性:比如下图EXT_SOURCE_3比起其他2个更能分辨出target=0/1的区别,那就说明EXT_SOURCE_3比起其他2个更好,更有相关性。

2.发现样本目标值不均衡怎么办?

- 在训练器里面加权目标值:weight classes(XGBOOST)
- 其他解决方法看这里:这里
- 下面有class_weight = 'balanced'参数
# Create the model
        model = lgb.LGBMClassifier(n_estimators=10000, objective = 'binary',
                                   class_weight = 'balanced', learning_rate = 0.05,
                                   reg_alpha = 0.1, reg_lambda = 0.1,
                                   subsample = 0.8, n_jobs = -1, random_state = 50)
3.查看数据集里面所有categorical里面的Unique数量
# Number of unique classes in each object column
app_train.select_dtypes('object').apply(pd.Series.nunique, axis = 0)
4.对于categorical的encoding
原文给出的是
小于2个的categorical ---> label encoding
from sklearn.preprocessing import LabelEncoder
le = LabelEncoder()
le.fit(app_train[col])
app_train[col] = le.transform(app_train[col])
大于2个的 ---> one-hot encoding
pd.get_dummies(app_train[col])
5.如何对齐align训练集和测试集
最后训练集要比测试集多一列:target
align的理由是在one-hot encoding之后:训练集可能比测试集多出几列(训练集里面存在的categorical值,在测试集里面不存在)
下面是对齐的实现,注意要事先把target拿出来,防止被align的时候删除。
train_labels = app_train['TARGET']

# Align the training and testing data, keep only columns present in both dataframes
app_train, app_test = app_train.align(app_test, join = 'inner', axis = 1)

# Add the target back in
app_train['TARGET'] = train_labels

print('Training Features shape: ', app_train.shape)
print('Testing Features shape: ', app_test.shape)
得到
Training Features shape:  (307511, 240)
Testing Features shape:  (48744, 239)
6.对于相关性的评估
.00-.19 “very weak”
.20-.39 “weak”
.40-.59 “moderate”
.60-.79 “strong”
.80-1.0 “very strong”
7.简单replace一个值
可以用切片或者df.replace
# Replace the anomalous values with nan
app_train['DAYS_EMPLOYED'].replace({365243: np.nan}, inplace = True)
8.处理outlier/anomalies
将其变成nan,然后之后会在处理nan(插补imputation)的时候一同处理。
9.神奇的anomalies
原文发现有些人的年龄超过了1000岁(异常值)而且这些人欠款违约(default loan)的概率比一般人还小。
anom = app_train[app_train['DAYS_EMPLOYED'] == 365243]
non_anom = app_train[app_train['DAYS_EMPLOYED'] != 365243]
print('The non-anomalies default on %0.2f%% of loans' % (100 * non_anom['TARGET'].mean()))
print('The anomalies default on %0.2f%% of loans' % (100 * anom['TARGET'].mean()))
print('There are %d anomalous days of employment' % len(anom))
得到只有5.4%的人违约欠款了。
The non-anomalies default on 8.66% of loans
The anomalies default on 5.40% of loans
There are 55374 anomalous days of employment
10.插补Imputer填充nan
之前都是直接df.fillna(df.mean()),这里用了Imputer
from sklearn.preprocessing import MinMaxScaler, Imputer
# Median imputation of missing values
imputer = Imputer(strategy = 'median')
# Fit on the training data
imputer.fit(train)
# Transform both training and testing data
train = imputer.transform(train)
11.训练完后展示重要的特征feature_importance
sklearn的基本每个classifer都有feature_importances_这个参数,下面的例子是随机树
# Extract feature importances
feature_importance_values_domain = random_forest_domain.feature_importances_
feature_importances_domain = pd.DataFrame({'feature': domain_features_names, 'importance': feature_importance_values_domain})
获取到之后就可以用barplot来显示
def plot_feature_importances(df):
    """
    Plot importances returned by a model. This can work with any measure of
    feature importance provided that higher importance is better.

    Args:
        df (dataframe): feature importances. Must have the features in a column
        called `features` and the importances in a column called `importance

    Returns:
        shows a plot of the 15 most importance features

        df (dataframe): feature importances sorted by importance (highest to lowest)
        with a column for normalized importance
        """

    # Sort features according to importance
    df = df.sort_values('importance', ascending = False).reset_index()

    # Normalize the feature importances to add up to one
    df['importance_normalized'] = df['importance'] / df['importance'].sum()

    # Make a horizontal bar chart of feature importances
    plt.figure(figsize = (10, 6))
    ax = plt.subplot()

    # Need to reverse the index to plot most important on top
    ax.barh(list(reversed(list(df.index[:15]))),
            df['importance_normalized'].head(15),
            align = 'center', edgecolor = 'k')

    # Set the yticks and labels
    ax.set_yticks(list(reversed(list(df.index[:15]))))
    ax.set_yticklabels(df['feature'].head(15))

    # Plot labeling
    plt.xlabel('Normalized Importance'); plt.title('Feature Importances')
    plt.show()

    return df
# Show the feature importances for the default features
feature_importances_sorted = plot_feature_importances(feature_importances)


