关于原文
原文是kaggle在EDA词条下vote最高的一篇文章,理由主要是通俗易懂,没有太多的数理知识,分析直观。
链接在上文的介绍篇里面的第一条,下面总结一下本文最出彩(我之前不知道的)一些技巧/分析方法。
按照分析的逻辑顺序,按照一问一答的形式。
原文小结
在初步分析的时候遇到超过50个特征cols的时候,我们怎么分析?
当遇到特征数特别多的时候(很多数据其实都是这样),我们有必要一个个分析,因为这对于我们对整个数据集的理解是很有帮助的。
我们可以分析:
-
- 特征名字
-
- 特征类型type
-
- 特征的分类segment:
- 比如原文对于这50个分了3大类:
- 建筑,空间和地点
- 其中OverallQuality属于建筑
- TotalBsmtSF属于空间大小
- Neighborhood属于地点位置
- 比如原文对于这50个分了3大类:
- 特征的分类segment:
-
- 期望expectation:
- 我们分析特征对于目标特征(sale price)的影响:high,medium,low(但是原文并没有新生成这个col,可以尝试看是否改变acc)
- 期望expectation:
-
- 特征之间的关联性:
- 有些特征名字都特别相似:GarageArea,GarageType,表示的内容含义对于我们目标特征的影响也相似
- 特征之间的关联性:
获取skewness,kurtosis
#skewness and kurtosis
print("Skewness: %f" % df_train['SalePrice'].skew())
print("Kurtosis: %f" % df_train['SalePrice'].kurt())
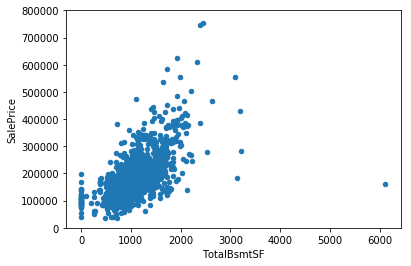
指数上升exponential的scatterplot
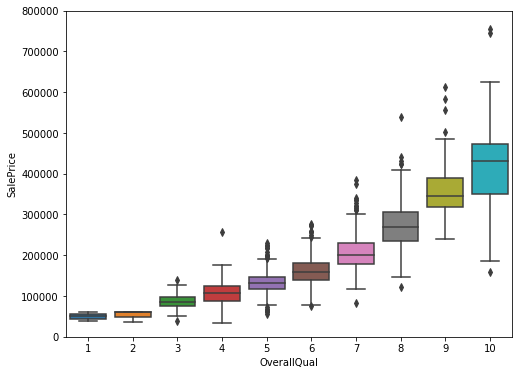
boxplot+categorical的方式
可以看到我们的数据关系也是呈现expo的趋势
#box plot overallqual/saleprice
var = 'OverallQual'
data = pd.concat([df_train['SalePrice'], df_train[var]], axis=1)
f, ax = plt.subplots(figsize=(8, 6))
fig = sns.boxplot(x=var, y="SalePrice", data=data)
fig.axis(ymin=0, ymax=800000);
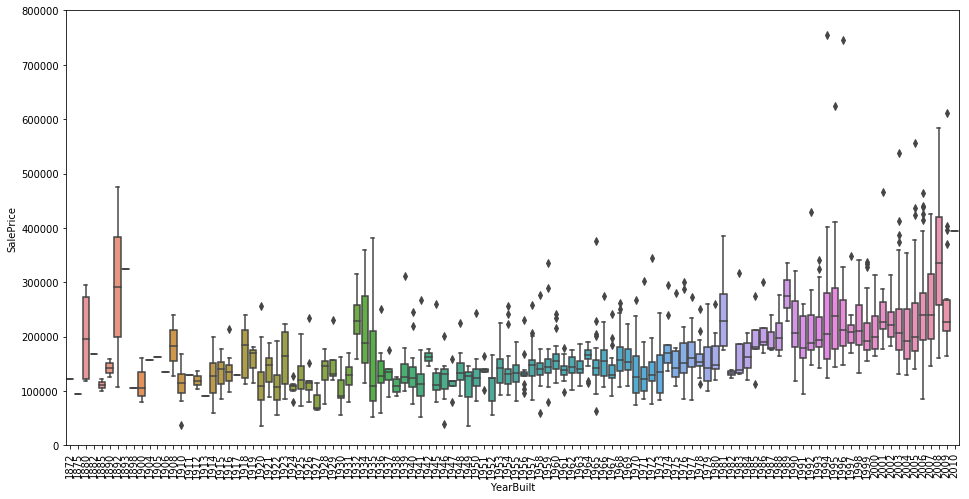
boxplot不变的趋势
随着年份的推移,房价基本不变: 作者给出的理由是抗击通货膨胀Inflation
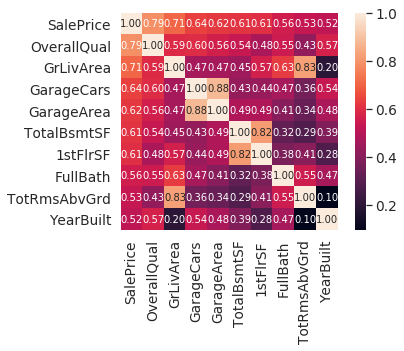
最高相关性的热图 zoomed heatmap
当我们col有超多的时候,heatmap有时候看不太清楚哪些是相关性最高的,这里我们可以取和目标特征最高相关性的10个来做新的热图(明显清晰很多)
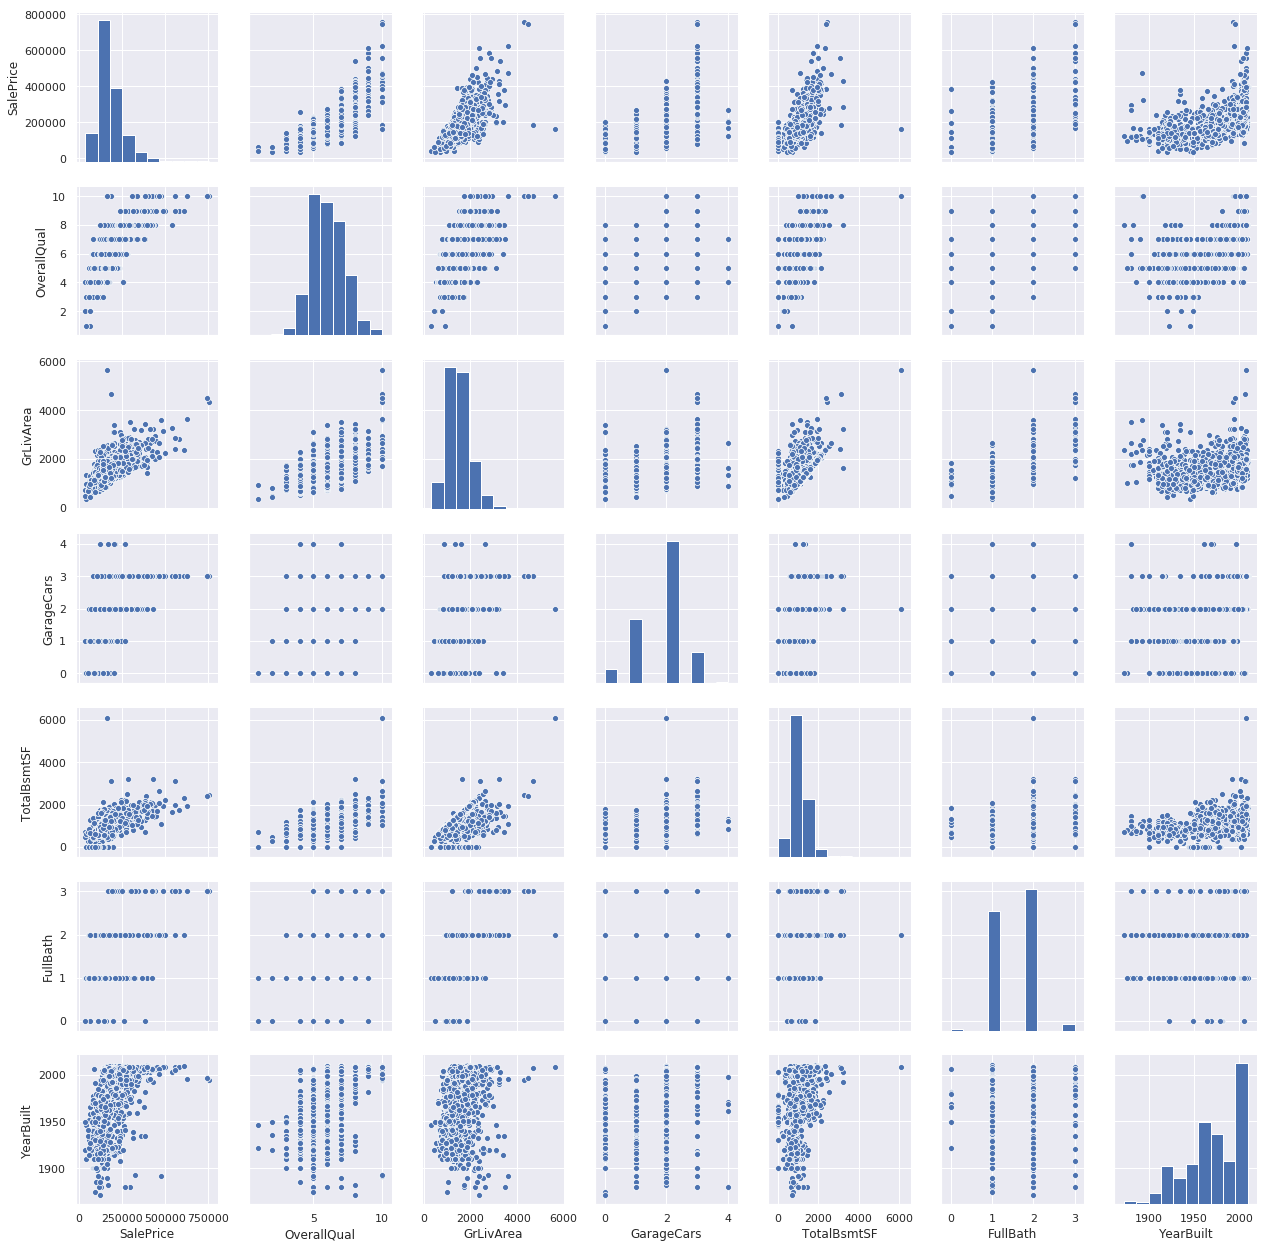
目的:获取最相关的特征然后进一步使用pairplot进行分析
#correlation matrix
corrmat = df_train.corr()
k = 10 #number of variables for heatmap
cols = corrmat.nlargest(k, 'SalePrice')['SalePrice'].index
cm = np.corrcoef(df_train[cols].values.T)
sns.set(font_scale=1.25)
hm = sns.heatmap(cm, cbar=True, annot=True, square=True, fmt='.2f', annot_kws={'size': 10}, yticklabels=cols.values, xticklabels=cols.values)
plt.show()
使用最相关特征pairplot
#scatterplot
sns.set()
cols = ['SalePrice', 'OverallQual', 'GrLivArea', 'GarageCars', 'TotalBsmtSF', 'FullBath', 'YearBuilt']
sns.pairplot(df_train[cols], size = 2.5)
plt.show();
查看missing data
#missing data
total = df_train.isnull().sum().sort_values(ascending=False)
percent = (df_train.isnull().sum()/df_train.isnull().count()).sort_values(ascending=False)
missing_data = pd.concat([total, percent], axis=1, keys=['Total', 'Percent'])
missing_data.head(20)
处理missing data
- 原文给出的条件:
- 超过15%的missing,整个col删除
- 低于15%的,如果存在之前的相关性--->存在nan的row删除
- 低于15%的,如果不存在相关性-->整个col删除 - 最后检测是否还有missing
df_train.isnull().sum().max()
如何normalize我们的data
除了sklearn提供的minmaxscaler,standardscaler,对于不同的skewed data我们可以有不同的操作
-
左偏/left-skewed/negative skewed
- square:x-->x^2
- log
- cube root -
右偏/right-skewed/positive skewed
- square root:x--->x^(1/2)
- cube root:x--->x^(1/3)
- log:x--->log(x)/ln(x)
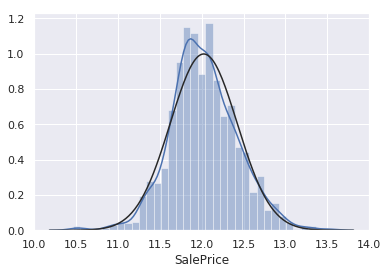
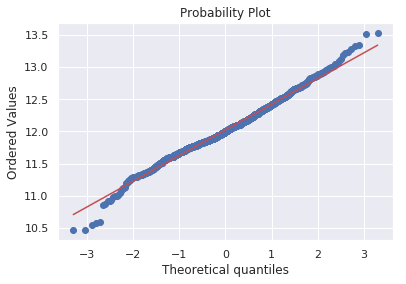
histogram+probplot
Histogram - Kurtosis and skewness.
Normal probability plot - Data distribution should closely follow the diagonal that represents the normal distribution.
#histogram and normal probability plot
sns.distplot(df_train['SalePrice'], fit=norm);
fig = plt.figure()
res = stats.probplot(df_train['SalePrice'], plot=plt)
如果data里面有很多0不能做log,怎么办?
将data分成2各部分,包含0的和不含0的。对不含0的做Log,获得normalized data
做normalize的目的
- 双变量的normality不能保证多变量的normality
- 能够保证Homoscedasticity:error term在所有不相关特征中都一样


