基本py操作
这次主要是各种图形的绘制,以及上次遗留的一些问题
默认df = pd.read_csv('xxx')
拆分年月日以及相关操作
# 拆分年,月,日,小时,分钟,秒,周 然后添加到新行
def split_date(col,df):
  df[col+'_year'] = df[col].dt.year
  df[col+'_month'] = df[col].dt.month
  df[col+'_day'] = df[col].dt.day
  df[col+'_hour'] = df[col].dt.hour
  df[col+'_minute'] = df[col].dt.minute
  df[col+'_second'] = df[col].dt.second
  df[col+'_week'] = df[col].dt.week
  return df
# 选取月份作为index然后进行mean操作
df.groupby(by='ERFDAT_month').aggregate(np.mean)
histogram plot的相关操作
# 最简单用pandas自带的Plot
df['xxx'].plot(kind='hist')
df.hist(column='xxx',bins=20)
# 使用matplotlib
fig = plt.figure(figsize=(10,5))
plt.hist(df3['BAU_ID'],bins=20,range=(4700,5200))
plt.xlabel('BAUID')
plt.ylabel('frequency')
plt.title('histogram about id')
plt.plot()

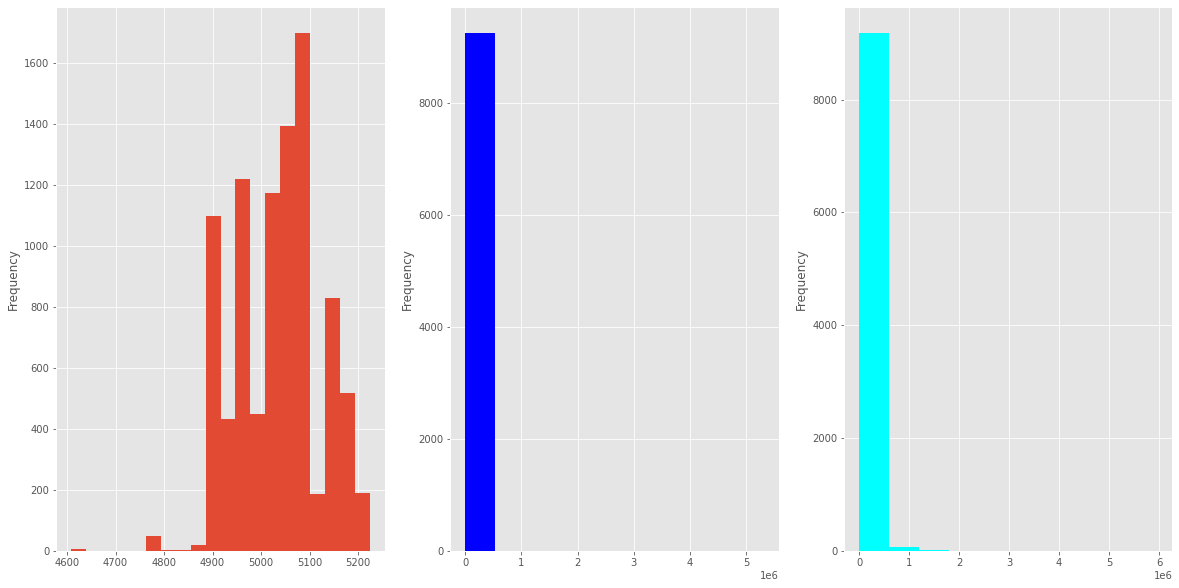
# 多个hist 绘制:注意这里的axes[0,0]还是axes[0]是看(nrows,ncols)是1-dim还是2-dim,这里是1-dim所以没有[0,0]
fig,axes = plt.subplots(nrows=1,ncols=3,figsize=(20,10))
fig.subplots_adjust(hspace=1.0) ## Create space between plots
print(df3['BAU_ID'])
df3['BAU_ID'].plot(ax=axes[0],kind='hist',bins=20)
df3['ZEIT_FERTIG'].plot(ax=axes[1],kind='hist',color='blue')
df3['ZEIT_LIEGE'].plot(ax=axes[2],kind='hist',color='cyan')
# 把2个Hist拼到一起去
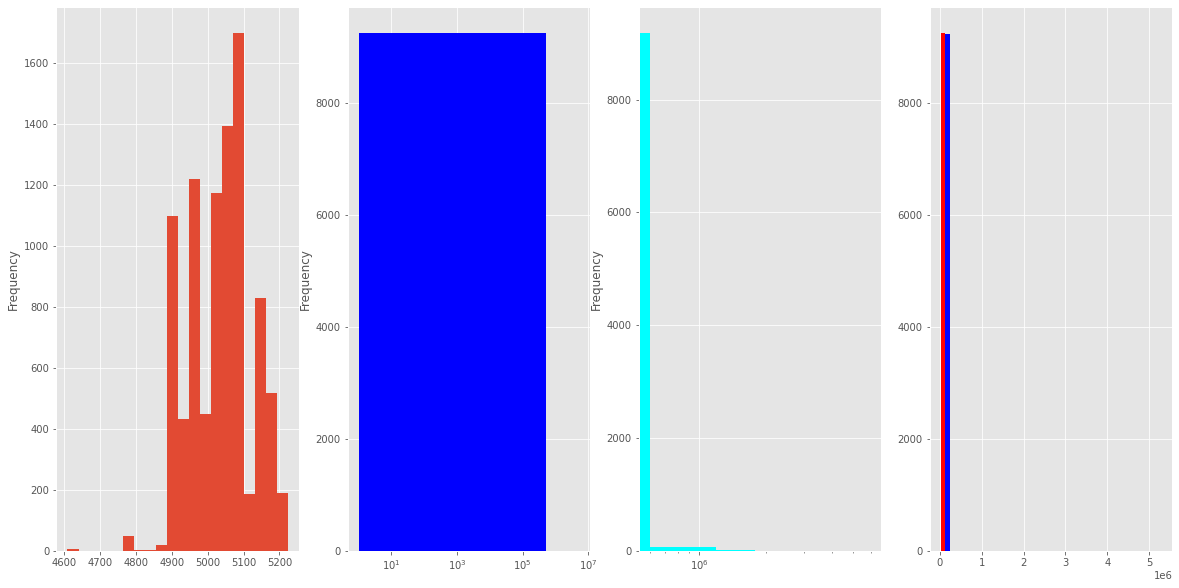
axes[3].hist([df3['BAU_ID'],df3['ZEIT_FERTIG']],bins=20,color=['red','blue'])

# 我们发现第二第三个hist都集中于一点,说明x需要log scale一下才能看到清楚
# pandas的logx ----> 变成10为底的log了
df3['BAU_ID'].plot(ax=axes[0],kind='hist',bins=20)
df3['ZEIT_FERTIG'].plot(ax=axes[1],kind='hist',color='blue',logx=True)
df3['ZEIT_LIEGE'].plot(ax=axes[2],kind='hist',color='cyan',logx=True)
boxplot箱型图
# 简单箱子图
df3['BAU_ID'].plot(kind='box')
# 多个箱子图
fig,axes = plt.subplots(nrows=1,ncols=4,figsize=(20,10))
fig.subplots_adjust(hspace=1.0) ## Create space between plots
print(df3['BAU_ID'])
df3['BAU_ID'].plot(ax=axes[0],kind='box')
df3['AFO_NR'].plot(ax=axes[1],kind='box',color='blue')
df3['LAUF_NR'].plot(ax=axes[2],kind='box',color='cyan')


给histogram添加拟合曲线
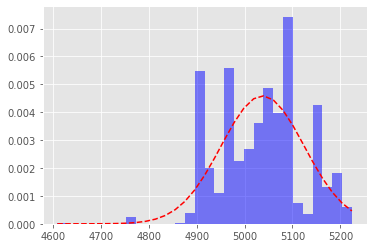
# 测试可行:注:mlab.normpdf被deprecated,plt.hist里面(normed)被density代替了
# 给histogram添加fit line 拟合曲线
mydf = df['BAU_ID']
mu,sigma = np.mean(mydf),np.std(mydf)
y_bins,bins,patches = plt.hist(mydf,bins=30,facecolor='blue',density=True,alpha=0.5)

from scipy.stats import norm
y = norm.pdf(bins,mu,sigma)
plt.plot(bins,y,'r--')
plt.subplots_adjust(left=0.15)#左边距
plt.show()
绘制heatmap
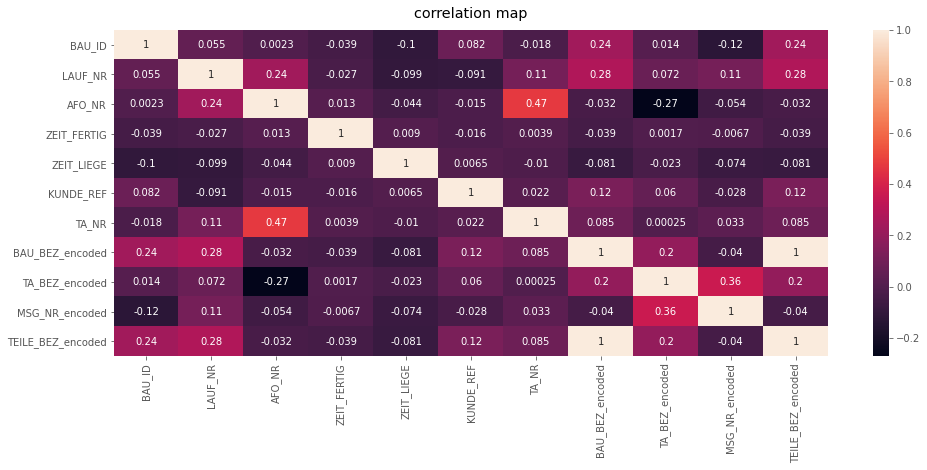
# 使用seaborn.heatmap+df.corr() 而不是df本身!
# 设置图片大小
plt.figure(figsize=(16,6))
# 还可以设置vmin, vmax取值的范围(个人觉得auto更清晰),cmap='BrBG'另一个colormap,有数字标注
heatmap = sns.heatmap(df_cleaned.corr(),annot=True)
# 设置title
heatmap.set_title('correlation map',pad=12)
绘制scatterplot
# 使用seaborn.scatterplot
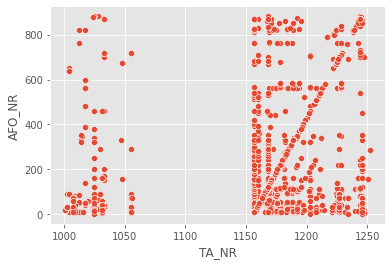
# 我们看到TA_NR和AFO_NR有0.47的corr,我们来scatterplot看一下
sns.scatterplot(data=df_cleaned_nodate,x='TA_NR',y='AFO_NR')
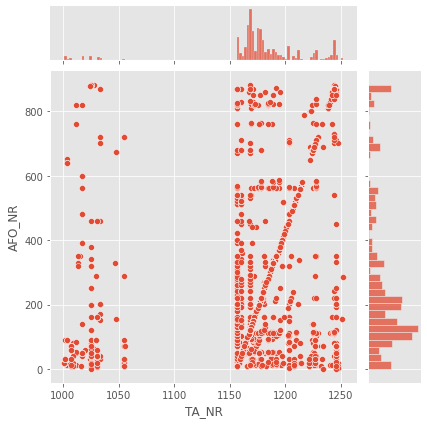
# 使用jointplot
sns.jointplot(data=df_cleaned_nodate,x='TA_NR',y='AFO_NR')
# 使用jointplot来显示3个数据通过hue
plt.figure(figsize=(100,100))
sns.jointplot(data=newdf,x='TA_NR',y='AFO_NR',hue='TA_BEZ')
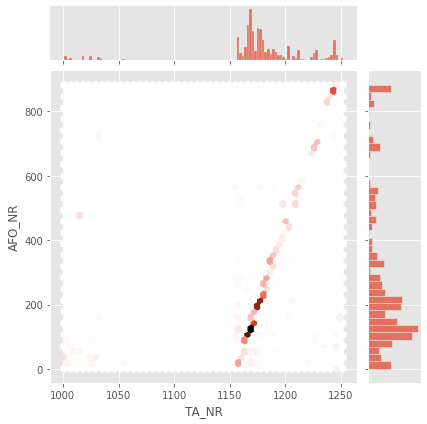
# 使用hexagonal binning
sns.jointplot(data=df_cleaned_nodate,x='TA_NR',y='AFO_NR',kind='hex')
联系方式:clarence_wu12@outlook.com


