Java-jfree报表(学习整理)----饼状图、柱状图、折线统计图
1、使用的报表工具:
jfree报表
2、下载网址:
下载之后先解压:如下图
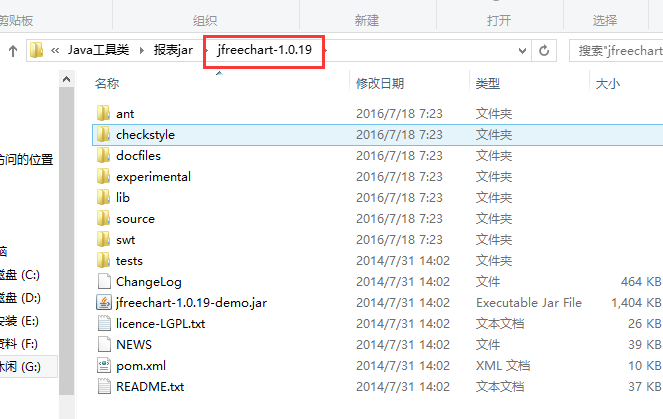
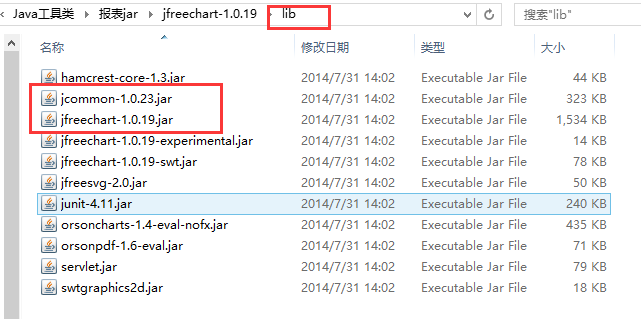
下载后:需要的jar包!如下图:

打开:找到以下的两个jar包
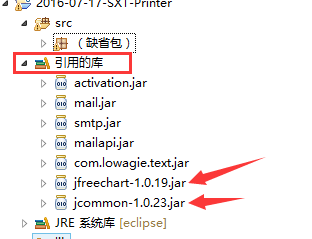
再导入开发项目中:
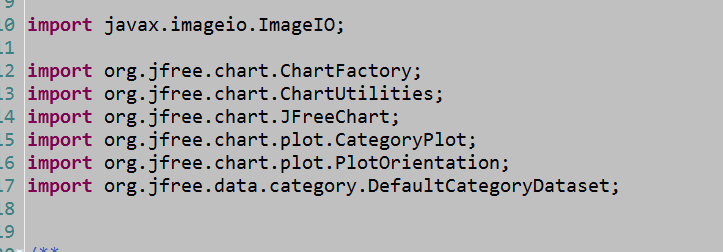
之后就可以正常使用jfree报表了:
3、jfree报表API文档:

http://tool.oschina.net/apidocs/apidoc?api=jfreechart
参考博文:Bannings博客
http://blog.csdn.net/zhangao0086/article/details/6365468
4、直接上测试源码:
4.1饼状图:
  1 import java.awt.Font;
  2 import java.awt.Image;
  3 import java.io.File;
  4 import java.util.HashMap;
  5 import java.util.Iterator;
  6 import java.util.Map;
  7 import java.util.Map.Entry;
  8 import java.util.Set;
  9
 10 import javax.imageio.ImageIO;
 11
 12 import org.jfree.chart.ChartFactory;
 13 import org.jfree.chart.ChartUtilities;
 14 import org.jfree.chart.JFreeChart;
 15 import org.jfree.chart.labels.StandardPieSectionLabelGenerator;
 16 import org.jfree.chart.plot.PiePlot;
 17 import org.jfree.data.general.DefaultPieDataset;
 18
 19 /**
 20  * 测试生成报表图形
 21  *    Created by Jason  2016-7-18  上午7:14:59
 22  */
 23 public class CharReport_BZT {
 24     /**
 25      * 提供静态方法:获取报表图形1:饼状图
 26      * @param title    标题
 27      * @param datas    数据
 28      * @param font    字体
 29      */
 30     public static void createPort(String title,Map<String,Double> datas,Font font){
 31          try {
 32                 //如果不使用Font,中文将显示不出来
 33
 34                 DefaultPieDataset pds = new DefaultPieDataset();
 35
 36                 //获取迭代器:
 37                Set<Entry<String, Double>> set =  datas.entrySet();
 38                Iterator iterator=(Iterator) set.iterator();
 39                Entry entry=null;
 40                while(iterator.hasNext()){
 41                    entry=(Entry) iterator.next();
 42                    pds.setValue(entry.getKey().toString(),Double.parseDouble(entry.getValue().toString()));
 43                }
 44                 /**
 45                  * 生成一个饼图的图表
 46                  *
 47                  * 分别是:显示图表的标题、需要提供对应图表的DateSet对象、是否显示图例、是否生成贴士以及是否生成URL链接
 48                  */
 49                 JFreeChart chart = ChartFactory.createPieChart(title, pds, true, false, true);
 50                 //设置图片标题的字体
 51                 chart.getTitle().setFont(font);
 52
 53                 //得到图块,准备设置标签的字体
 54                 PiePlot plot = (PiePlot) chart.getPlot();
 55
 56                 //设置分裂效果,需要指定分裂出去的key
 57                 plot.setExplodePercent("天使-彦", 0.1);
 58
 59                 //设置标签字体
 60                 plot.setLabelFont(font);
 61
 62                 //设置图例项目字体
 63                 chart.getLegend().setItemFont(font);
 64
 65                 /**
 66                  * 设置开始角度(弧度计算)
 67                  *
 68                  * 度    0°    30°        45°        60°        90°        120°    135°    150°    180°    270°    360°
 69                  * 弧度    0    π/6        π/4        π/3        π/2        2π/3    3π/4    5π/6    π        3π/2    2π
 70                  */
 71                 plot.setStartAngle(new Float(3.14f / 2f));
 72
 73                 //设置背景图片,设置最大的背景
 74                 Image img = ImageIO.read(new File("f:/test/1.jpg"));
 75                 chart.setBackgroundImage(img);
 76
 77                 //设置plot的背景图片
 78                  img = ImageIO.read(new File("f:/test/2.jpg"));
 79                 plot.setBackgroundImage(img);
 80
 81                 //设置plot的前景色透明度
 82                 plot.setForegroundAlpha(0.7f);
 83
 84                 //设置plot的背景色透明度
 85                 plot.setBackgroundAlpha(0.0f);
 86
 87                 //设置标签生成器(默认{0})
 88                 //{0}:key {1}:value {2}:百分比 {3}:sum
 89                 plot.setLabelGenerator(new StandardPieSectionLabelGenerator("{0}({1}票)/{2}"));
 90
 91                 //将内存中的图片写到本地硬盘
 92                 ChartUtilities.saveChartAsJPEG(new File("f:/test/aa.png"), chart, 600, 300);
 93             } catch (Exception e) {
 94                 e.printStackTrace();
 95             }
 96     }
 97
 98     public static void main(String[] args) {
 99          Font font = new Font("新宋体", Font.BOLD, 15);
100          Map<String, Double> map=new HashMap<String, Double>();
101          map.put("天使-彦", (double) 1000);
102          map.put("雄兵连-蔷薇", (double) 700);
103          map.put("太阳之光-蕾娜", (double) 600);
104          map.put("辅助-琴女", (double) 400);
105          CharReport_BZT.createPort("超神学院女神投票结果", map, font);
106     }
118
119 }
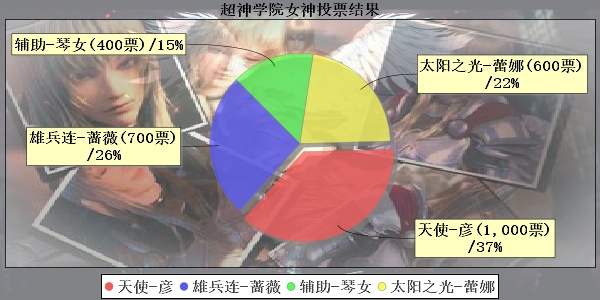
运行结果:
4.2柱状图:
  1 import java.awt.Font;
  2 import java.io.File;
  3 import java.util.HashMap;
  4 import java.util.HashSet;
  5 import java.util.Iterator;
  6 import java.util.Map;
  7 import java.util.Set;
  8
  9 import javax.imageio.ImageIO;
 10
 11 import org.jfree.chart.ChartFactory;
 12 import org.jfree.chart.ChartUtilities;
 13 import org.jfree.chart.JFreeChart;
 14 import org.jfree.chart.plot.CategoryPlot;
 15 import org.jfree.chart.plot.PlotOrientation;
 16 import org.jfree.data.category.DefaultCategoryDataset;
 17
 18 import java.util.List;
 19 import java.util.Map.Entry;
 20
 21
 22 /**
 23  *    Created by Jason  2016-7-18  上午8:12:38
 24  */
 25 public class CharReport_ZZT {
 26
 27     /**
 28      * 提供静态方法:获取报表图形2:柱状图
 29      * @param title        标题
 30      * @param datas        数据
 31      * @param type        分类(第一季,第二季.....)
 32      * @param danwei    柱状图的数量单位
 33      * @param font        字体
 34      */
 35     public static void createPort(String title,Map<String,Map<String,Double>> datas,String type,String danwei,Font font){
 36           try {
 37                 //种类数据集
 38                 DefaultCategoryDataset ds = new DefaultCategoryDataset();
 39
 40
 41                 //获取迭代器:
 42                    Set<Entry<String, Map<String, Double>>> set1 =  datas.entrySet();    //总数据
 43                    Iterator iterator1=(Iterator) set1.iterator();                        //第一次迭代
 44                    Iterator iterator2=null;
 45                    HashMap<String, Double> map =  null;
 46                    Set<Entry<String,Double>> set2=null;
 47                    Entry entry1=null;
 48                    Entry entry2=null;
 49
 50                    while(iterator1.hasNext()){
 51                        entry1=(Entry) iterator1.next();                    //遍历分类
 52
 53                        map=(HashMap<String, Double>) entry1.getValue();//得到每次分类的详细信息
 54                        set2=map.entrySet();                               //获取键值对集合
 55                        iterator2=set2.iterator();                        //再次迭代遍历
 56                        while (iterator2.hasNext()) {
 57                            entry2= (Entry) iterator2.next();
 58                            ds.setValue(Double.parseDouble(entry2.getValue().toString()),//每次统计数量
 59                                           entry2.getKey().toString(),                         //名称
 60                                           entry1.getKey().toString());                        //分类
 61                            System.out.println("当前:--- "+entry2.getKey().toString()+"--"
 62                                          +entry2.getValue().toString()+"--"
 63                                          +entry1.getKey().toString());
 64                        }
 65                        System.out.println("-------------------------------------");
 66                    }
 67
 68                 //创建柱状图,柱状图分水平显示和垂直显示两种
 69                 JFreeChart chart = ChartFactory.createBarChart(title, type, danwei, ds, PlotOrientation.VERTICAL, true, true, true);
 70
 71                 //设置整个图片的标题字体
 72                 chart.getTitle().setFont(font);
 73
 74                 //设置提示条字体
 75                 font = new Font("宋体", Font.BOLD, 15);
 76                 chart.getLegend().setItemFont(font);
 77
 78                 //得到绘图区
 79                 CategoryPlot plot = (CategoryPlot) chart.getPlot();
 80                 //得到绘图区的域轴(横轴),设置标签的字体
 81                 plot.getDomainAxis().setLabelFont(font);
 82
 83                 //设置横轴标签项字体
 84                 plot.getDomainAxis().setTickLabelFont(font);
 85
 86                 //设置范围轴(纵轴)字体
 87                 plot.getRangeAxis().setLabelFont(font);
 88                 //存储成图片
 89
 90                 //设置chart的背景图片
 91                 chart.setBackgroundImage(ImageIO.read(new File("f:/test/1.jpg")));
 92
 93                 plot.setBackgroundImage(ImageIO.read(new File("f:/test/2.jpg")));
 94
 95                 plot.setForegroundAlpha(1.0f);
 96
 97                 ChartUtilities.saveChartAsJPEG(new File("f:/test/bb.png"), chart, 600, 400);
 98             } catch (Exception e) {
 99                 e.printStackTrace();
100             }
101      }
102
103     public static void main(String[] args) {
104
105
106         Map<String, Map<String, Double>> datas =new HashMap<String, Map<String,Double>>();
107
108         Map<String, Double> map1=new HashMap<String, Double>();
109         Map<String, Double> map2=new HashMap<String, Double>();
110         Map<String, Double> map3=new HashMap<String, Double>();
111         Map<String, Double> map4=new HashMap<String, Double>();
112
113         //设置第一期的投票信息
114          map1.put("天使-彦", (double) 1000);
115          map1.put("雄兵连-蔷薇", (double) 700);
116          map1.put("太阳之光-蕾娜", (double) 600);
117          map1.put("辅助-琴女", (double) 400);
118
119         //设置第二期的投票信息
120          map2.put("天使-彦", (double) 1300);
121          map2.put("雄兵连-蔷薇", (double) 900);
122          map2.put("太阳之光-蕾娜", (double) 800);
123          map2.put("辅助-琴女", (double) 500);
124
125         //设置第三期的投票信息
126          map2.put("天使-彦", (double) 2000);
127          map3.put("雄兵连-蔷薇", (double) 1700);
128          map3.put("太阳之光-蕾娜", (double) 1000);
129          map3.put("辅助-琴女", (double) 1000);
130
131         //设置第四期的投票信息
132          map4.put("天使-彦", (double) 3000);
133          map4.put("雄兵连-蔷薇", (double) 2500);
134          map4.put("太阳之光-蕾娜", (double) 1600);
135          map4.put("辅助-琴女", (double) 1400);
136
137          //压入数据
138          datas.put("第一季", map1);
139          datas.put("第二季", map2);
140          datas.put("第三季-神与神", map3);
141         // datas.put("第四季-黑甲", map4);
142
143         Font font = new Font("宋体", Font.BOLD, 20);
144         CharReport_ZZT.createPort("超神学院前四季最受欢迎的女性角色投票结果",datas,"超神纪元","数量单位(票)",font);
145     }
146
147 }
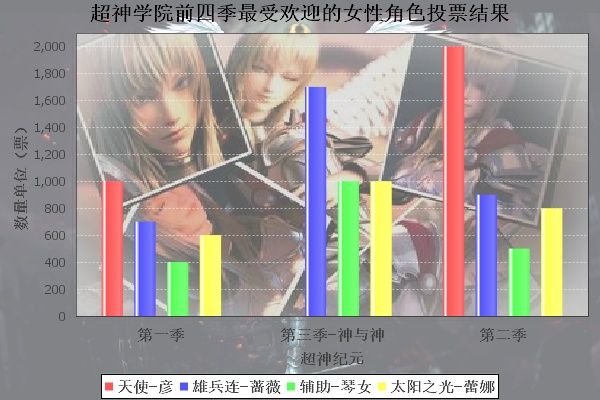
运行效果:
4.3折线图
  1 import java.awt.Color;
  2 import java.awt.Font;
  3 import java.io.File;
  4 import java.util.HashMap;
  5 import java.util.Iterator;
  6 import java.util.Map;
  7 import java.util.Set;
  8 import java.util.Map.Entry;
  9
 10 import javax.imageio.ImageIO;
 11
 12 import org.jfree.chart.ChartFactory;
 13 import org.jfree.chart.ChartUtilities;
 14 import org.jfree.chart.JFreeChart;
 15 import org.jfree.chart.plot.CategoryPlot;
 16 import org.jfree.chart.plot.PlotOrientation;
 17 import org.jfree.data.category.DefaultCategoryDataset;
 18
 19
 20 /**
 21  *    Created by Jason  2016-7-18  上午9:13:20
 22  */
 23 public class CharReport_ZXT {
 24     /**
 25      * 提供静态方法:获取报表图形3:折线图
 26      * @param title        标题
 27      * @param datas        数据
 28      * @param type        分类(第一季,第二季.....)
 29      * @param danwei    柱状图的数量单位
 30      * @param font        字体
 31      */
 32     public static void createPort(String title,Map<String,Map<String,Double>> datas,String type,String danwei,Font font){
 33           try {
 34                 //种类数据集
 35                 DefaultCategoryDataset ds = new DefaultCategoryDataset();
 36
 37
 38                 //获取迭代器:
 39                    Set<Entry<String, Map<String, Double>>> set1 =  datas.entrySet();    //总数据
 40                    Iterator iterator1=(Iterator) set1.iterator();                        //第一次迭代
 41                    Iterator iterator2=null;
 42                    HashMap<String, Double> map =  null;
 43                    Set<Entry<String,Double>> set2=null;
 44                    Entry entry1=null;
 45                    Entry entry2=null;
 46                    int index=1;
 47                    while(iterator1.hasNext()){//4种分类
 48                        entry1=(Entry) iterator1.next();                    //遍历分类
 49                        map=(HashMap<String, Double>) entry1.getValue();//得到每次分类的详细信息
 50                        System.err.println(map.size());
 51                        set2=map.entrySet();                               //获取键值对集合
 52                        iterator2=set2.iterator();                        //再次迭代遍历
 53                        while (iterator2.hasNext()) {//4-4
 54
 55                            entry2= (Entry) iterator2.next();
 56                            ds.setValue(Double.parseDouble(entry2.getValue().toString()),//每次统计数量
 57                                           entry2.getKey().toString(),                         //名称
 58                                           entry1.getKey().toString());                        //分类
 59                            System.out.println("当前:--- "+entry2.getKey().toString()+"--"
 60                                                       +entry2.getValue().toString()+"--"
 61                                                       +entry1.getKey().toString());
 62                        }
 63                        System.out.println("--------------------------");
 64                    }
 65
 66                 //创建折线图,折线图分水平显示和垂直显示两种
 67                // JFreeChart chart2 = ChartFactory.createLineChart(title, type, danwei, ds,//2D折线图
 68                //                                               PlotOrientation.VERTICAL,
 69                //                                             true, true, true);
 70                 JFreeChart chart = ChartFactory.createLineChart3D(title, type, danwei, ds,//3D折线图
 71                         PlotOrientation.VERTICAL,
 72                         true, true, false);
 73
 74                 //设置整个图片的标题字体
 75                 chart.getTitle().setFont(font);
 76
 77                 //设置提示条字体
 78                 font = new Font("宋体", Font.BOLD, 15);
 79                 chart.getLegend().setItemFont(font);
 80
 81                 //得到绘图区
 82                 CategoryPlot plot = (CategoryPlot) chart.getPlot();
 83                 //得到绘图区的域轴(横轴),设置标签的字体
 84                 plot.getDomainAxis().setLabelFont(font);
 85
 86                 //设置横轴标签项字体
 87                 plot.getDomainAxis().setTickLabelFont(font);
 88
 89                 //设置范围轴(纵轴)字体
 90                 font = new Font("宋体", Font.BOLD, 18);
 91                 plot.getRangeAxis().setLabelFont(font);
 92                 //存储成图片
 93
 94                 //设置chart的背景图片
 95                 chart.setBackgroundImage(ImageIO.read(new File("f:/test/1.jpg")));
 96
 97                // plot.setBackgroundImage(ImageIO.read(new File("f:/test/2.jpg")));
 98
 99                 plot.setForegroundAlpha(1.0f);
100
101                 ChartUtilities.saveChartAsJPEG(new File("f:/test/cc.png"), chart, 800, 400);
102             } catch (Exception e) {
103                 e.printStackTrace();
104             }
105      }
106
107     public static void main(String[] args) {
108
109         Map<String, Map<String, Double>> datas =new HashMap<String, Map<String,Double>>();
110
111         Map<String, Double> map1=new HashMap<String, Double>();
112         Map<String, Double> map2=new HashMap<String, Double>();
113         Map<String, Double> map3=new HashMap<String, Double>();
114         Map<String, Double> map4=new HashMap<String, Double>();
115
116         //设置第一期的投票信息
117
118          map1.put("蔷薇", (double) 700);
119          map1.put("彦", (double) 1000);
120          map1.put("蕾娜", (double) 600);
121          map1.put("琴女", (double) 400);
122
123         //设置第二期的投票信息
124          map2.put("蔷薇", (double) 900);
125          map2.put("彦", (double) 2000);
126          map2.put("蕾娜", (double) 800);
127          map2.put("琴女", (double) 500);
128
129         //设置第三期的投票信息
130          map3.put("蔷薇", (double) 1700);
131          map3.put("彦", (double) 1000);
132          map3.put("蕾娜", (double) 1400);
133          map3.put("琴女", (double) 1000);
134
135         //设置第四期的投票信息
136          map4.put("蔷薇", (double) 2500);
137          map4.put("彦", (double) 3000);
138          map4.put("蕾娜", (double) 1600);
139          map4.put("琴女", (double) 1400);
140
141          //压入数据
142          datas.put("第一季", map1);
143          datas.put("第二季", map2);
144          datas.put("第三季", map3);
145          datas.put("第四季", map4);
146
147
148
149         Font font = new Font("宋体", Font.BOLD, 20);
150         CharReport_ZXT.createPort("超神学院前四季最受欢迎的女性角色投票结果",datas,"超神纪元","数量单位(票)",font);
151
152     }
153
154 }
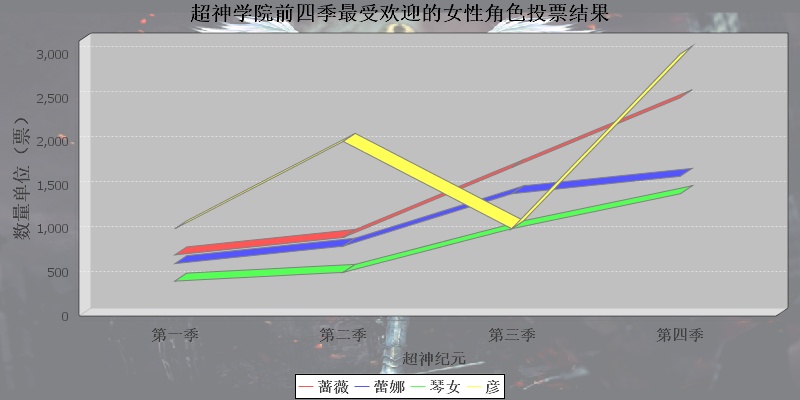
运行效果:
研究技术需要静下心来,一点一点地深究.......


 浙公网安备 33010602011771号