Quick Tips with Visual Studio 2010
来源:http://www.amazedsaint.com/2010/04/6-cool-vs2010-quick-tips-you-should.html
http://www.visiblox.com/blog/2010/04/ten-cool-things-you-didnt-know-about-visual-studio-2010
6 Cool #VS2010 Quick Tips you should know when working with Visual Studio 2010
Visual Studio 2010 is super cool. Here are few features I love most in VS 2010.
Tip 1 - Generating Sequence Diagrams To Inspect And Document
control flow
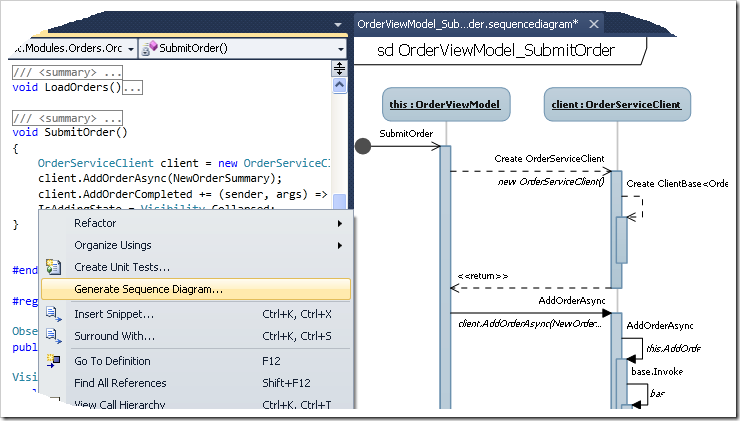
Another cool feature in Visual Studio 2010 is the ability to generate Sequence diagrams. You may right click inside a method and select “Generate the sequence diagram” from the pop up menu, to generate the diagram. In this example, you may see that my SubmitOrder method in OrderViewModel class is instantiating an OrderServiceClient, to call AddOrderAsync method inside the same.
Tip 2 - Architecture Explorer
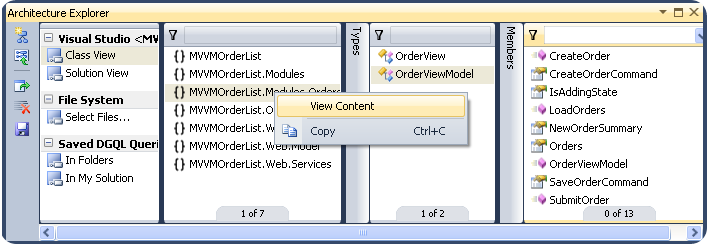
A cool addition in VS2010 is the Architecture Explorer (Click View->Architecture Explorer). The Architecture Explorer will provide you a very friendly interface to browse through and navigate to your solution assets. You can right click on an item (Namespace, Class Name, or Class Member etc) and select ‘View Content’ to navigate to the definition as well.
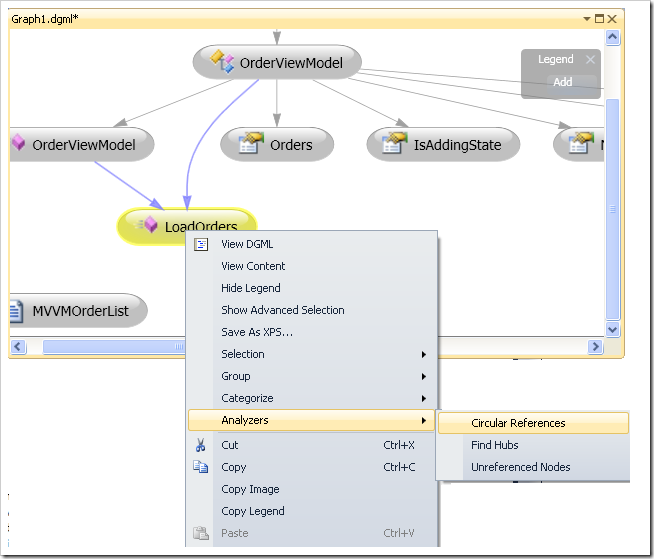
Also, you can export the selected items to a graph document from the
Architecture explorer. You can do this by selecting the members, and clicking
the ‘Create new graph document’ button (in top left corner) of the Architecture
Explorer. Let me export some of the members in my OrderViewModel class, and have
a look at the generated graph. You can also use the graph document to understand
your code members in a better way, to analyze circular references, un referenced
nodes etc (see the image below.)
Tip 3 – Code Navigators
Visual Studio 2010 has a number of useful code navigators. A simple yet
useful code navigation/identification feature is ‘Highlight Reference’ - you can
double click on any member to view the references highlighted, and can navigate
across references using the Ctrl + Shift + Up/Down arrows.
Another cool code
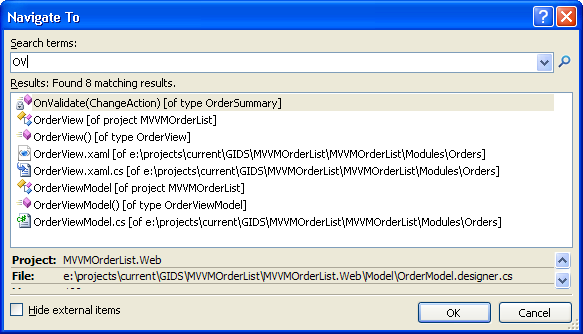
navigator is the ‘Navigate To’ window. You can use ‘Navigate To’ to search code
members quickly when you work with the editor.
You can bring up the “Navigate To” window using the shortcut
Ctrl , (press Ctrl and comma). You can search
by any term, and you can even search using camel case. See
that I’m searching for ‘OV’, to get a list of all code members following the OV
convention.
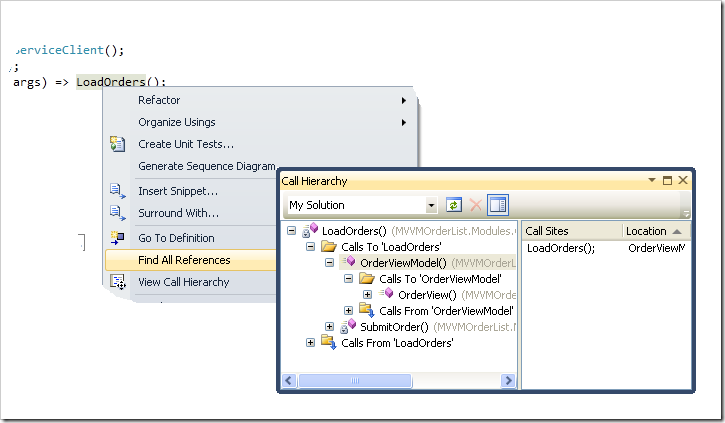
Another cool code navigation feature in Visual Studio 2010 is the ‘Call
Hierarchy’ window. You may right click any member to bring up the popup menu, to
select ‘Find All References’ to bring up the call hierarchy window. So, next
time when you change a method, you can have a look at where all you are going to
impact. You can also view all overrides of your method, if you have any.
Tip 4 – Pinning Data Tips While
Debugging
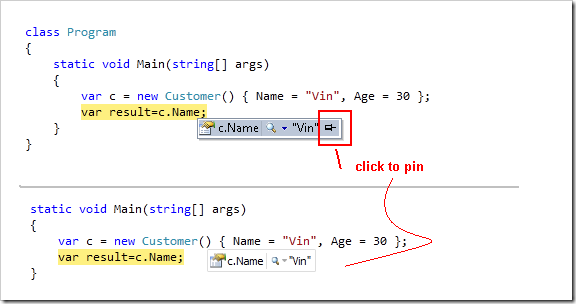
When you are debugging, you can pin variable values, so that they’ll be there for you to see later.
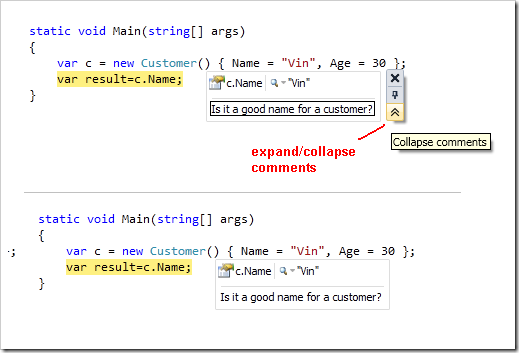
Also, you can even enter comments for a pinned data tip, so that you can view the comment later.
VS 2010 has also got a tone of other Debugger Enhancements, read about them from Scott Gu’s blog if you are interested.
Tip 5 - Consume First Development
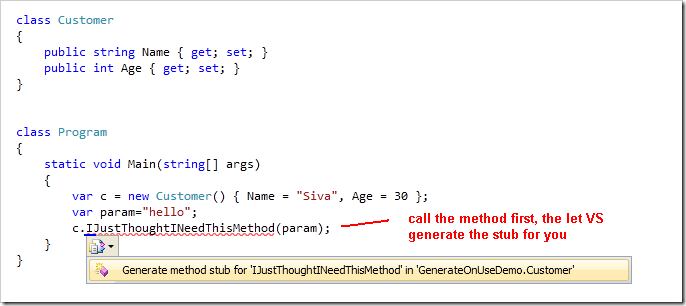
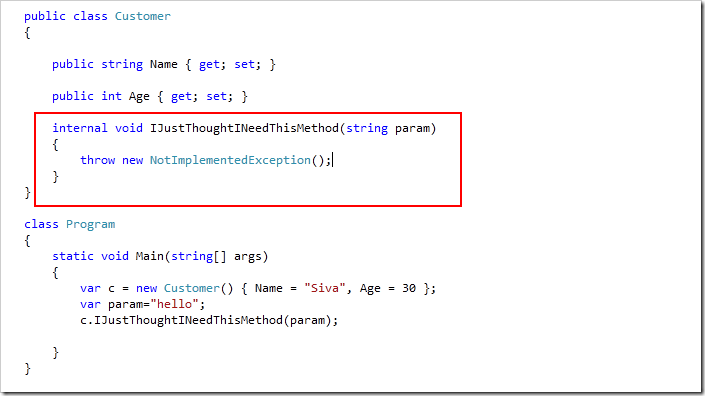
Visual Studio is so smart that it can stub your classes, members etc on the go, when you type the code. For example, assume that you have a customer class, and you thought it should have a new method while doing something. You can just type the member name (method, property etc), rest your mouse on top of the tiny blue line under your new method to bring up the popup menu.
Click that, and you’ll see VS stubbing the method for you, as shown below. Note that VS has inferred the parameter type.
You can do that with constructors, properties, method overloads etc as well. That is super cool, especially if you are a TDD guy.
Tip 6 – Extension Manager for downloading and installing
plugins
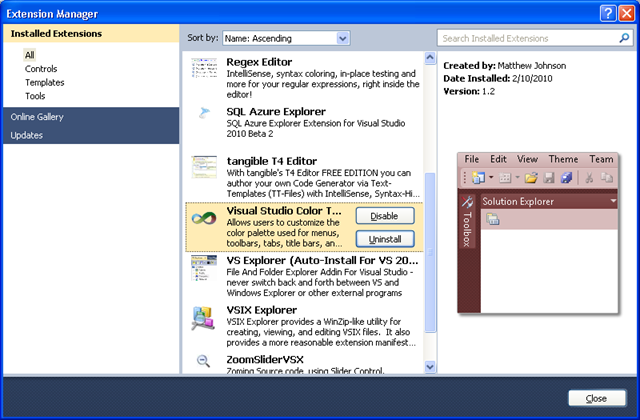
The Extension Manager in Visual Studio 2010 will allow you to download and install cool plug-ins for your VS IDE. You can bring up the extension manager window by clicking Tools->Extension Manager. Extension Manager will connect to Visual Studio 2010 online Extension library, and you can search and find cool plug-ins there.
Once installed, you may also Disable or Uninstall your plug-ins from the extensions manager. Happy Coding!!
Ten Cool Things You Didn't Know About Visual Studio 2010
Late March I’ve attended the Guthalon in Glasgow – a talk by Scott Guthrie, Microsoft vice president. The topic was the new features of Visual Studio 2010, ASP.NET MVC 2 and Silverlight 4 and the Windows Phone 7. On this talk Scott showed some great new features in Visual Studio 2010. I’m sharing the ten most useful of these in this article.
1. Pin variables when debugging
At debugging when hovering over variables the “Pin variable” option appears. Clicking on this makes the variable stick next to the source code until removed (and the pin stays there between debugging sessions). It is a really hand utility eliminating having to add variables to the Watch window one by one or search through the Locals window to find the variable one’s looking for. Definitely one of the top 3 new features I use on a day to day basis!
2. Box selection
While holding down the Alt key box selection can be made on the screen. At first glance this feature doesn’t seem to useful. However when typing anything in the selection the same text appears in all lines. So this selection is extremely useful for mass renaming of e.g. visibilities or anything else that involves changing the same thing in all lines.
3. Search on-the-fly
When pressing Crtl and , (comma) the new Navigate To window appears. This is a real-time search window offering basically the same functionality as the Find and Replace window (opened by Crtl + Shift + F) but doing it on-the fly, without having to wait seconds for search results. So the list of results updates the moment you type the next letter in your search expression. Scott said that the search database used by this window is built continously in the background by Visual Studio.
4. Zooming
There’s a small zoom drop down box on the left bottom of the application. It’s barely noticeable but is really useful when showing your code to someone else or doing presentations. Not a function you’ll use too often but comes handy every once in a while!
(Note: zooming can also be used with Crtl + mouse scroll)
5. View Call Hierarchy
Exploring code has been made much easier with the new View Call Hierarchy command in the context menu when right clicking a method. The Call Hierarchy window shows calls from the method, calls to the method and overrides of the method (if any). This little add-on makes exploring someone else’s code so much easier.
6. Sequence Diagrams
The professional and above versions of Visual Studio 2010 come with built-in sequence diagram generation functionality. Simply right click on the method and select Generate Sequence Diagram to get a nifty call sequence diagram.
7. Dependency Graphs
The professional and above versions of Visual Studio 2010 come with a built-in dependency graph generator that generates an interactive, browsable dependency graph. When there is a large number of object this graph can get overwhelmingly large. However the fact that it can track dependencies at assembly, namespace and class level as well make it a useful tool for getting an idea for the project dependencies.
8. IntelliTrace and Dump Debugging
Ever had clients submitting bug reports that you were unable to reproduce and made you wish you could just debug right on their machine? IntelliTrace brings this to reality. When running an application with IntelliTrace enabled it records the series of events happening within it and lets the developer play these back. Note however that IntelliTrace collects less information than one might need at debugging and also has a slight performance overhead when turned on. IntelliTrace is only available in Visual Studio 2010 Ultimate. For more information on Intellitrace see MSDN.
Dump Debugging is the feature that enables to open dump files from production machines and debug those. This is a great feature to use for debugging crashes happening on a production machine. See a video on how to use this feature on Channel 9.
9. Multi-monitor support
Few people knew that Visual Studio 2008 actually had multi-monitor support. You just had to launch an instance on each monitor! Aside from this joke, this feature was one that was really wanted. Now windows can be positioned across monitors making developing and debugging a much better overview on dual screens.
10. Intellisense – lots of small improvements
Intellisense has gone through lots of small improvements. The most important ones are:
- When selecting any variable all instances of it are highlighted – a well needed improvement that has been around for in lots of text editors
- Search is not limited to prefixes any more, it is done within strings. So when typing time for example, DateTime will be offered as well (previously only names starting with time were)
- Intellisense can search just knowing the capital letters of a class. When searching e.g. for HttpCachePolicy it’s enough to type HCP - nice!
- Javascript intellisense is extensive: all major Javascript libraries are supported (JQuery, Ext.JS, Prototype). Expressions are also evaluated on the fly and Intellisense is offered accordingly.
As the above list shows Visual Studio 2010 comes with plenty of small and some significant improvements. The launch of Visual Studio will be 12-14 April, until then the Release Candidate is available for evaluation.
作者:Net205
出处:http://net205.cnblogs.com
本文版权归作者和博客园共有,欢迎转载,但未经作者同意必须保留此段声明,且在文章页面明显位置给出原文连接,否则保留追究法律责任的权利。

