Vue中使用ECharts图表展示数据
使用图表展示数据,可以让数据看起来更加的直观,通过饼图或者直方图折线,能展示出数据的趋势,这篇文章简单的介绍了如何在自己的项目中集成使用Echarts图表提供工具。
官方地址站点 https://echarts.apache.org/
在Vue里使用图标工具也是很简单,只需要引入js文件就可以了,由于网络引入不是很稳定,我们这里是需要下载得到本地的,官方给的有可以把图表打包到js文件里的方法
我们需要注意,引入的时候,按需引入不会使程序显的臃肿(图表下显示的英文就是按需引入需要用到的别名)
例如我们在后面跟上 pie就是饼图,bar就是柱状图,其他的就不一一列举
import pie from 'echarts/lib/chart/pie'; // 引入饼图组件
import line from 'echarts/lib/chart/bar'; // 引入柱状图组件

开始引入
首先,在Vue里安装工具
一篇不错的收藏的文章demo
http://note.youdao.com/s/AW93X60H
npm install echarts
在页面中使用图表信息
<!--平台统计部分-->
<template>
                <!--统计表部分信息-->
                <div class="echarts-demo">
                    <!-- [1] 为 ECharts 准备一个具备大小 (宽高) 的 DOM -->
                    <div id="chart" ref="chart" style="display: inline-block; width: 550px; height: 550px"></div>
                    <div id="lineChart" ref="lineChart" style="display: inline-block;   width: 550px; height: 550px"></div>
                </div>

</template>

<script>
    import {getPlateTotalInfo} from "@/api/page"
    import echarts from 'echarts'; // 方便, 但是也同时引入了很多不需要的组件
    import pie from 'echarts/lib/chart/pie';   // 引入柱状图组件
    import line from 'echarts/lib/chart/bar';   // 引入柱状图组件
    export default {
        name: "platformtotal",
        data(){
            return{
                value1: '',
                value2: '',
                oneValue:"",
                twoValue:"",
                threeValue:"",
                fourValue:"",
                listQuery:{},
            }
        },
        created(){
            this.getList();
        },
        methods:{
//获取数据
            getList(){
                getPlateTotalInfo().then(res=>{
                        if(res.data.result){
                        this.oneValue = res.data.listVo.newPeople;
                         this.twoValue = res.data.listVo.newPayPeople;
                        this.threeValue = res.data.listVo.totalMoney;
                        this.fourValue = res.data.listVo.sendSellerMoney;

                        this.chart = echarts.init(this.$refs.chart);
                        // [4] 设置 Echarts饼图的图表数据
                        this.chart.setOption({
                            title: {
                                text: '平台统计信息',
                                subtext: '平台统计信息',
                                x:'center'
                            },
                            tooltip: {
                                trigger: 'item',
                                formatter: "{a} <br/>{b} : {c} ({d}%)"
                            },
                            toolbox: {
                                show : true,
                                feature : {
                                    mark : {show: true},
                                    dataView : {show: true, readOnly: false},
                                    magicType : {
                                        show: true,
                                        type: ['pie', 'funnel'],
                                        option: {
                                            funnel: {
                                                x: '25%',
                                                width: '50%',
                                                funnelAlign: 'left',
                                                max: 1548
                                            }
                                        }
                                    },
                                    restore : {show: true},
                                    saveAsImage : {show: true}
                                }
                            },
                            calculable : true,
                            legend: {
                                orient : 'vertical',
                                x : 'left',
                                data:['新增用户','新增付款人数','托管金额','给卖家金额']
                            },
                            series: [{
                                name: '信息类别',
                                type: 'pie',    // 设置图表类型为饼图
                                radius: '55%',  // 饼图的半径,外半径为可视区尺寸(容器高宽中较小一项)的 55% 长度。
                                hoverAnimation:true, // 是否开启 hover 在扇区上的放大动画效果
                                center: ['50%', '60%'],
                                data:[          // 数据数组,name 为数据项名称,value 为数据项值
                                    {value:this.oneValue, name:'新增用户'},
                                    {value:this.twoValue, name:'新增付款人数'},
                                    {value:this.threeValue, name:'托管金额'},
                                    {value:this.fourValue, name:'给卖家金额'},
                                ],
                                // roseType: 'angle',
                                legend: {
                                orient : 'vertical',
                                x : 'left',
                                    data: ['新增用户','新增付款人数','托管金额','给卖家金额']
                                },
                            }]
                        });
                            // [4] 设置 Echarts 柱状图图表数据 lineChart
                            this.lineChart = echarts.init(this.$refs.lineChart);
                            this.lineChart.setOption({
                                title: {
                                    text: '平台统计信息'
                                },
                                tooltip: {},
                                xAxis: {
                                    data: ['新增用户', '新增付款人数', '托管金额', '给卖家金额' ]
                                },
                                yAxis: {
                                    type: 'value'
                                },
                                series: [{
                                    name: '销量',
                                    type: 'bar',
                                    showBackground: true,
                                    backgroundStyle: {
                                        color: 'rgba(220, 220, 220, 0.8)'
                                    },
                                    data: [  this.oneValue, this.twoValue , this.threeValue , this.fourValue ]
                                }]
                            });
                    }
                })
            },

        }
    }
</script>
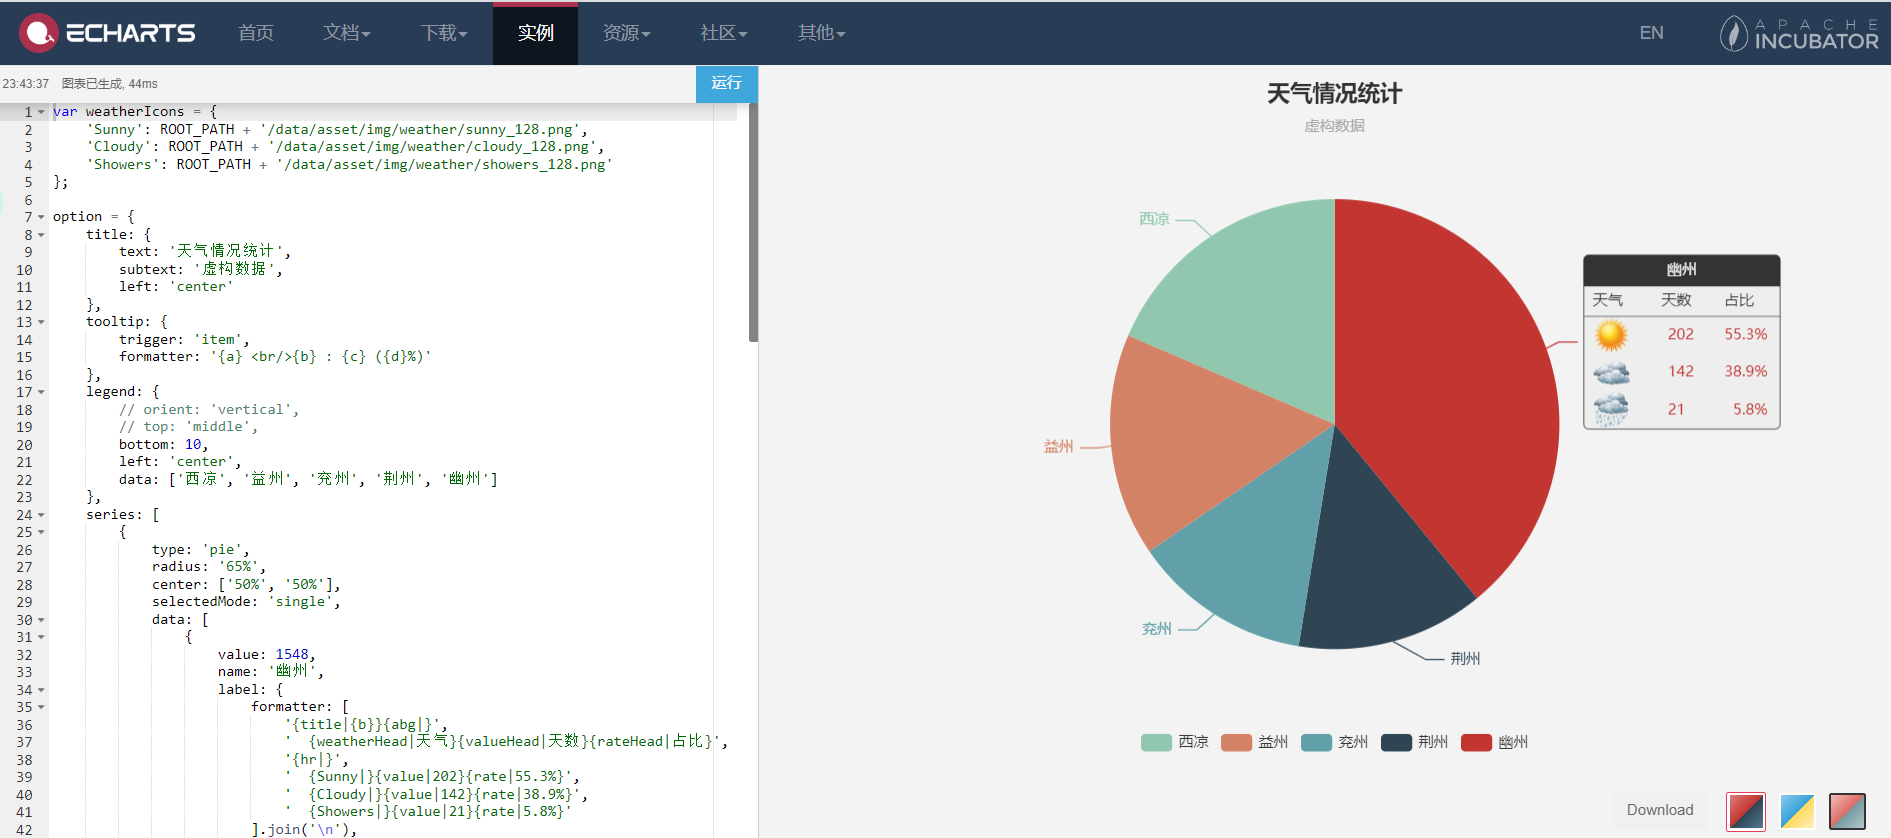
实现显示效果,饼图可以查看数据,导出作为png图片,右侧预览信息等

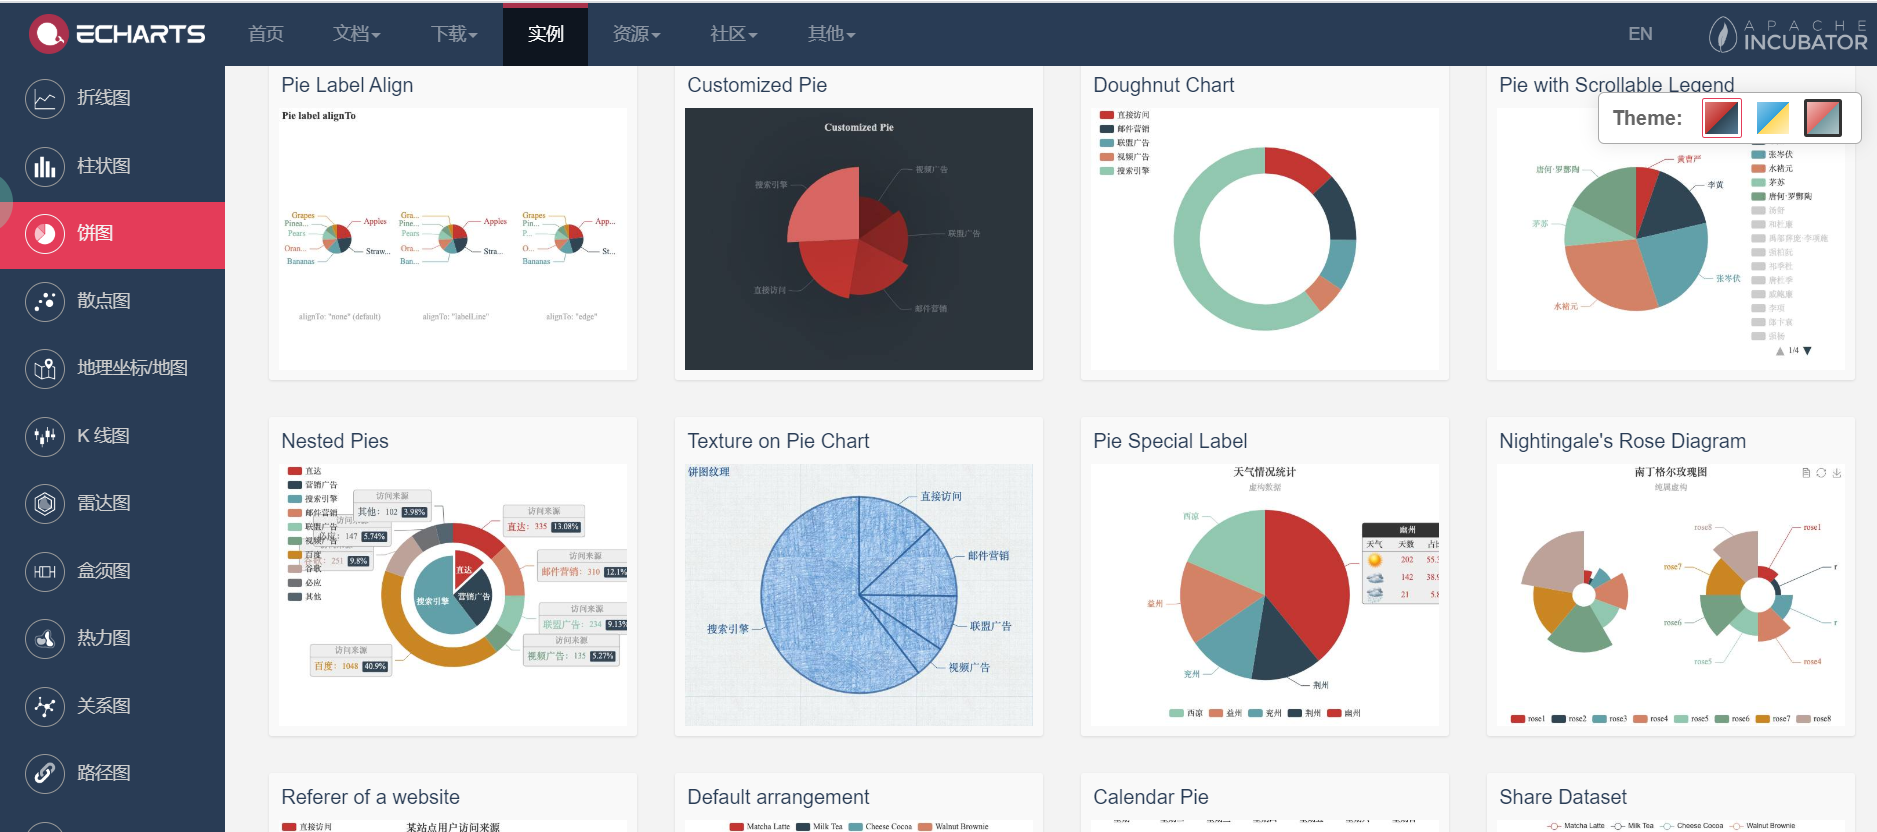
关于实例,官方给的有demo,里面包含了详细的代码实现
demo网址 https://echarts.apache.org/examples/zh/index.html#chart-type-pie
预览格式,我们可以根据需要,直接将相应的图表代码信息引入到自己的项目页面里来
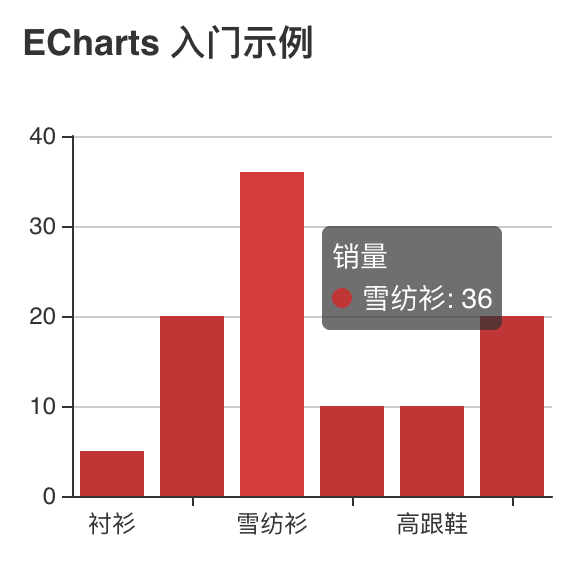
上文demo里引用了接口数据,这里给出一个没有使用接口的数据demo
<template>
<div class="echarts-demo">
    <!-- [1] 为 ECharts 准备一个具备大小 (宽高) 的 DOM 标签-->
    <div id="chart" ref="chart" style="width: 300px; height: 300px"></div>
</div>
</template>

<script>
// [2] 引入 echarts
// 全部引入
import echarts from 'echarts';

// 按需引入
// import echarts from 'echarts/lib/echarts'; // 引入基本模板
// import bar from 'echarts/lib/chart/bar';   // 引入柱状图组件

export default {
    data() {
        return {
            chart: null,
        };
    },
    mounted() {
        // [3] 基于准备好的 DOM,初始化 Echarts 实例
        // 使用 ref 访问 DOM, 也可以使用 document.getElementById('chart')
        this.chart = echarts.init(this.$refs.chart);

        // [4] 设置 Echarts 图表数据
        this.chart.setOption({
//设置标题
            title: {
                text: 'ECharts 入门示例'
            },
            tooltip: {},
//设置x轴的内容
            xAxis: {
                data: ['衬衫', '羊毛衫', '雪纺衫', '裤子', '高跟鞋', '袜子']
            },
//设置y轴的内容
            yAxis: {},
//设置数据信息
            series: [{
                name: '销量',
                type: 'bar',
                data: [5, 20, 36, 10, 10, 20]
            }]
        });
    }
};
</script>

 浙公网安备 33010602011771号