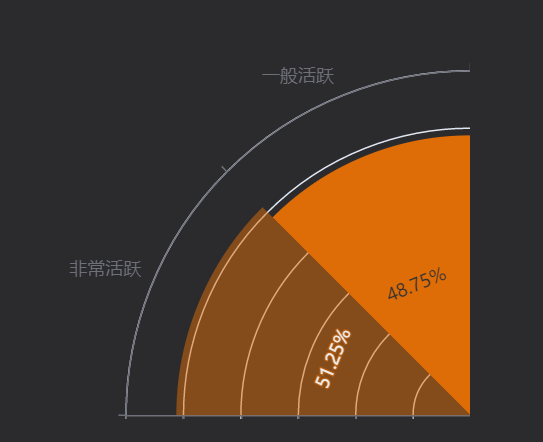
echarts半角扇形图

传参
<littlePie :dataList="dataList3" :title="title1"></littlePie>
      dataList3:[
        {
          name:'123',
          x:['轻度', '中度', '重度'],
          y:[150, 230, 224]
        }
      ]
title3:'载体偏好',
<template>
  <div>
    <div ref="donutChart" class="donutChart"></div>
    <!--        <dataChange ref="dataChangeDialog" :visible.sync="showDataChangeDialog"></dataChange>-->
  </div>
</template>

<script>
import * as echarts from 'echarts';

export default {
  name: "donutChart",
  components: {
    // dataChange
  },
  props: {
    dataList: Array,
    title: String
  },
  data() {
    return {
      vocalEmotion: [],
      showDataChangeDialog: false
    }
  },
  destroyed(){
    // 这一步的目的是移除监听
    window.removeEventListener("resize",this.listener)
  },
  mounted() {
    window.addEventListener('resize', this.listener)

    // 在通过mounted调用即可
    this.vocalEmotion = this.dataList
    if (this.vocalEmotion.length != 0) {
      // 在通过mounted调用即可
      this.echartsInit()
    }
  },
  watch: {
    dataList(newValue, oldValue) {
      if (newValue.length != 0) {
        this.vocalEmotion = newValue
        // console.log(this.stackedColumnar[0])
        this.echartsInit()
      }

    }
  },
  methods: {
    listener(){
      let chart = this.$echarts.init(this.$refs.donutChart)
      chart.resize()
    },
    //初始化echarts
    echartsInit() {
      // console.log()
      let _this = this;
      let total = 0
      this.vocalEmotion[0].y.map(m => {
        total = total + m
      })

      var data = [...this.vocalEmotion];
      let colorList = []

      var newNum = 1
      let series = []
      data[0].x.map((m, i) => {
        let num = 1 / data[0].x.length
        colorList.push("rgb(223,108,7," + newNum + ")")
        newNum = newNum - num
      })
      data.map((m, i) => {
        series.push({
          //配置样式
          itemStyle: {
            //通常情况下:
            normal:{
              //每个柱子的颜色即为colorList数组里的每一项,如果柱子数目多于colorList的长度,则柱子颜色循环使用该数组
              color: function (params){
                let color = colorList.reverse()[params.dataIndex]
                return color;
              }
            },
            //鼠标悬停时:
            emphasis: {
              shadowBlur: 10,
              shadowOffsetX: 0,
              shadowColor: 'rgba(0, 0, 0, 0.5)'
            }
          },
          type: 'bar',
          data: m.y,
          coordinateSystem: 'polar',
          name: "占比",
          stack: 'a',
          barCategoryGap: '0%',/*多个并排柱子设置柱子之间的间距*/
          emphasis: {
            focus: 'series'
          }
        })
      })

      var legendData = [];
      data.forEach(item => {
        legendData.push({
          icon: "circle",
          name: item.name,
        })
      })
      //因为初始化echarts 的时候,需要指定的容器 id='main'
      echarts.init(this.$refs.donutChart).setOption({
        title: {
          show: false,
          text: this.title,
          x: 'center',
          textAlign: 'center',
          textStyle: { //主标题文本样式{"fontSize": 18,"fontWeight": "bolder","color": "#333"}
            // fontFamily: 'Arial, Verdana, sans...',
            fontSize: 16,
            fontStyle: 'normal',
            fontWeight: '500',
            color: '#ced2d3'
          },
        },
        color: colorList,
        tooltip: {
          // trigger: "item",
          // formatter: `{a} <br/>{b} : {c}篇 ({c}%)`,
          formatter:function (params) {
            let str
            str = `${params.seriesName} <br/>${params.name} : ${params.value}篇 (${((params.value/total) * 100).toFixed(2)}%)`
            return str
          },
        },
        radiusAxis: {},
        polar: {
          radius: [0, '160%'],
          center: ['100%', '99%']
        },
        angleAxis: {
          max: data[0].x.length * 4 - 1,
          startAngle: 180,
          type: 'category',
          data: data[0].x
        },
        series: series,

      })

    }
  },
}
</script>

<style scoped>
.donutChart {
  width: 100%;
  min-height: 287px;
  background-color: transparent;
}
</style>


