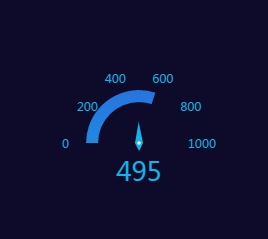
echarts2.0仪表盘
1 2 3 4 5 6 7 8 9 10 11 12 13 14 15 16 17 18 19 20 21 22 23 24 25 26 27 28 29 30 31 32 33 34 35 36 37 38 39 40 41 42 43 44 45 46 47 48 49 50 51 52 53 54 55 56 57 58 59 60 61 62 63 64 65 66 67 68 69 70 71 72 73 74 75 76 77 78 79 80 81 82 83 84 85 86 87 88 89 90 91 92 93 94 95 96 97 98 99 100 101 102 103 104 105 106 107 108 109 110 111 112 113 114 115 116 117 118 119 120 121 122 123 124 125 126 127 128 129 130 131 132 | option = { backgroundColor: '#0e0b2a', tooltip : { formatter: "{a} <br/>{b} : {c}%" }, toolbox: { show : true, feature : { mark : {show: true}, restore : {show: true}, saveAsImage : {show: true} } }, series : [ { name:'个性化仪表盘', type:'gauge', center : ['50%', '50%'], // 默认全局居中 radius : [0, '55%'], startAngle: -180, endAngle : -360, min: 0, // 最小值 max: 1000, // 最大值 precision: 0, // 小数精度,默认为0,无小数点 splitNumber: 5, // 分割段数,默认为5 axisLine: { // 坐标轴线 show: false, // 默认显示,属性show控制显示与否 }, axisTick: { // 坐标轴小标记 show: false, // 属性show控制显示与否,默认不显示 }, axisLabel: { // 坐标轴文本标签,详见axis.axisLabel show: true, formatter: function(v){ switch (v+''){ case '0': return '0'; case '200': return '200'; case '400': return '400'; case '600': return '600'; case '800': return '800'; case '1000': return '1000'; default: return ""; } }, textStyle: { // 其余属性默认使用全局文本样式,详见TEXTSTYLE color: '#13b4eb', fontSize:12, } }, splitLine: { // 分隔线 show: false, // 默认显示,属性show控制显示与否 }, pointer : { show:false, }, title : { show : false, }, detail : { show : false, }, data:[] }, { name:'机组频率(HZ)', type:'gauge', center : ['50%', '50%'], // 默认全局居中 radius : [0, '28%'], startAngle: -180, endAngle : -360, min: 0, // 最小值 max: 1000, // 最大值 precision: 0, // 小数精度,默认为0,无小数点 splitNumber: 5, // 分割段数,默认为5 axisLine: { // 坐标轴线 show: true, // 默认显示,属性show控制显示与否 lineStyle: { // 属性lineStyle控制线条样式 color: [[0.6, (function (){ var zrColor = require('zrender/tool/color'); return zrColor.getLinearGradient( 0,0,0, 1000,[[0, '#3740d5'],[0.3, '#13b4eb']])})(),] ,[1, 'transparent']], width: 12 } }, axisTick: { // 坐标轴小标记 show: false, // 属性show控制显示与否,默认不显示 }, axisLabel: { // 坐标轴文本标签,详见axis.axisLabel show: false, }, splitLine: { // 分隔线 show: false, // 默认显示,属性show控制显示与否 }, pointer : { show:true, length : '40%', width : 4, color : '#13b4eb' }, title : { show : false, offsetCenter: ['-65%', -10], // x, y,单位px textStyle: { // 其余属性默认使用全局文本样式,详见TEXTSTYLE color: '#333', fontSize : 15 } }, detail : { show : true, backgroundColor: 'rgba(0,0,0,0)', borderWidth: 0, borderColor: '#ccc', width: 100, height: 40, offsetCenter: ['0%', 8], // x, y,单位px formatter:'{value}', textStyle: { // 其余属性默认使用全局文本样式,详见TEXTSTYLE color: '#13b4eb', fontSize : 26 } }, data:[{value: 50.01, name: '频率'}] } ]};clearInterval(timeTicket);timeTicket = setInterval(function (){ option.series[1].data[0].value = (Math.random()*1000).toFixed(2) - 0; myChart.setOption(option, true);},2000) |
运行效果:


【推荐】还在用 ECharts 开发大屏?试试这款永久免费的开源 BI 工具!
【推荐】国内首个AI IDE,深度理解中文开发场景,立即下载体验Trae
【推荐】编程新体验,更懂你的AI,立即体验豆包MarsCode编程助手
【推荐】抖音旗下AI助手豆包,你的智能百科全书,全免费不限次数
【推荐】轻量又高性能的 SSH 工具 IShell:AI 加持,快人一步
· dotnet 源代码生成器分析器入门
· ASP.NET Core 模型验证消息的本地化新姿势
· 对象命名为何需要避免'-er'和'-or'后缀
· SQL Server如何跟踪自动统计信息更新?
· AI与.NET技术实操系列:使用Catalyst进行自然语言处理
· 官方的 MCP C# SDK:csharp-sdk
· 一款 .NET 开源、功能强大的远程连接管理工具,支持 RDP、VNC、SSH 等多种主流协议!
· 提示词工程师自白:我如何用一个技巧解放自己的生产力
· 一文搞懂MCP协议与Function Call的区别
· 如何不购买域名在云服务器上搭建HTTPS服务