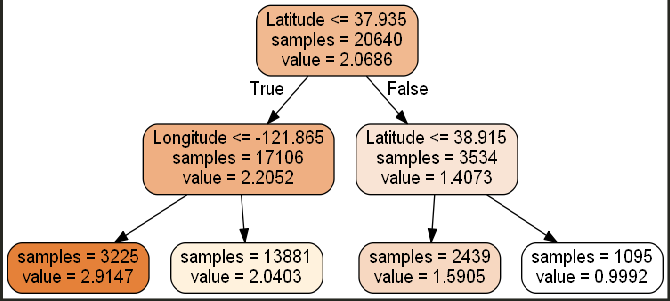
from sklearn import tree
from sklearn.datasets.california_housing import fetch_california_housing
housing = fetch_california_housing()


dtr = tree.DecisionTreeRegressor(max_depth=2)
dtr.fit(housing.data[:, [6, 7]], housing.target)

dot_data = \
          tree.export_graphviz(
              dtr,
              out_file = None,
              feature_names=housing.feature_name[6:8],
              filled = True,
              impurity = False,
              rounded = True
          )

import pydotplus
graph = pydotplus.graph_from_dot_data(dot_data)
graph.get_nodes()[7].set_fillcolor('#FFF2DD')
from IPython.display import Image
Image(graph.create_png())

 浙公网安备 33010602011771号