1. itertools.product 进行数据的多种组合
intertools.product(range(0, 1), range(0, 1)) 组合的情况[0, 0], [0, 1], [1, 0], [1, 1]
2. confusion_matrix(test_y, pred_y) # 构造混淆矩阵
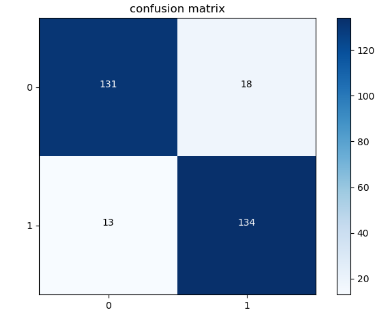
混淆矩阵是TP(正的预测成正的), FP(正的预测成负的), TN(负的预测成负的), FN(负的预测成正的)

从混淆矩阵中,我们可以很清楚的看出这个信息,这是一个信用欺诈的案例, 134表示的是将欺诈的预测出来的数值, 13表示的是将欺诈的预测成正常的, 131表示的是将正常的预测成正常的,18表示将正常的预测成欺诈的
精度: (134 + 131) / (134+131+13+18)
召回率: (134) / (134 + 13)
F1得分 : (1 / (精度 + 召回率))
代码:使用的是一个下采样的欺诈数据的代码,使用confusion_matrix 获得混合矩阵,然后使用plt.imshow() 进行画图操作
best_c = printing_KFold_score(under_train_x, under_train_y)

import itertools
# 画出混淆矩阵, 导入confusion_matrix
def plot_matrix(conf, classes,
                title='confusion matrix', cmap=plt.cm.Blues):
    # 展示直方图
    plt.imshow(conf, cmap=cmap)
    # 图片标题
    plt.title(title)
    # 图片颜色条
    plt.colorbar()
    # 设置x轴和y轴位置
    x_index = np.array(classes)
    # 第一个参数是位置,第二个参数是标签名
    plt.xticks(x_index, classes, rotation=0)
    plt.yticks(x_index, classes)
    conf_mean = conf.max() / 2
    # itertools.product
    # [0, 1] & [0, 1]
    # [0, 0], [0, 1], [1, 0], [1, 1]
    # 将数字添加到混合矩阵中
    for i, j in itertools.product(range(conf.shape[0]), range(conf.shape[1])):
        plt.text(j, i, conf[i, j], horizontalalignment='center',
                 color='white'if conf[i, j] > conf_mean else 'black')
    # 画出的图更加的紧凑
    plt.tight_layout()

from sklearn.metrics import confusion_matrix
# 建立逻辑回归模型
lr = LogisticRegression(C=best_c, penalty='l1')
# 模型训练
lr.fit(under_train_x, under_train_y)
# 模型预测
pred_y = lr.predict(under_text_x)
# 获得混合矩阵
conf = confusion_matrix(under_test_y, pred_y)
# 画图
plot_matrix(conf, classes=[0, 1])
# accrurracy
# 精度
accurracy = (conf[0, 0] + conf[1, 1]) / (conf[0, 0] + conf[0, 1] + conf[1, 0] + conf[1, 1])
# 召回率
recall = conf[1, 1] / (conf[1, 0] + conf[1, 1])
# F1得分
F1_score =  1 / (accurracy + recall)
plt.show()


 浙公网安备 33010602011771号