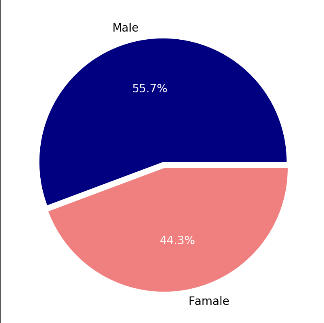
1。 画出一个基本的饼图,通过plt.pie()
m = 51212
f = 40742

m_perc = m / (m+f)
f_perc = f / (m+f)

colors = ['navy', 'lightcoral']
labels = ['Male', 'Famale']

plt.figure(figsize=(8, 8))
# autopct 表示的是使用百分号表示, explode=[0, 0.05]表示两个饼的间隔
paches, text, autotext = plt.pie([m_perc, f_perc], colors=colors, labels=labels, autopct='%1.1f%%', explode=[0, 0.05])

# 对文本添加尺寸大小 text表示外圈文本
for text in text + autotext:
    text.set_fontsize(20)
# 饼图内部的字体颜色
for text in autotext:
    text.set_color('white')
plt.show()
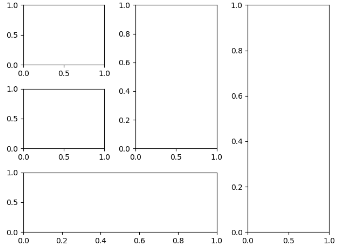
2. 设置子图布局,通过plt.subplot2grid((3, 3), (0, 0))
ax1 = plt.subplot2grid((3, 3), (0, 0))
ax2 = plt.subplot2grid((3, 3), (1, 0))
ax3 = plt.subplot2grid((3, 3), (0, 2), rowspan=3)
ax4 = plt.subplot2grid((3, 3), (2, 0), colspan=2)
ax5 = plt.subplot2grid((3, 3), (0, 1), rowspan=2)
plt.show()
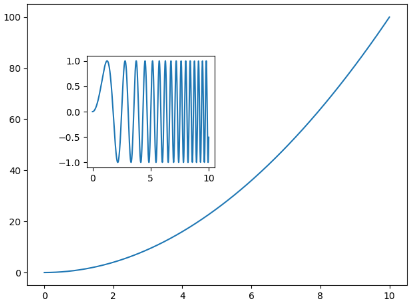
3. 在一个大图里面嵌套一个小图, 通过添加一个坐标系来完成 fig.add_axes([left, bottom, width, height])
x = np.linspace(0, 10, 1000)
y2 = np.sin(x**2)
y1 = x ** 2

fig, ax1 = plt.subplots()
left, bottom, width, height = [0.22, 0.45, 0.3, 0.35]

ax2 = fig.add_axes([left, bottom, width, height])

ax1.plot(x, y1)
ax2.plot(x, y2)
plt.show()
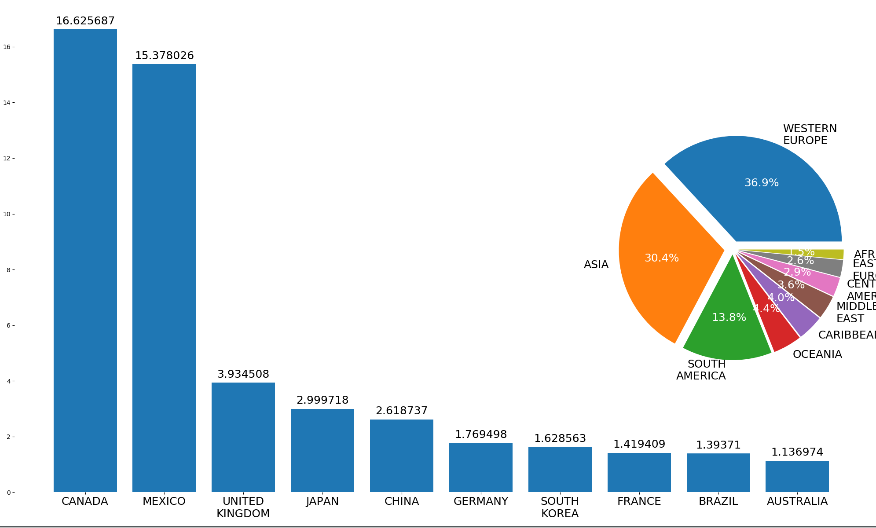
4. insert_axes在第一个图的基础上加入第二个图,这里也做了对条形图的高度加上了文本注释
from mpl_toolkits.axes_grid1.inset_locator import inset_axes


top10_arrivals_countries = ['CANADA','MEXICO','UNITED\nKINGDOM',\
                            'JAPAN','CHINA','GERMANY','SOUTH\nKOREA',\
                            'FRANCE','BRAZIL','AUSTRALIA']
top10_arrivals_values = [16.625687, 15.378026, 3.934508, 2.999718,\
                         2.618737, 1.769498, 1.628563, 1.419409,\
                         1.393710, 1.136974]
arrivals_countries = ['WESTERN\nEUROPE','ASIA','SOUTH\nAMERICA',\
                      'OCEANIA','CARIBBEAN','MIDDLE\nEAST',\
                      'CENTRAL\nAMERICA','EASTERN\nEUROPE','AFRICA']
arrivals_percent = [36.9,30.4,13.8,4.4,4.0,3.6,2.9,2.6,1.5]

# 在每一个条形图上进行文本的添加
def add_text(resc):
    for bar in resc:
        height = bar.get_height()
        # ax1.text 设置文本标签
        ax1.text(bar.get_x() + bar.get_width()/2 , height+0.1, '%s'%height, fontsize=18, ha='center', va='bottom')


# 条形图的绘制
fig, ax1 = plt.subplots(figsize=(20, 12))
vbar = ax1.bar(np.arange(len(top10_arrivals_values)), top10_arrivals_values)
plt.xticks(np.arange(len(top10_arrivals_values)), top10_arrivals_countries, fontsize=18)
# 在第一个坐标系的基础上构造第二个坐标系
ax2 = inset_axes(ax1, width=6, height=6, loc=5)
explode = (0.08, 0.08, 0.05, 0.05,0.05,0.05,0.05,0.05,0.05)
puaches, text, autotext = ax2.pie(arrivals_percent, explode=explode, labels=arrivals_countries, autopct='%1.1f%%')
for text in text + autotext:
    text.set_fontsize(18)

for text in autotext:
    text.set_color('white')
# 去除边框的操作
for spines in ax1.spines.values():
    spines.set_visible(False)

add_text(vbar)
plt.show()
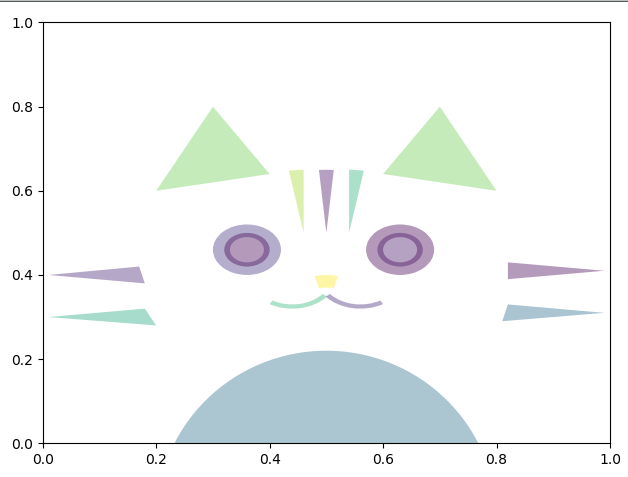
5. 通过一些三角形图案,画出一个猫的形状
import numpy as np
from matplotlib.patches import Circle, Wedge, Polygon, Ellipse
from matplotlib.collections import PatchCollection
import matplotlib.pyplot as plt

fig, ax = plt.subplots()

patches = []

# Full and ring sectors drawn by Wedge((x,y),r,deg1,deg2)
leftstripe = Wedge((.46, .5), .15, 90,100)           # Full sector by default
midstripe = Wedge((.5,.5), .15, 85,95)
rightstripe = Wedge((.54,.5), .15, 80,90)
lefteye = Wedge((.36, .46), .06, 0, 360, width=0.03)  # Ring sector drawn when width <1
righteye = Wedge((.63, .46), .06, 0, 360, width=0.03)
nose = Wedge((.5, .32), .08, 75,105, width=0.03)
mouthleft = Wedge((.44, .4), .08, 240,320, width=0.01)
mouthright = Wedge((.56, .4), .08, 220,300, width=0.01)
patches += [leftstripe,midstripe,rightstripe,lefteye,righteye,nose,mouthleft,mouthright]

# Circles
leftiris = Circle((.36,.46),0.04)
rightiris = Circle((.63,.46),0.04)
patches += [leftiris,rightiris]

# Polygons drawn by passing coordinates of vertices
leftear = Polygon([[.2,.6],[.3,.8],[.4,.64]], True)
rightear = Polygon([[.6,.64],[.7,.8],[.8,.6]], True)
topleftwhisker = Polygon([[.01,.4],[.18,.38],[.17,.42]], True)
bottomleftwhisker = Polygon([[.01,.3],[.18,.32],[.2,.28]], True)
toprightwhisker = Polygon([[.99,.41],[.82,.39],[.82,.43]], True)
bottomrightwhisker = Polygon([[.99,.31],[.82,.33],[.81,.29]], True)
patches+=[leftear,rightear,topleftwhisker,bottomleftwhisker,toprightwhisker,bottomrightwhisker]

body = Ellipse((0.5,-0.18),0.6,0.8)
patches.append(body)

# Draw the patches
colors = 100*np.random.rand(len(patches)) # set random colors
p = PatchCollection(patches, alpha=0.4)
p.set_array(np.array(colors))
ax.add_collection(p)

# Show the figure
plt.show()

 浙公网安备 33010602011771号