
sysbench_fileio.sh
当我--file-total-size=30G 并且指定3个文件的时候,结果是产生3个10G的文件,然而--max-time=20被忽视了,虽然指定了20s的限制,实际上是在prepare阶段,--max-time参数无效
[root@jiangyi01.sqa.zmf /home/ahao.mah/ALIOS_QA/tools/sysbench]
#sysbench --batch --test=fileio --max-requests=0 --max-time=20 --num-threads=10 --file-num=3 --file-block-size=16384 --file-total-size=30G --file-fsync-all=on --file-test-mode=seqwr --file-fsync-freq=100   --file-fsync-mode=fsync --file-fsync-end=on prepare
sysbench 0.5:  multi-threaded system evaluation benchmark

3 files, 10485760Kb each, 30720Mb total
Creating files for the test...
Extra file open flags: 0
Creating file test_file.0


Creating file test_file.1
Creating file test_file.2
32212254720 bytes written in 239.40 seconds (128.32 MB/sec).
可见,确实是3个10G的文件
-rw------- 1 root root 10737418240 Jan 20 14:08 test_file.0
-rw------- 1 root root 10737418240 Jan 20 14:10 test_file.1
-rw------- 1 root root 10737418240 Jan 20 14:11 test_file.2

[root@jiangyi01.sqa.zmf /home/ahao.mah/ALIOS_QA/tools/sysbench]
#echo "10737418240/1024/1024/1024" | bc
10
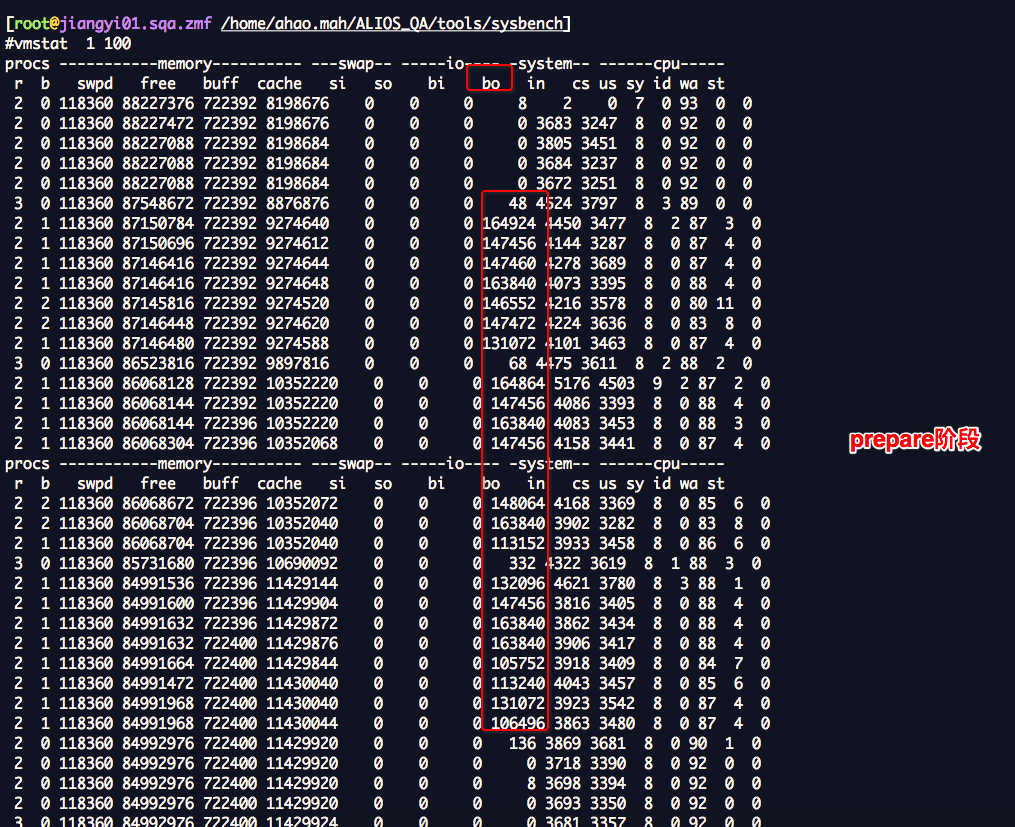
从iostat -dx 可以看到prepare阶段,写入速度却是是在150MB/s左右
[root@jiangyi01.sqa.zmf /home/ahao.mah]
#iostat -dx 1
Device:         rrqm/s   wrqm/s     r/s     w/s    rkB/s    wkB/s avgrq-sz avgqu-sz   await r_await w_await  svctm  %util
sdb               0.00     0.00    0.00    0.00     0.00     0.00     0.00     0.00    0.00    0.00    0.00   0.00   0.00
sda               0.00     0.00    0.00  299.00     0.00 152576.00  1020.58   144.11  433.07    0.00  433.07   3.34 100.00
sdl               0.00     0.00    0.00    0.00     0.00     0.00     0.00     0.00    0.00    0.00    0.00   0.00   0.00
sdg               0.00     0.00    0.00    0.00     0.00     0.00     0.00     0.00    0.00    0.00    0.00   0.00   0.00
sdi               0.00     0.00    0.00    0.00     0.00     0.00     0.00     0.00    0.00    0.00    0.00   0.00   0.00
sdc               0.00     0.00    0.00    0.00     0.00     0.00     0.00     0.00    0.00    0.00    0.00   0.00   0.00
[root@jiangyi01.sqa.zmf /home/ahao.mah]
#echo "152576.00/1024" |bc
149
run阶段 ,可以指定--max-time=10 ,最大运行时间10s,
sysbench --batch --test=fileio --max-requests=0 --max-time=10 --num-threads=10 --file-num=3 --file-block-size=16384 --file-total-size=3G --file-fsync-all=on --file-test-mode=seqwr --file-fsync-freq=100 --file-fsync-mode=fsync --file-fsync-end=on run
[root@jiangyi01.sqa.zmf /home/ahao.mah/ALIOS_QA/tools/sysbench]
#sysbench --batch --test=fileio --max-requests=0 --max-time=10 --num-threads=10 --file-num=3 --file-block-size=16384 --file-total-size=3G --file-fsync-all=on --file-test-mode=seqwr --file-fsync-freq=100   --file-fsync-mode=fsync --file-fsync-end=on run
sysbench 0.5:  multi-threaded system evaluation benchmark

Running the test with following options:
Number of threads: 10
Random number generator seed is 0 and will be ignored


Extra file open flags: 0
3 files, 1Gb each
3Gb total file size
Block size 16Kb
Calling fsync() after each write operation.
Using synchronous I/O mode
Doing sequential write (creation) test
Threads started!

Operations performed:  0 reads, 3236 writes, 3236 Other = 6472 Total
Read 0b  Written 50.562Mb  Total transferred 50.562Mb  (5.053Mb/sec)
  323.39 Requests/sec executed

General statistics:
    total time:                          10.0064s
    total number of events:              3236
    total time taken by event execution: 99.3885s
    response time:
         min:                                 25.02ms
         avg:                                 30.71ms
         max:                                127.37ms
         approx.  95 percentile:              41.80ms

Threads fairness:
    events (avg/stddev):           323.6000/5.73
    execution time (avg/stddev):   9.9388/0.16
[root@jiangyi01.sqa.zmf /home/ahao.mah/ALIOS_QA/tools/sysbench]
#vmstat  1 100
procs -----------memory---------- ---swap-- -----io---- -system-- ------cpu-----
 r  b   swpd   free   buff  cache   si   so    bi    bo   in   cs us sy id wa st
 2  0 118252 88090768 722400 8331964    0    0     0     9    2    0  7  0 93  0  0
 2  0 118252 88090736 722400 8331964    0    0     0    64 3728 3371  8  0 92  0  0
 2  0 118252 88090704 722400 8331964    0    0     0     0 3711 3312  8  0 92  0  0
 3 10 118252 88221872 722400 8199968    0    0     0  1172 5417 6645  8  0 89  2  0
 2  1 118240 88219456 722400 8201592    0    0     0  5028 9756 14749  8  0 85  6  0
 2 10 118240 88216768 722400 8205732    0    0     0  5872 10912 17274  8  0 85  6  0
 2  1 118240 88213424 722400 8210756    0    0     0  5744 10617 16673  8  0 85  6  0
 2  1 118240 88207472 722400 8217140    0    0     0  6080 11200 17877  8  0 85  6  0
 2  1 118240 88199480 722400 8221092    0    0     0  5900 11029 17113  9  0 85  6  0
 2  1 118240 88195040 722400 8226416    0    0     0  6120 10819 17081  8  0 85  6  0
 2  1 118240 88190576 722400 8232228    0    0     0  5896 11299 18021  8  0 85  6  0
 4  7 118240 88185984 722400 8236884    0    0     0  6040 10974 17456  8  0 85  6  0
 2  1 118240 88179416 722400 8243020    0    0     0  6312 11982 19169  8  0 84  7  0
 3  0 118240 88175520 722400 8248028    0    0     0  3536 7896 11291  8  0 88  4  0
 2  0 118240 88173376 722400 8250004    0    0     0     8 3866 3435  8  0 92  0  0
 2  0 118240 88173344 722400 8250036    0    0     0     0 3681 3283  8  0 92  0  0
 2  0 118240 88173344 722400 8250036    0    0     0     0 3706 3308  8  0 92  0  0
 2  0 118240 88173344 722400 8250040    0    0     0     0 3677 3278  8  0 92  0  0
procs -----------memory---------- ---swap-- -----io---- -system-- ------cpu-----
 r  b   swpd   free   buff  cache   si   so    bi    bo   in   cs us sy id wa st
 3  0 118240 88172816 722400 8250040    0    0     0    40 3778 3419  8  0 91  0  0
^C
[root@jiangyi01.sqa.zmf /home/ahao.mah]
#iostat -dx 1 | grep sda
Linux 3.10.0-327.ali2000.alios7.x86_64 (jiangyi01.sqa.zmf) 	01/20/2017 	_x86_64_	(24 CPU)

Device:         rrqm/s   wrqm/s     r/s     w/s    rkB/s    wkB/s avgrq-sz avgqu-sz   await r_await w_await  svctm  %util

sda               0.07     2.86    0.10    3.44     1.83   204.26   116.29     0.17   47.86    5.16   49.14   3.33   1.18
sda               0.00     0.00    0.00    0.00     0.00     0.00     0.00     0.00    0.00    0.00    0.00   0.00   0.00
sda               0.00    42.00    0.00   60.00     0.00  1008.00    33.60     0.49    7.88    0.00    7.88   6.45  38.70
sda               0.00   115.00    0.00  326.00     0.00  5004.00    30.70     1.38    4.27    0.00    4.27   3.06  99.70
sda               0.00   130.00    0.00  384.00     0.00  5896.00    30.71     1.43    3.72    0.00    3.72   2.59  99.60
sda               0.00   128.00    0.00  373.00     0.00  5720.00    30.67     1.41    3.75    0.00    3.75   2.66  99.30
sda               0.00   134.00    0.00  396.00     0.00  6080.00    30.71     1.43    3.62    0.00    3.62   2.51  99.50
sda               0.00   131.00    0.00  384.00     0.00  5900.00    30.73     1.44    3.72    0.00    3.72   2.60  99.80
sda               0.00   139.00    0.00  399.00     0.00  6120.00    30.68     1.49    3.77    0.00    3.77   2.50  99.70
sda               0.00   126.00    0.00  372.00     0.00  5712.00    30.71     1.43    3.80    0.00    3.80   2.68  99.70
sda               0.00   134.00    0.00  396.00     0.00  6080.00    30.71     1.45    3.67    0.00    3.67   2.51  99.50
sda               0.00   140.00    0.00  408.00     0.00  6272.00    30.75     1.50    3.65    0.00    3.65   2.43  99.30
sda               0.00    88.00    0.00  256.00     0.00  3908.00    30.53     0.93    3.72    0.00    3.72   2.43  62.10
sda               0.00     0.00    0.00    2.00     0.00     8.00     8.00     0.00    0.00    0.00    0.00   0.00   0.00
sda               0.00     0.00    0.00    0.00     0.00     0.00     0.00     0.00    0.00    0.00    0.00   0.00   0.00
sda               0.00     0.00    0.00    0.00     0.00     0.00     0.00     0.00    0.00    0.00    0.00   0.00   0.00
sda               0.00     0.00    0.00    0.00     0.00     0.00     0.00     0.00    0.00    0.00    0.00   0.00   0.00
sda               0.00     8.00    0.00    2.00     0.00    40.00    40.00     0.03   16.00    0.00   16.00  16.00   3.20
sda               0.00     0.00    0.00    2.00     0.00     8.00     8.00     0.00    0.00    0.00    0.00   0.00   0.00
sda               0.00     0.00    0.00    0.00     0.00     0.00     0.00     0.00    0.00    0.00    0.00   0.00   0.00
^C
[root@jiangyi01.sqa.zmf /home/ahao.mah]
#pid=`ps axu | grep sysbench | grep -v grep | awk '{print $2}'`;top -Hp $pid

top - 16:13:03 up 7 days,  2:14,  6 users,  load average: 6.44, 3.96, 2.92
Threads:  11 total,   0 running,  11 sleeping,   0 stopped,   0 zombie
%Cpu(s):  8.3 us,  0.3 sy,  0.0 ni, 84.5 id,  6.8 wa,  0.0 hi,  0.0 si,  0.0 st
KiB Mem : 98795000 total, 88215232 free,  1637396 used,  8942372 buff/cache
KiB Swap:  2097148 total,  1979208 free,   117940 used. 96616128 avail Mem

   PID USER      PR  NI    VIRT    RES    SHR S %CPU %MEM     TIME+ COMMAND
 99140 root      20   0   59860   2888   2120 D  2.4  0.0   0:00.03 sysbench
 99141 root      20   0   59860   2888   2120 D  2.4  0.0   0:00.03 sysbench
 99142 root      20   0   59860   2888   2120 D  2.4  0.0   0:00.03 sysbench
 99143 root      20   0   59860   2888   2120 D  2.4  0.0   0:00.03 sysbench
 99145 root      20   0   59860   2888   2120 D  2.4  0.0   0:00.03 sysbench
 99146 root      20   0   59860   2888   2120 D  2.4  0.0   0:00.03 sysbench
 99147 root      20   0   59860   2888   2120 D  2.4  0.0   0:00.03 sysbench
 99148 root      20   0   59860   2888   2120 D  2.4  0.0   0:00.03 sysbench
 99139 root      20   0   59860   2888   2120 S  0.0  0.0   0:00.01 sysbench
 99144 root      20   0   59860   2888   2120 D  0.0  0.0   0:00.03 sysbench
 99149 root      20   0   59860   2888   2120 D  0.0  0.0   0:00.03 sysbench
04:11:36 PM  CPU    %usr   %nice    %sys %iowait    %irq   %soft  %steal  %guest  %gnice   %idle
04:11:37 PM  all    8.33    0.00    0.33    6.21    0.00    0.00    0.00    0.00    0.00   85.12
04:11:37 PM    0    0.00    0.00    0.00    2.00    0.00    0.00    0.00    0.00    0.00   98.00
04:11:37 PM    1  100.00    0.00    0.00    0.00    0.00    0.00    0.00    0.00    0.00    0.00
04:11:37 PM    2  100.00    0.00    0.00    0.00    0.00    0.00    0.00    0.00    0.00    0.00
04:11:37 PM    3    0.00    0.00    0.00    3.00    0.00    0.00    0.00    0.00    0.00   97.00
04:11:37 PM    4    0.00    0.00    0.00    2.02    0.00    0.00    0.00    0.00    0.00   97.98
04:11:37 PM    5    0.00    0.00    0.00    0.00    0.00    0.00    0.00    0.00    0.00  100.00
04:11:37 PM    6    0.00    0.00    1.00    6.00    0.00    0.00    0.00    0.00    0.00   93.00
04:11:37 PM    7    0.00    0.00    0.99   13.86    0.00    0.00    0.00    0.00    0.00   85.15
04:11:37 PM    8    0.00    0.00    0.00    8.08    0.00    0.00    0.00    0.00    0.00   91.92
04:11:37 PM    9    0.00    0.00    0.99    9.90    0.00    0.00    0.00    0.00    0.00   89.11
04:11:37 PM   10    0.00    0.00    0.00   13.13    0.00    0.00    0.00    0.00    0.00   86.87
04:11:37 PM   11    0.00    0.00    1.00   15.00    0.00    0.00    0.00    0.00    0.00   84.00
04:11:37 PM   12    0.00    0.00    0.00    0.00    0.00    0.00    0.00    0.00    0.00  100.00
04:11:37 PM   13    0.00    0.00    0.00    0.00    0.00    0.00    0.00    0.00    0.00  100.00
04:11:37 PM   14    0.00    0.00    0.00    0.00    0.00    0.00    0.00    0.00    0.00  100.00
04:11:37 PM   15    0.00    0.00    0.00    0.00    0.00    0.00    0.00    0.00    0.00  100.00
04:11:37 PM   16    0.00    0.00    0.00    0.00    0.00    0.00    0.00    0.00    0.00  100.00
04:11:37 PM   17    0.00    0.00    0.00    0.00    0.00    0.00    0.00    0.00    0.00  100.00
04:11:37 PM   18    0.00    0.00    0.00    3.00    0.00    0.00    0.00    0.00    0.00   97.00
04:11:37 PM   19    0.00    0.00    0.00    3.03    0.00    0.00    0.00    0.00    0.00   96.97
04:11:37 PM   20    0.00    0.00    0.99   63.37    0.00    0.00    0.00    0.00    0.00   35.64
04:11:37 PM   21    0.00    0.00    0.00    4.00    0.00    0.00    0.00    0.00    0.00   96.00
04:11:37 PM   22    0.00    0.00    1.00    2.00    0.00    0.00    0.00    0.00    0.00   97.00
04:11:37 PM   23    0.00    0.00    0.00    2.00    0.00    0.00    0.00    0.00    0.00   98.00

04:11:37 PM  CPU    %usr   %nice    %sys %iowait    %irq   %soft  %steal  %guest  %gnice   %idle
04:11:38 PM  all    8.34    0.00    0.25    6.09    0.00    0.00    0.00    0.00    0.00   85.32
04:11:38 PM    0    0.00    0.00    0.00    0.00    0.00    0.00    0.00    0.00    0.00  100.00
04:11:38 PM    1  100.00    0.00    0.00    0.00    0.00    0.00    0.00    0.00    0.00    0.00
04:11:38 PM    2  100.00    0.00    0.00    0.00    0.00    0.00    0.00    0.00    0.00    0.00
04:11:38 PM    3    0.00    0.00    0.00    0.00    0.00    0.00    0.00    0.00    0.00  100.00
04:11:38 PM    4    0.00    0.00    0.00    0.00    0.00    0.00    0.00    0.00    0.00  100.00
04:11:38 PM    5    0.00    0.00    0.00    0.00    0.00    0.00    0.00    0.00    0.00  100.00
04:11:38 PM    6    0.00    0.00    0.00   23.23    0.00    0.00    0.00    0.00    0.00   76.77
04:11:38 PM    7    0.00    0.00    1.00   36.00    0.00    0.00    0.00    0.00    0.00   63.00
04:11:38 PM    8    0.00    0.00    1.00   18.00    0.00    0.00    0.00    0.00    0.00   81.00
04:11:38 PM    9    0.00    0.00    1.00   23.00    0.00    0.00    0.00    0.00    0.00   76.00
04:11:38 PM   10    0.00    0.00    1.00    9.00    0.00    0.00    0.00    0.00    0.00   90.00
04:11:38 PM   11    0.00    0.00    0.00   16.16    0.00    0.00    0.00    0.00    0.00   83.84
04:11:38 PM   12    0.00    0.00    0.00    0.00    0.00    0.00    0.00    0.00    0.00  100.00
04:11:38 PM   13    0.00    0.00    0.00    0.00    0.00    0.00    0.00    0.00    0.00  100.00
04:11:38 PM   14    0.00    0.00    0.00    0.00    0.00    0.00    0.00    0.00    0.00  100.00
04:11:38 PM   15    0.00    0.00    0.00    0.00    0.00    0.00    0.00    0.00    0.00  100.00
04:11:38 PM   16    0.00    0.00    0.00    0.00    0.00    0.00    0.00    0.00    0.00  100.00
04:11:38 PM   17    0.00    0.00    0.00    0.00    0.00    0.00    0.00    0.00    0.00  100.00
04:11:38 PM   18    0.00    0.00    0.00    2.02    0.00    0.00    0.00    0.00    0.00   97.98
04:11:38 PM   19    0.00    0.00    0.99    2.97    0.00    0.00    0.00    0.00    0.00   96.04
04:11:38 PM   20    0.00    0.00    0.00    4.00    0.00    0.00    0.00    0.00    0.00   96.00
04:11:38 PM   21    0.00    0.00    1.00    3.00    0.00    0.00    0.00    0.00    0.00   96.00
04:11:38 PM   22    0.00    0.00    0.00    4.00    0.00    0.00    0.00    0.00    0.00   96.00
04:11:38 PM   23    0.00    0.00    0.00    4.00    0.00    0.00    0.00    0.00    0.00   96.00
对比
[root@dnstest08.tbc /home/ahao.mah/muahao01]
#sysbench --batch --test=fileio --max-requests=0 --max-time=10 --num-threads=10 --file-num=3 --file-block-size=16384 --file-total-size=3G --file-fsync-all=on --file-test-mode=seqwr --file-fsync-freq=100   --file-fsync-mode=fsync --file-fsync-end=on prepare
sysbench 0.5:  multi-threaded system evaluation benchmark

3 files, 1048576Kb each, 3072Mb total
Creating files for the test...
Extra file open flags: 0
Creating file test_file.0
Creating file test_file.1
Creating file test_file.2
3221225472 bytes written in 21.19 seconds (144.99 MB/sec).

[root@dnstest08.tbc /home/ahao.mah/muahao01]
#sysbench --batch --test=fileio --max-requests=0 --max-time=10 --num-threads=10 --file-num=3 --file-block-size=16384 --file-total-size=3G --file-fsync-all=on --file-test-mode=seqwr --file-fsync-freq=100   --file-fsync-mode=fsync --file-fsync-end=on run
sysbench 0.5:  multi-threaded system evaluation benchmark

Running the test with following options:
Number of threads: 10
Random number generator seed is 0 and will be ignored


Extra file open flags: 0
3 files, 1Gb each
3Gb total file size
Block size 16Kb
Calling fsync() after each write operation.
Using synchronous I/O mode
Doing sequential write (creation) test
Threads started!

Operations performed:  0 reads, 17863 writes, 17863 Other = 35726 Total
Read 0b  Written 279.11Mb  Total transferred 279.11Mb  (27.907Mb/sec)
 1786.02 Requests/sec executed

General statistics:
    total time:                          10.0016s
    total number of events:              17863
    total time taken by event execution: 99.9587s
    response time:
         min:                                  0.49ms
         avg:                                  5.60ms
         max:                                 44.90ms
         approx.  95 percentile:              10.50ms

Threads fairness:
    events (avg/stddev):           1786.3000/12.69
    execution time (avg/stddev):   9.9959/0.00
[root@jiangyi01.sqa.zmf /home/ahao.mah/ALIOS_QA/tools/sysbench]
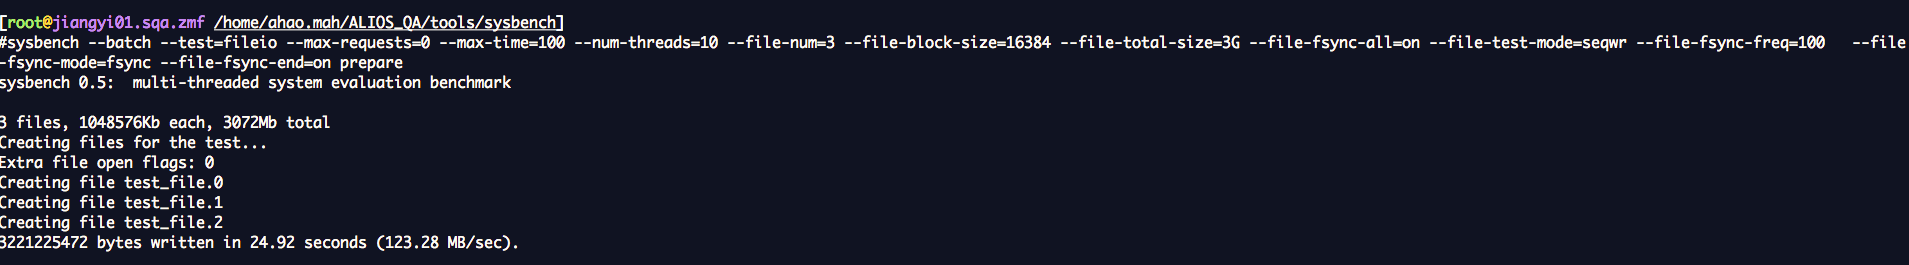
#sysbench --batch --test=fileio --max-requests=0 --max-time=10 --num-threads=10 --file-num=3 --file-block-size=16384 --file-total-size=3G --file-fsync-all=on --file-test-mode=seqwr --file-fsync-freq=100 --file-fsync-mode=fsync --file-fsync-end=on prepare
sysbench 0.5: multi-threaded system evaluation benchmark
3 files, 1048576Kb each, 3072Mb total
Creating files for the test...
Extra file open flags: 0
Creating file test_file.0
Creating file test_file.1
Creating file test_file.2
3221225472 bytes written in 24.05 seconds (127.76 MB/sec).
[root@jiangyi01.sqa.zmf /home/ahao.mah/ALIOS_QA/tools/sysbench]
#sysbench --batch --test=fileio --max-requests=0 --max-time=10 --num-threads=10 --file-num=3 --file-block-size=16384 --file-total-size=3G --file-fsync-all=on --file-test-mode=seqwr --file-fsync-freq=100 --file-fsync-mode=fsync --file-fsync-end=on run
sysbench 0.5: multi-threaded system evaluation benchmark
Running the test with following options:
Number of threads: 10
Random number generator seed is 0 and will be ignored
Extra file open flags: 0
3 files, 1Gb each
3Gb total file size
Block size 16Kb
Calling fsync() after each write operation.
Using synchronous I/O mode
Doing sequential write (creation) test
Threads started!
Operations performed: 0 reads, 3320 writes, 3320 Other = 6640 Total
Read 0b Written 51.875Mb Total transferred 51.875Mb (5.1828Mb/sec)
331.70 Requests/sec executed
General statistics:
total time: 10.0091s
total number of events: 3320
total time taken by event execution: 99.7836s
response time:
min: 21.76ms
avg: 30.06ms
max: 183.33ms
approx. 95 percentile: 41.78ms
Threads fairness:
events (avg/stddev): 332.0000/3.00
execution time (avg/stddev): 9.9784/0.08
muahao@aliyun.com

