
Software for drawing bayesian networks (graphical models)
这里需要调用 latex 中的绘图库:TikZ and PGF。
注意,下述 tex 代码使用 pdflatex (不是 pdflex)进行编译。
\documentclass[11pt]{report}
\usepackage{tikz}
\usetikzlibrary{fit,positioning}
\begin{document}
\begin{figure}
\centering
\begin{tikzpicture}
\tikzstyle{main}=[circle, minimum size = 10mm, thick, draw =black!80, node distance = 16mm]
\tikzstyle{connect}=[-latex, thick]
\tikzstyle{box}=[rectangle, draw=black!100]
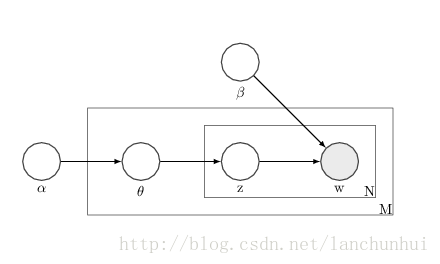
% 节点的定义,图中的圆
\node[main, fill = white!100] (alpha) [label=below:$\alpha$] { };
\node[main] (theta) [right=of alpha,label=below:$\theta$] { };
\node[main] (z) [right=of theta,label=below:z] {};
\node[main] (beta) [above=of z,label=below:$\beta$] { };
\node[main, fill = black!10] (w) [right=of z,label=below:w] { };
% 边的定义,
\path (alpha) edge [connect] (theta)
(theta) edge [connect] (z)
(z) edge [connect] (w)
(beta) edge [connect] (w);
% 节点的定义,图中的矩形
\node[rectangle, inner sep=0mm, fit= (z) (w),label=below right:N, xshift=13mm] {};
\node[rectangle, inner sep=4.4mm,draw=black!100, fit= (z) (w)] {};
\node[rectangle, inner sep=4.6mm, fit= (z) (w),label=below right:M, xshift=12.5mm] {};
\node[rectangle, inner sep=9mm, draw=black!100, fit = (theta) (z) (w)] {};
\end{tikzpicture}
\end{figure}
\end{document}
%note - compiled with pdflatex
 浙公网安备 33010602011771号