from sklearn import datasets
from sklearn import svm
import numpy as np
from sklearn.model_selection import train_test_split
import matplotlib.pyplot as plt
def make_data():
dat = datasets.load_iris() #载入鸢尾花数据
data = dat['data']
label = dat['target']
new_index = np.random.permutation(range(len(label))) #随机打乱数据
data = data[new_index][:, 2:4] # 并选用后两种特征值作为分类依据
label = label[new_index]
train_x, test_x, train_y, test_y = train_test_split( # 拆分训练 测试集 7:3
data, label, test_size=0.3)
return train_x, test_x, train_y, test_y
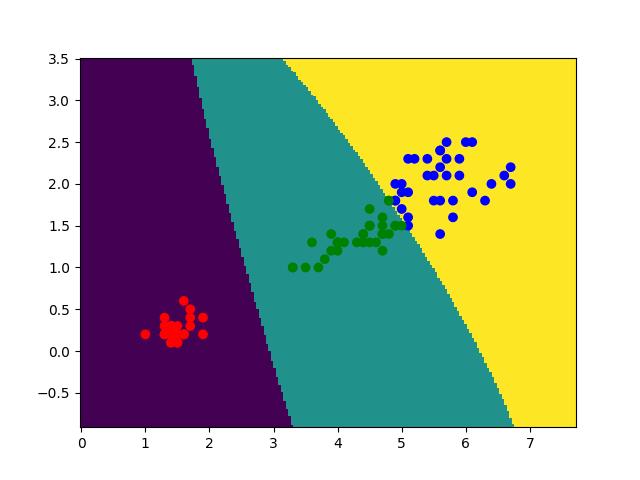
def paint(data):
x, y = np.split(data, indices_or_sections=[1], axis=1)
x_s = np.linspace(x.ravel().min()-1, x.ravel().max()+1, 200)
y_s = np.linspace(y.ravel().min()-1, y.ravel().max()+1, 200)
xx, yy = np.meshgrid(x_s, y_s) # 生成网格
resx = np.stack((xx.ravel(), yy.ravel()), axis=1) # 对生成的网格 再用向量机测试出结果
new = svc.predict(resx).reshape(xx.shape)
plt.pcolormesh(xx, yy, new) # 画区域图
plt.scatter(data[:, 0], data[:, 1], c=res_color) # 画散点图
plt.savefig('svm_iris.jpg')
plt.show()
if __name__ == '__main__':
train_x, test_x, train_y, test_y = make_data()
svc = svm.SVC(C=0.5, kernel='rbf', decision_function_shape='ovr',
probability=True).fit(train_x, train_y)
res_train = svc.predict(train_x)
ds = {0: 'r', 1: 'g', 2: 'b'}
res_color = list(map(lambda x: ds.get(x), res_train))
res = svc.predict(test_x) # 对 测试集预测
print(f'测试集准确率:{(res == test_y).sum()/len(res)}') # 计算 测试集准确度
ast = svc.predict_proba(test_x) # 测试集每个结果的概率值
# print(ast)
paint(train_x)