系统监控-Docker环境下安装prometheus+grafana
prometheus安装
官网地址:https://prometheus.io/docs/prometheus/latest/installation/
配置文件:
global:
  scrape_interval: 15s
  scrape_timeout: 10s
  evaluation_interval: 15s
alerting:
  alertmanagers:
  - follow_redirects: true
    scheme: http
    timeout: 10s
    api_version: v2
    static_configs:
    - targets: []
scrape_configs:
- job_name: prometheus
  honor_timestamps: true
  scrape_interval: 15s
  scrape_timeout: 10s
  metrics_path: /metrics
  scheme: http
  follow_redirects: true
  static_configs:
  - targets:
    - localhost:9090
启动
docker run -d -p 9090:9090 prom/prometheus

# 指定配置文件启动
docker run -d -p 9090:9090 -v /opt/prometheus/prometheus.yml:/etc/prometheus/prometheus.yml prom/prometheus
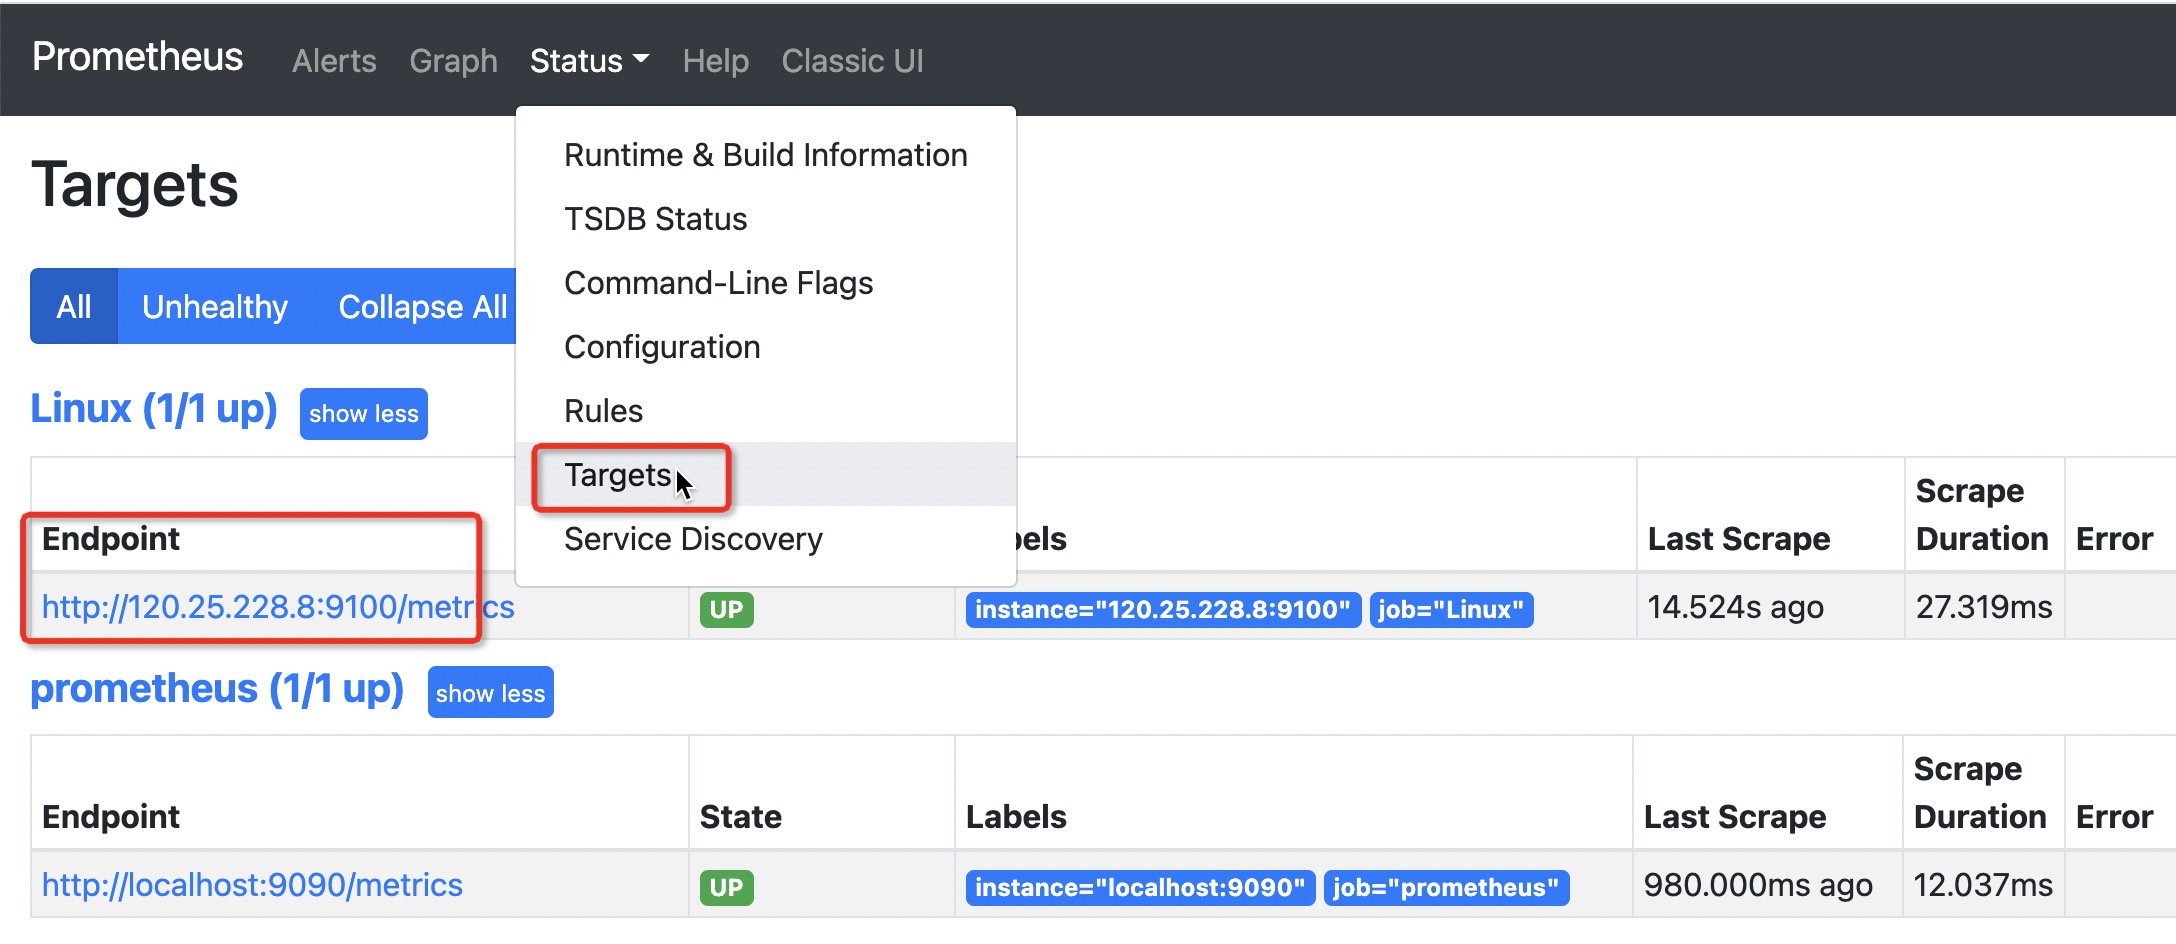
监控Linux主机
下载 node_exporter : https://prometheus.io/download/
修改配置文件:
- job_name: Linux
  static_configs:
  - targets:
    - localhost:9100
启动node_exporter
nohup ./node_exporter &
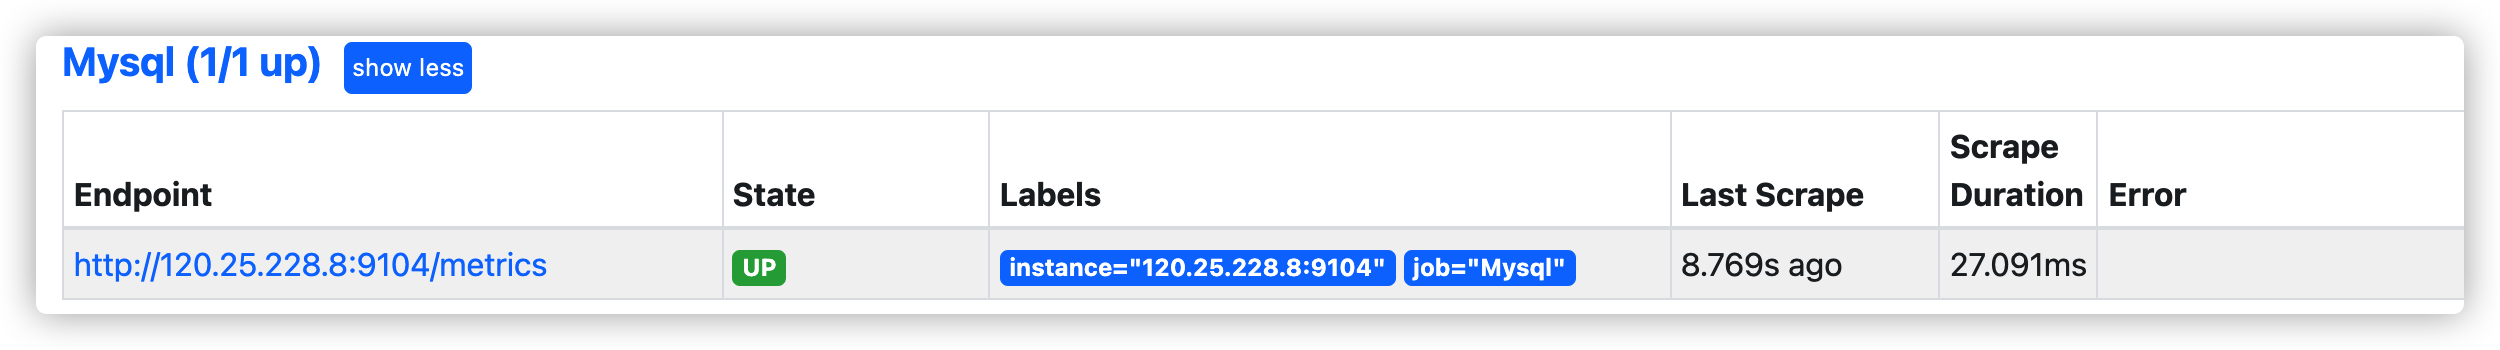
监控docker容器中的Mysql
mysqld-exporter安装:https://github.com/prometheus/mysqld_exporter
docker network create my-mysql-network
docker pull prom/mysqld-exporter

docker run -d \
  -p 9104:9104 \
  --network my-mysql-network  \
  -e DATA_SOURCE_NAME="user:password@(hostname:3306)/" \
  prom/mysqld-exporter
修改配置
- job_name: Mysql
  static_configs:
  - targets: ['ip:9104']
重启prometheus
docker restart id
安装grafana
官方地址: https://grafana.com/grafana/download?platform=docker
docker info # 查看docker信息

docker run -d --name=grafana -p 3000:3000 grafana/grafana-enterprise:8.3.3-ubuntu
默认账号: admin/admin

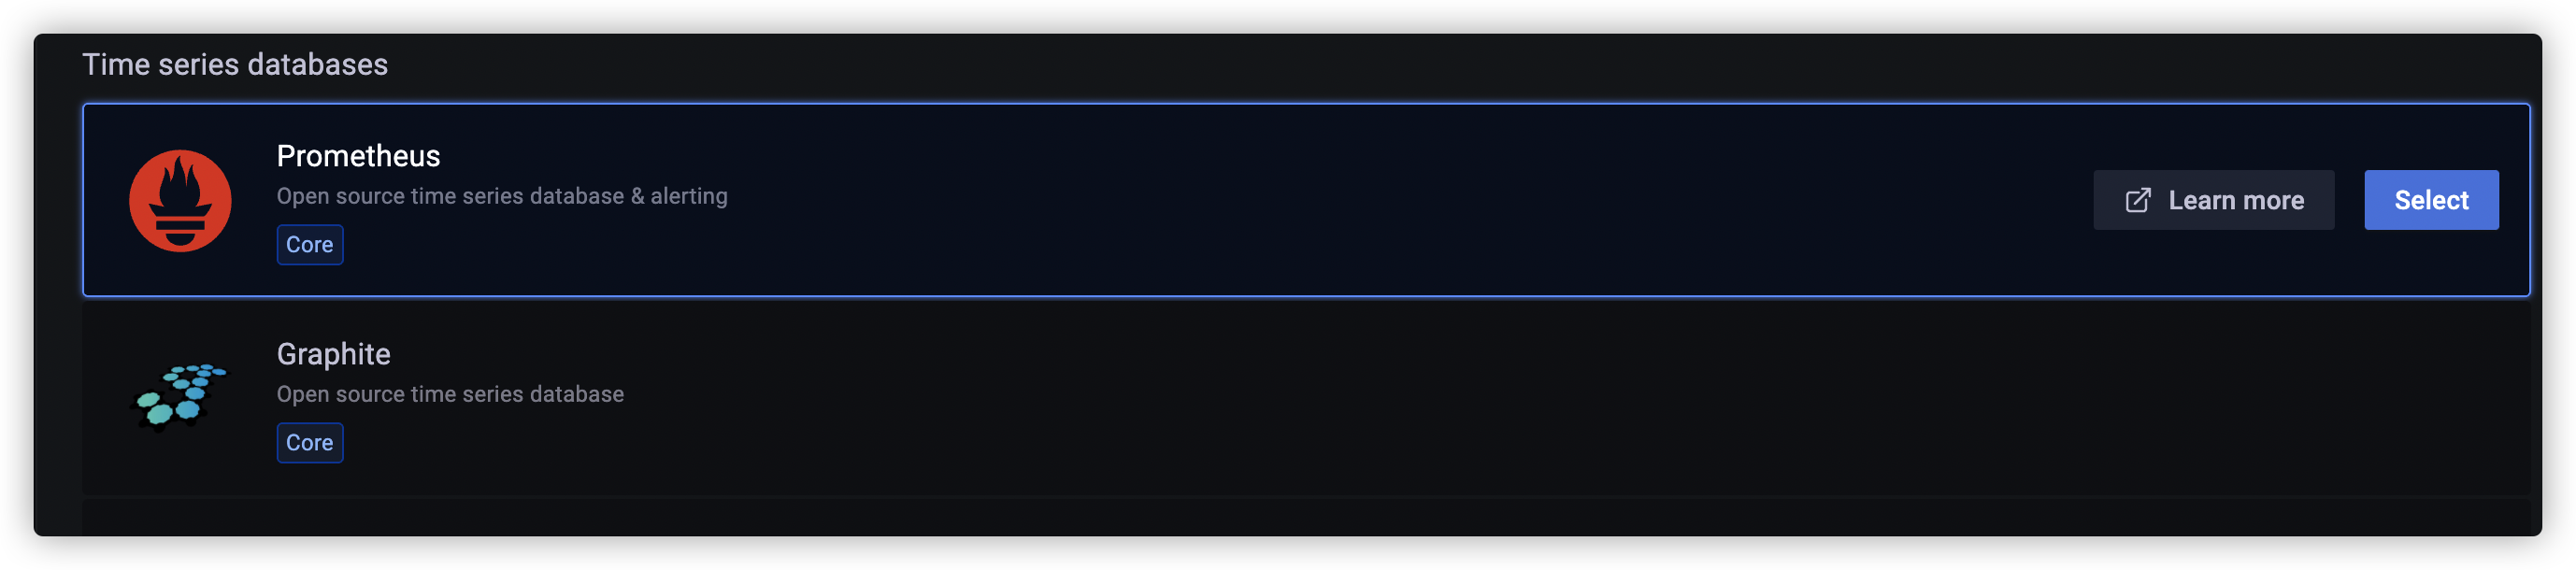
添加数据源
选择configuration --> Data Sources
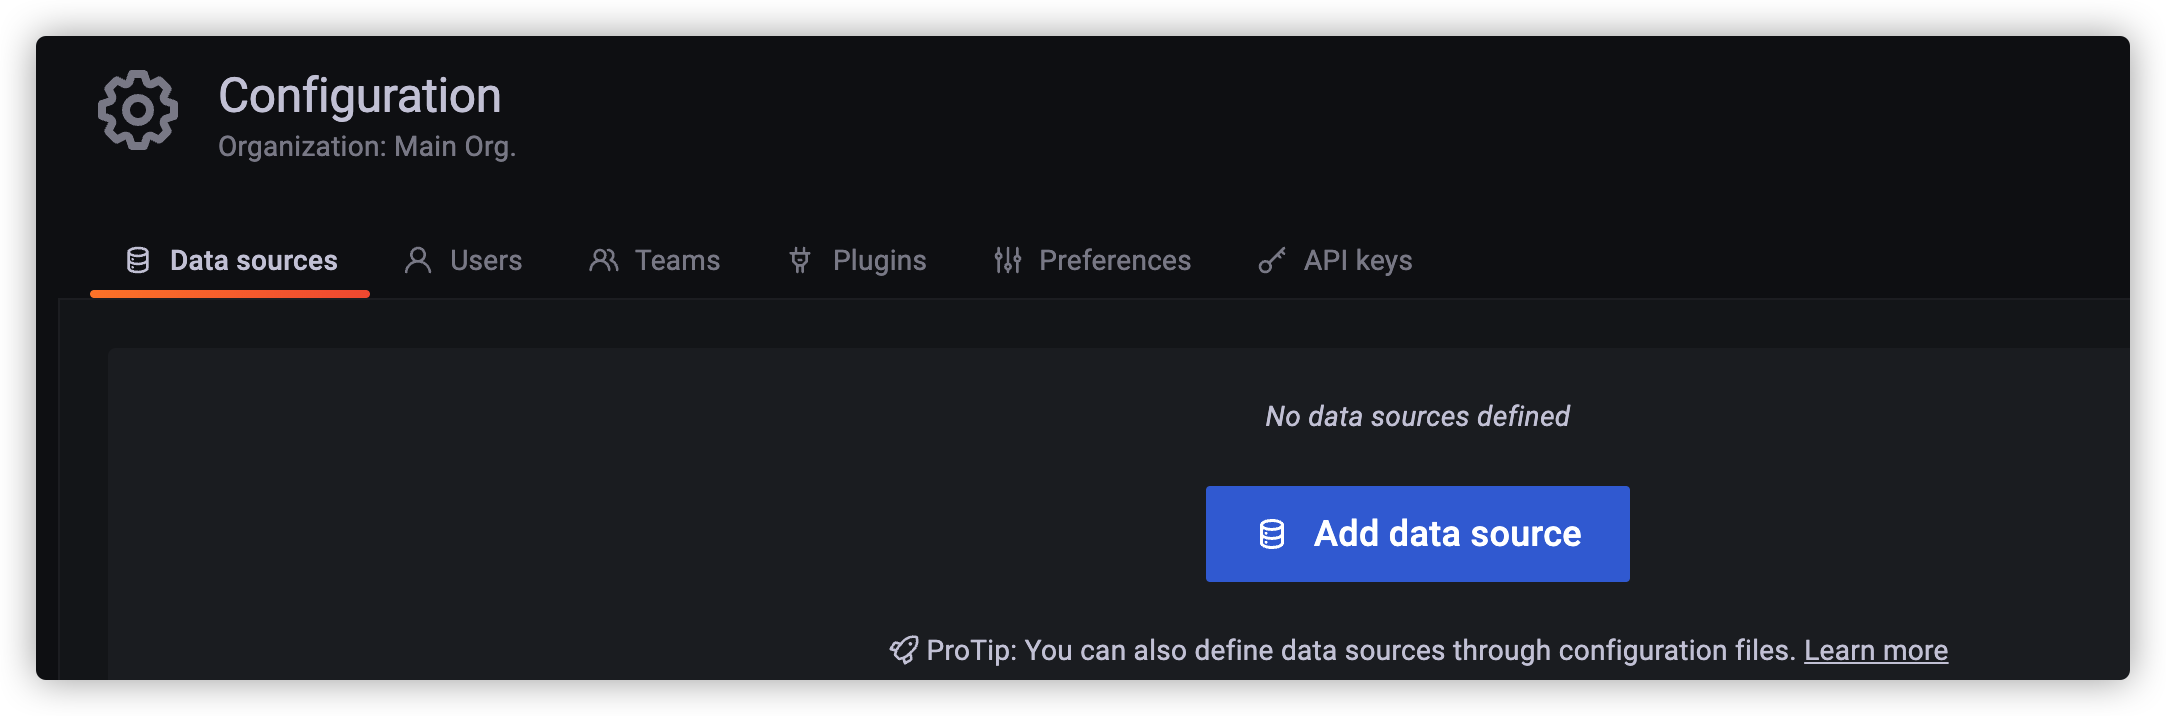
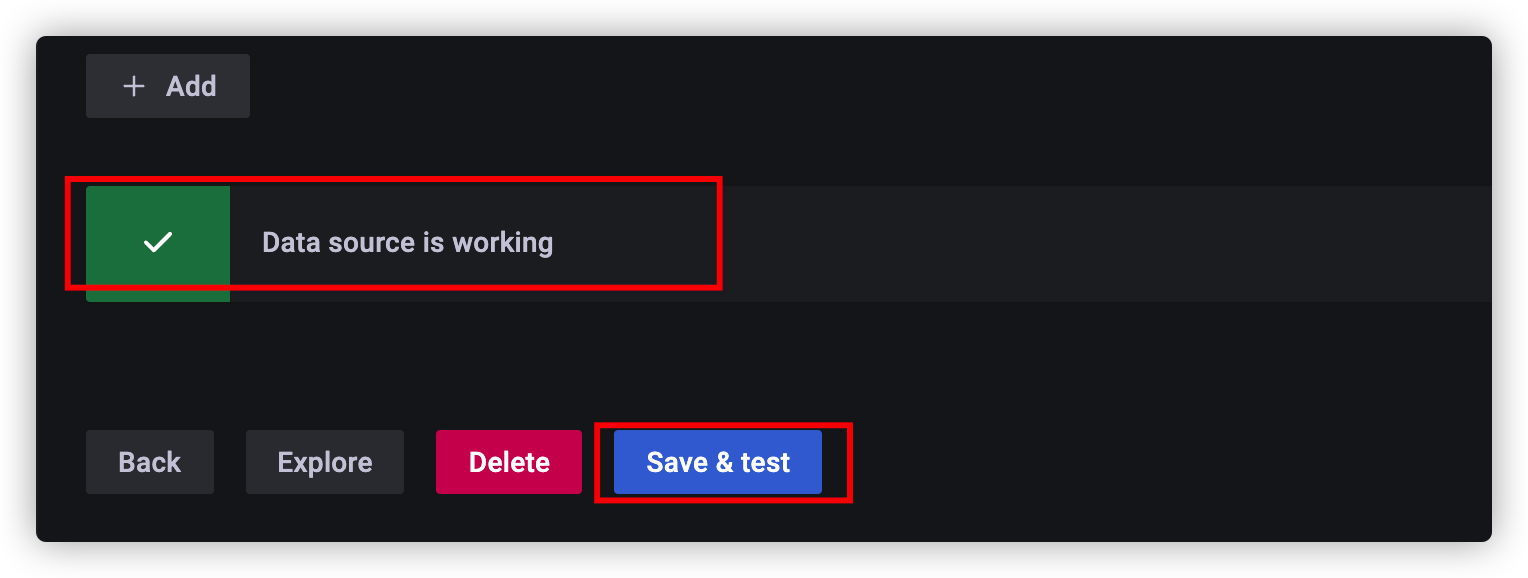
设置URL地址 保存设置后提示如下信息就代表成功
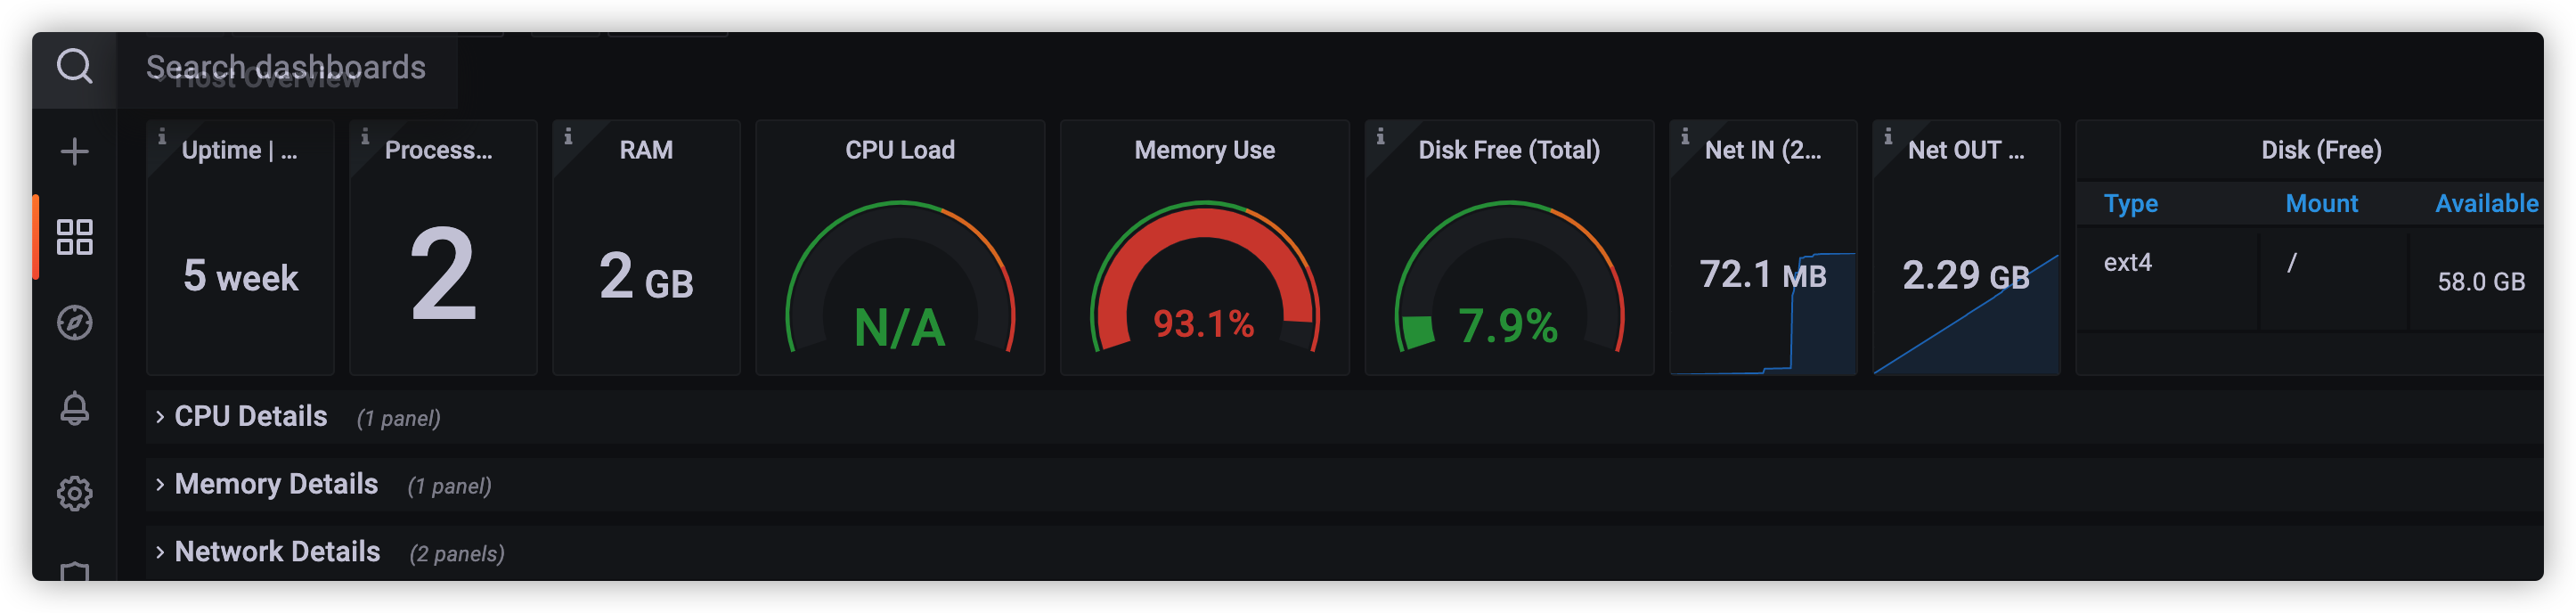
创建仪表盘
通过模版添加: https://grafana.com/grafana/dashboards/
在模版网站选定模版ID后 再下方输入即可

我这里选择的是模版ID为 10180 导入完成即可
推荐几个比较详细的模版: 1860 或者 10242
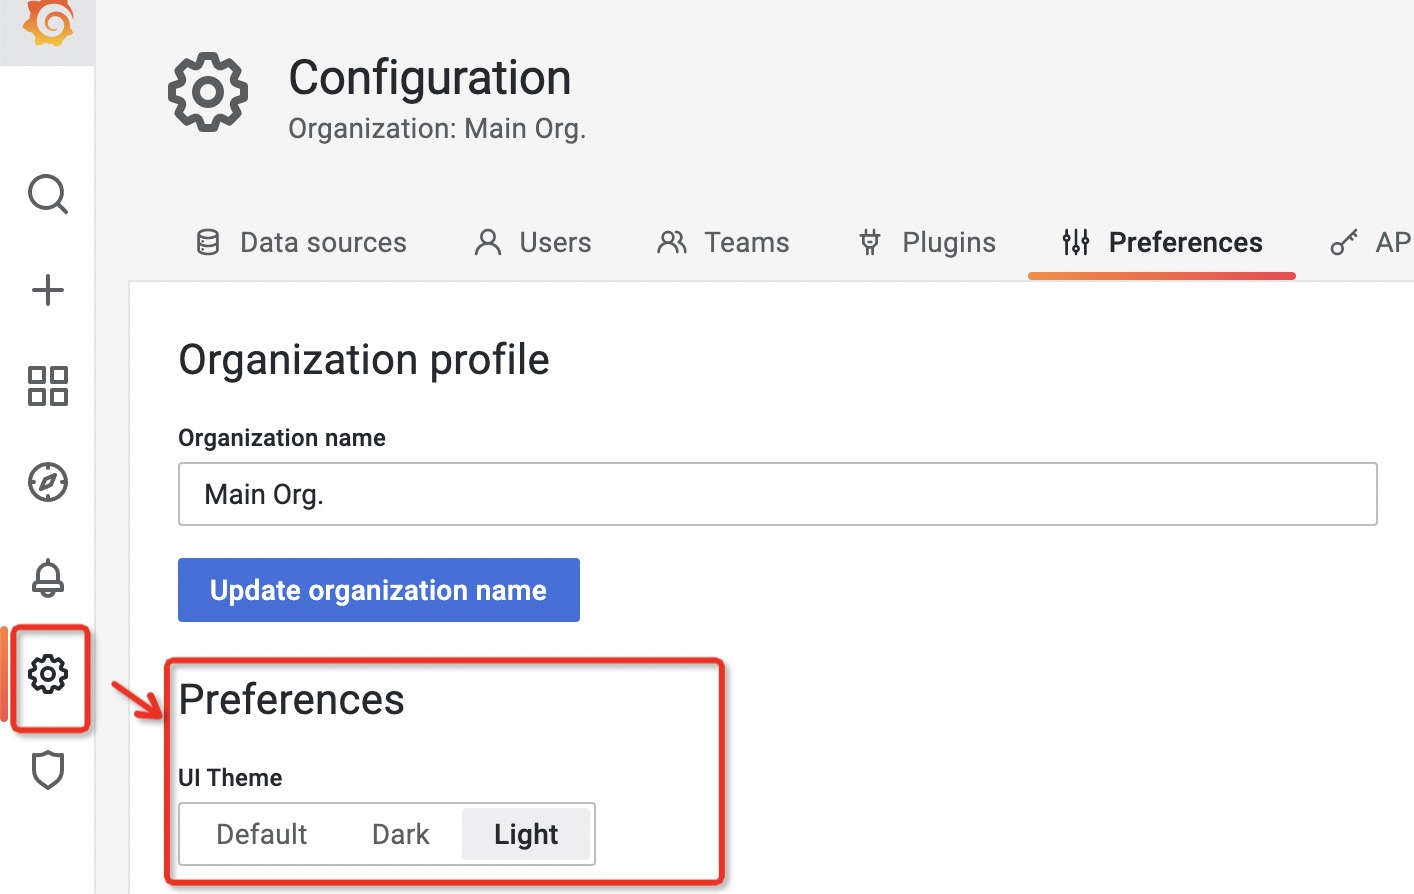
修改界面样式