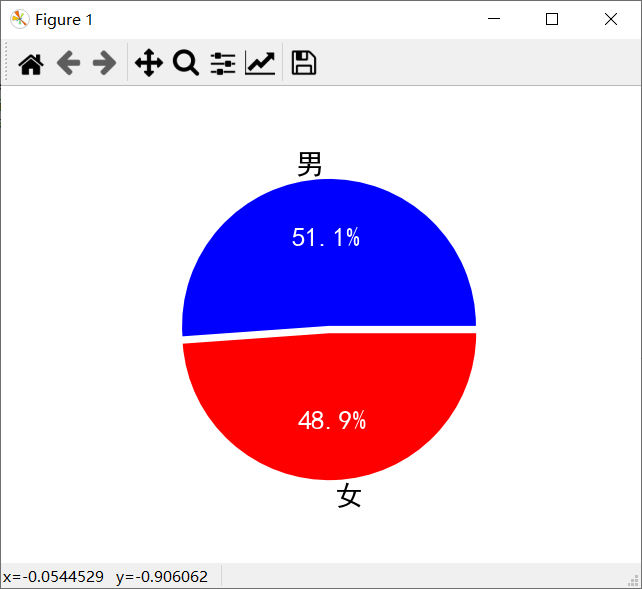
绘制饼状图
 1 import matplotlib.pyplot as plt
 2 import numpy as np
 3 #准备女生的人数及比例
 4 man = 71351
 5 women = 68187
 6 man_perc = man/(women+man)
 7 women_perc = women/(women+man)
 8 #添加名称
 9 labels = ['男','女']
10 #添加颜色
11 colors = ['blue','red']
12 #绘制饼状图 pie
13 paches,texts,autotexts = plt.pie([man_perc,women_perc],labels=labels,colors=colors,explode=(0,0.05),autopct='%0.1f%%')
14 # labels 名称, colors 颜色, explode 分裂, autopct 显示百分比
15 plt.rcParams['font.sans-serif']=['SimHei'] #用来正常显示中文标签
16 #设置饼状图中的字体颜色
17 for text in autotexts:
18     text.set_color('white')
19 #设置字体大小
20 for text in texts+autotexts:
21     text.set_fontsize(20)
22 plt.show()
正是江南好风景
