

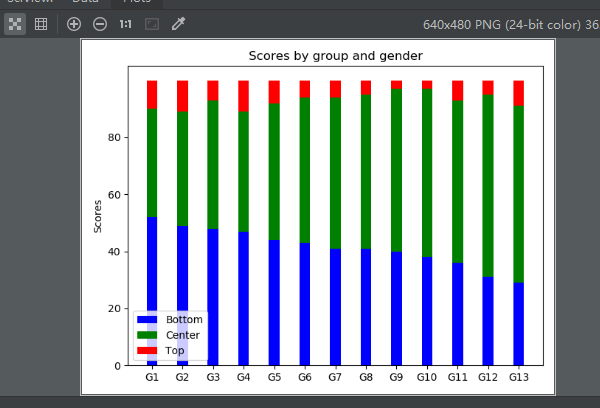
我们先来看一个结果图
看到这个图,我个人的思路是
1 设置标题
import numpy as np
import matplotlib.pyplot as plt

plt.title('Scores by group and gender')
2 x坐标的间隔设置和文字设置
N = 13
ind = np.arange(N)  #[ 0  1  2  3  4  5  6  7  8  9 10 11 12]
plt.xticks(ind, ('G1', 'G2', 'G3', 'G4', 'G5', 'G6', 'G7', 'G8', 'G9', 'G10', 'G11', 'G12', 'G13'))
3 y坐标的文字设置和间隔设置
plt.yticks(np.arange(0, 81, 20)) #0到81 间隔20
plt.ylabel('Scores')
4 开始绘制主题条形图
Bottom = (52, 49, 48, 47, 44, 43, 41, 41, 40, 38, 36, 31, 29)
Center = (38, 40, 45, 42, 48, 51, 53, 54, 57, 59, 57, 64, 62)
Top = (10, 11, 7, 11, 8, 6, 6, 5, 3, 3, 7, 5, 9)

d = []
for i in range(0, len(Bottom)):
    sum = Bottom[i] + Center[i]
    d.append(sum)

width = 0.35  # 设置条形图一个长条的宽度

p1 = plt.bar(ind, Bottom, width, color='blue')
p2 = plt.bar(ind, Center, width, bottom=Bottom,color='green')  #在p1的基础上绘制,底部数据就是p1的数据
p3 = plt.bar(ind, Top, width, bottom=d,color='red')    #在p1和p2的基础上绘制,底部数据就是p1和p2
5 设置legend区分三部分数据
plt.legend((p1[0], p2[0], p3[0]), ('Bottom', 'Center', 'Top'),loc = 3) #loc=3 表示lower left 也就是底部最左
loc的设置参数
'best'         : 0, (only implemented for axes legends)(自适应方式)
'upper right'  : 1,
'upper left'   : 2,
'lower left'   : 3,
'lower right'  : 4,
'right'        : 5,
'center left'  : 6,
'center right' : 7,
'lower center' : 8,
'upper center' : 9,
'center'       : 10,
6 绘制出图形
plt.show()
7 最终代码为:
import numpy as np
import matplotlib.pyplot as plt

plt.title('Scores by group and gender')

N = 13
ind = np.arange(N)  #[ 0  1  2  3  4  5  6  7  8  9 10 11 12]
plt.xticks(ind, ('G1', 'G2', 'G3', 'G4', 'G5', 'G6', 'G7', 'G8', 'G9', 'G10', 'G11', 'G12', 'G13'))

plt.ylabel('Scores')
plt.yticks(np.arange(0, 81, 20))

Bottom = (52, 49, 48, 47, 44, 43, 41, 41, 40, 38, 36, 31, 29)
Center = (38, 40, 45, 42, 48, 51, 53, 54, 57, 59, 57, 64, 62)
Top = (10, 11, 7, 11, 8, 6, 6, 5, 3, 3, 7, 5, 9)

d = []
for i in range(0, len(Bottom)):
    sum = Bottom[i] + Center[i]
    d.append(sum)

width = 0.35  # 设置条形图一个长条的宽度
p1 = plt.bar(ind, Bottom, width, color='blue')
p2 = plt.bar(ind, Center, width, bottom=Bottom,color='green')
p3 = plt.bar(ind, Top, width, bottom=d,color='red')

plt.legend((p1[0], p2[0], p3[0]), ('Bottom', 'Center', 'Top'),loc = 3)

plt.show()

